| Oracle® Health Sciences Pharmacovigilance Operational Analytics User and Administrator Guide Release 1.0 E23554-01 |
|
|
PDF · Mobi · ePub |
| Oracle® Health Sciences Pharmacovigilance Operational Analytics User and Administrator Guide Release 1.0 E23554-01 |
|
|
PDF · Mobi · ePub |
This chapter contains the following topics:
Note:
The appearance of the user interface that you see in the application may vary from the figures displayed in the subsequent sections.See Also:
Oracle Business Intelligence Administrator Guide and User Guide
OPVA includes dashboards, reports, and metrics that let you view relevant, interactive information—current as at the last date the data warehouse was refreshed. It also includes dashboards and reports to access the run-time data.
Dashboards are access points for information. Each dashboard is designed for a specific job responsibility.
When you access a dashboard, the information displayed changes based on your security privileges. For example, a user with BIConsumer application role may not be able to see the same data as the user with BIAuthor role.
A dashboard contains one or more related dashboard pages. A dashboard page contains a series of related reports (also called requests). A report can contain a tabular report, pivot table, or graph. You can drill down to detailed report by clicking the linked data. You can also filter the data that you see in reports using a set of parameters (called filters). Figure 2-1 displays the report hierarchy.
In addition to the dashboards and reports that are packaged with OPVA, you can also create and manage reports or dashboards if you have appropriate permissions. Use Oracle BI Analysis to manage reports.
OBIEE includes additional applications that are not directly used by OPVA. These include Oracle BI Agents and Oracle BI Publisher. These applications extend the usefulness of the information provided by OPVA.
Use Oracle BI Agents to detect specific analytic results and notify appropriate user or group about the result. Use Oracle BI Publisher to create formatted and printable reports.
See Also:
Chapter 3, "Working with Reports" for more information about creating and managing reports.
Appendix B, " OPVA Presentation Catalog" for more information about the columns in OPVA that you can use to create and modify reports.
Oracle Business Intelligence Administrator Guide and User Guide.
Your security privileges determine what reports you can see and what you can do in OPVA.
Oracle BI helps end-users obtain, view, and analyze the data. After the data has been organized and analyzed, it can provide an organization with the metrics to measure the state of Safety data. These capabilities enable the pharmaceutical organization to make better decisions, take informed action, and implement more efficient business processes.
To log in to OPVA, you must have a browser on your computer and a URL, username, and password provided by your company. For the list of supported browsers, versions, and platforms, refer to the OPVA Installation Guide.
Open your browser and enter the URL provided by your company.
Typically, the URL to access the dashboards will be
http://<system_name_or_ip_address>:<port_number>/analytics/saw.dll?Dashboard
Figure 2-2 displays the OPVA login page.
Enter your user ID and password.
Click Login.
After your login credentials are authenticated, your default dashboard page is displayed.
In the Oracle BI Enterprise Edition (BI EE), you can work with:
Analysis
This area of OBIEE is also known as Answers. Analysis are queries against an organization's data that provide answers to business questions. Analysis allows you to explore and interact with information by visually presenting data in easy-to-understand formats (such as tables and graphs). You can save, organize, and share the results of analysis. Your organization might also have purchased prebuilt analysis specific to your industry. Pre-built analysis can be used as purchased or modified to suit the information needs of your business.
Dashboards
This area of OBIEE is also known as Interactive Dashboards. Dashboards provide personalized views of corporate and external information. A dashboard consists of one or more pages that contain content, such as analyses, links to Web sites, Oracle BI Publisher reports, and so on. Dashboards allow you to provide end users with access to analytics information. Your organization might also have purchased preconfigured dashboards that contain prebuilt analyses specific to your industry.
Filters, Selection Steps, and Prompts
Filters, selection steps, and prompts allow you to limit or specify the data that is displayed in dashboards and analyses.
Agents
This area of OBIEE is also known as Delivers. Agents enable you to automate your business processes. You can use agents to provide event-driven alerting, scheduled content publishing, and conditional event-driven action execution. Agents can be scheduled or can be triggered by a specific condition, which enables you to deliver timely information to users.
Conditions
Conditions are objects that return a single Boolean value that is based on the evaluation of an analysis or of a Key Performance Indicator (KPI). You use conditions to determine whether something is to be done, for example whether an agent is to deliver its content.
Actions
Actions provide functionality to navigate to related content or to invoke operations, functions, or processes in external systems. You can include actions in various objects, such as analyses and dashboard pages. Actions allow users to take the proper action based on the business insight that they gained from the data that they received.
Scorecards
This area of OBIEE is known as Oracle Scorecard and Strategy Management. Scorecards allow you to model the objectives and initiatives that comprise your corporate strategy, evaluate their performance by assigning KPIs, and determine and display overall performance.
Other Products
OBIEE interacts in various ways with other products. For example, with the Oracle Business Intelligence Add-in for Microsoft Office, you can access and run analyses from OBIEE directly within your Microsoft Office workspace.
Dashboards provide personalized views of corporate and external information. A dashboard consists of one or more pages. Pages can display anything that you can access or open with a Web browser, including the following:
The results of analysis - The result of an analysis is the output returned from the Oracle BI Server that matches the analysis criteria. It can be shown in various views, such as a table, graph, and gauge. Users can examine and analyze results, print as PDF or HTML, save as PDF, or export them to a spreadsheet.
Alerts from agents
Action links and action link menus
Images
Text
Views of folders in the Oracle BI Presentation Catalog
Links to websites
Links to documents
Embedded content (such as Web pages or documents)
Oracle BI Publisher Reports
When you open a dashboard, the content of the dashboard is displayed in one or more dashboard pages. Dashboard pages are identified by tabs across the top of the dashboard. A toolbar at the top right contains buttons that let you:
Edit the dashboard, if you have the appropriate permissions and privileges
Display various options for working with a Dashboard Page, such as printing the current page
An analysis is a query against an organization's data that provides answers to business questions. A query contains the underlying SQL statements that are issued to the Oracle BI Server.
Analysis let you explore and interact with information by visually presenting data in tables, graphs, pivot tables, and so on. You can save, organize, and share the results of analyses.
Analysis that you create can be saved in the Oracle BI Presentation Catalog and integrated into any OBIEE dashboard. Analyses can be enhanced through features such as graphs, result layout, calculated items, and drilling.
Agents enable you to automate your business processes. You can use them to provide event-driven alerting, scheduled content publishing, and conditional event-driven action execution.
You can choose:
A schedule that the Agent runs on
A data condition that determines what the Agent does
An analysis that can be distributed
Actions that can be automatically executed depending on whether the data condition is met
Agents can dynamically detect information-based problems and opportunities, determine the appropriate individuals to notify, and deliver information to them through a wide range of devices such as e-mail, phones, etc.
This section explains how to perform the following common tasks in Oracle BI:
Note:
Do not close the browser window to sign out of OBIEE.To sign out of OBIEE:
In the global header, click Sign Out.
Oracle Business Intelligence includes OPVA-specific online help for both dashboards and reports.
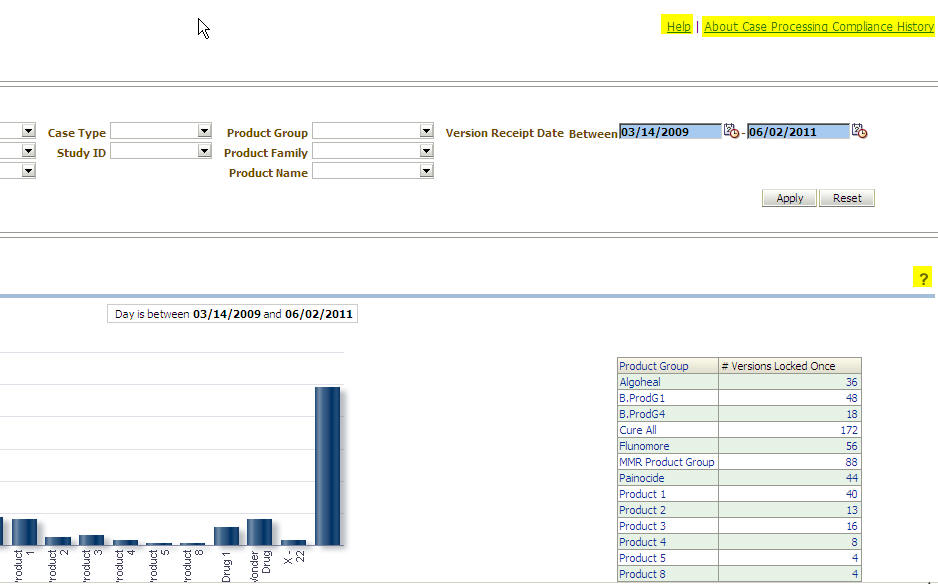
The following image provides a sample view of the Help links (highlighted in yellow) that exist on each page.
Table 2-1 Accessing Online Help
| Name of Help Link | Clicking on this link... |
|---|---|
|
Help |
Opens the entire Help system, in an online book format. |
|
<Name of Dashboard/Page-specific Help> |
Re-directs to the description about the specific <Dashboard/Page>. |
|
? |
Pops up the description about the specific report. |
Online help opens in a new browser window. You can scroll down the help page or use hyperlinks to navigate to other topics.
This section explains basic navigation within Oracle BI.
After signing in to OBIEE, you are presented with one of the following pages, depending on what has been configured for you:
Your personal dashboard, named My Dashboard
A Home page
A dashboard that is specific to your job function
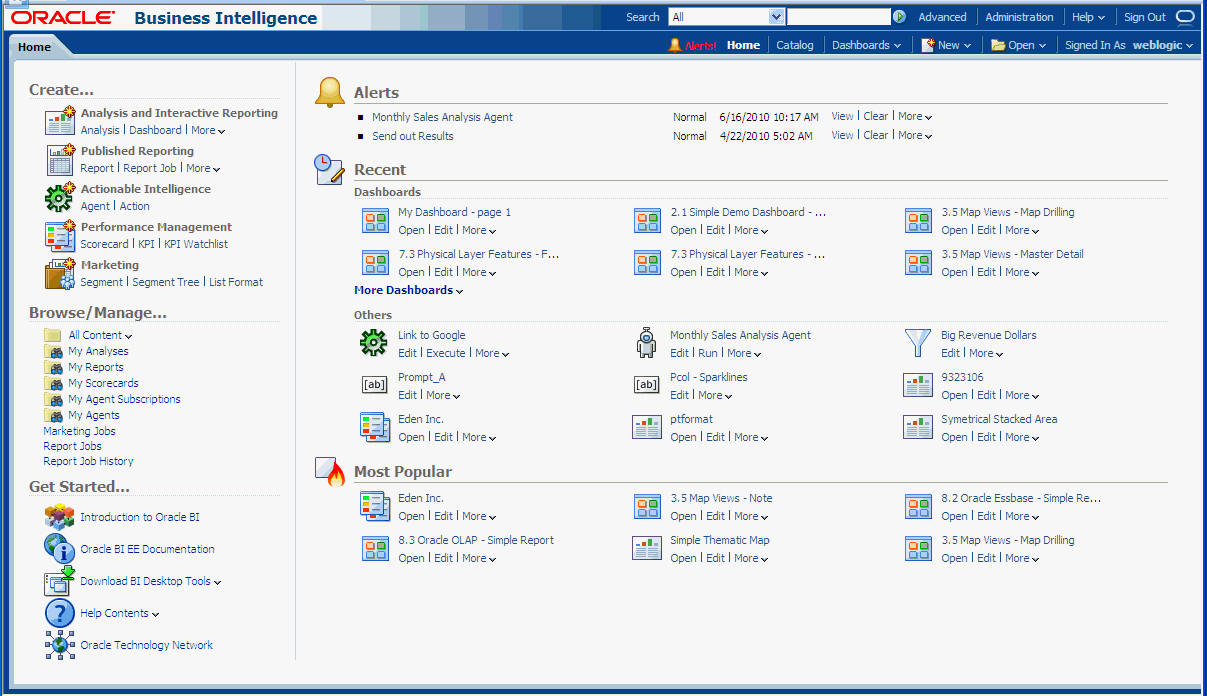
This page is your starting point for working in OBIEE. As you work, you can use the global header and the Home page as the primary ways to navigate OBIEE.
The Global Header:
The global header is displayed at the top of the OBIEE interface and is always available as you work. It enables you to easily access the functionality that OBIEE provides. For example, you can access the Home page, access dashboards, open objects (such as analyses and dashboard prompts), Create new objects, and so on.
The Home Page
From the Home page, you can learn how to get started with OBIEE, create and modify objects, and browse and manage objects in the catalog. After you have accessed the starting point of a task, the interface then presents you with the page, dialog, or editor that you use to perform the task.
The Home page provides a starting point for performing tasks in OBIEE. The Home page is divided into sections that allow you to quickly begin a specific task, locate an object, or access technical documentation. It also includes sections that allow you to quickly access objects that you have recently viewed, created, or updated, and objects that are accessed the most often by the users assigned to the groups to which you belong.
Depending on what has been configured as your starting page, you might be presented with the Home page when you sign in to OBIEE.
Alternatively, you can always navigate to the Home page by clicking the Home page link in the global header.
The global header provides quick access to commonly used functions and is always available from the user interface.
For example, you can use the global header to begin a new task, search the Oracle BI Presentation Catalog, access the product documentation, or view a different object, without having to return to the Home page. The global header also includes the Home page link so that you can quickly access the Home page from other pages.
The Global Header includes the following components:
Search - Enables you to search the catalog.
Advanced - Displays the "Catalog page" in search mode, where you can search for objects in the catalog. In search mode, the "Search pane" is displayed rather than the "Folders pane" within the page.
Administration - Available only if you are logged in as an administrator. Displays the Administration page, where you can perform administration tasks such as managing privileges and metadata for maps.
Help - Displays the following options:
xxx Help - (where xxx is the name of the page, editor, or tab) - Dynamically changes to display the Help topic for the current page, editor, or tab.
Help Contents - Displays a cascading menu that provides options that link to the tables of contents for OBIEE, BI Publisher, and Marketing.
Documentation - Displays the documentation library for OBIEE.
OTN - Displays the Business Intelligence and Data Warehousing Technology Center page on the Oracle Technology Network (OTN).
About OBIEE - Displays a dialog identifying the OBIEE version and copyright information.
Sign Out - Signs you out of OBIEE.
Alerts - Available only if one or more alerts have been generated for you. Displays the Alerts dialog, where you can manage your alerts. An alert is a notification that is generated by an agent that delivers personalized and actionable content to specified recipients and to subscribers to the agent.
Home - Displays the Home page.
Catalog - Displays the Catalog page, where you can locate objects in the catalog and perform tasks specific to those objects.
Dashboards - Contains links to all dashboards that are stored within the Dashboards sub-folder of the user's folder or any shared folder (note that dashboards not saved to the Dashboards sub-folders are not displayed from the global header's Dashboard list).
New - Displays a list of the objects that you can create. To create an object, select it from the list. The appropriate dialog or editor is displayed for you to create the object.
Open - Displays the following options:
Open - Displays the Open dialog, where you can select the object with which you want to work.
Recent Objects - Displays a list of the objects that you have recently viewed, created, or updated. You can use this list to select an object with which you want to work.
Most Popular Objects - Displays a list of the objects that are accessed the most often by the users that are assigned to the groups to which you belong. You can use this list to select an object with which you want to work.
Signed In As username - (where username is the user name that your current session is using) Displays the following options:
My Account - Displays the My Account dialog, where you can specify your preferences, such as time zone, delivery devices, and delivery profile.
Act As - Available only if your organization has enabled this functionality and you have been granted the appropriate permissions. Enables you to act as another user.
You and end-users can set personal preferences for OBIEE. By using the My Account dialog (depending on your privileges), you can:
View general account information, such as your display name and user ID
View and modify your preferences, such as language, time zone, and currency
View and modify your preferences for BI Publisher, such as location and time zone
View and modify your delivery options for agents
View the roles and groups to which you belong
Execute the following steps to set preferences:
In the global header, click Signed In As <username> and select My Account. The My Account dialog is displayed.
Complete the appropriate settings.
Click OK to save your changes.
Oracle BI provides options for exporting results into different formats. This is done using the Export link available in each report and dashboard. The different export options are listed as follows:
Adobe PDF
Microsoft Excel 2003+
Microsoft Powerpoint (Powerpoint 2003, Powerpoint 2007+)
WebArchive (mht)
Data (CSV Format, Tab delimited format, and XML)
The following steps assume that you are already on a result page:
Exporting into a PDF
The result can be exported in PDF format with the following steps:
Click Export.
Select the PDF option.
The File Download dialog opens. Click Open or Save in the File Download dialog.
Based on the user action, the result would either open in PDF format (if Adobe Reader is available in the machine) or will proceed with the Save.
Exporting to Microsoft Excel 2003+
The result can be stored in Excel format with the following steps:
Click Export.
Select the Excel 2003+ option.
The File Download dialog opens. Click Open or Save in the File Download dialog.
Based on the user action, the result would either open as an Excel sheet (if Microsoft Excel is available in the machine) or will proceed with the Save.
Exporting to Microsoft Powerpoint
The result can be stored in Powerpoint slides with this option. This option also has two sub-options: Powerpoint 2003 and Powerpoint 2007+.
Execute the following steps:
Click Export.
Select the Powerpoint option.
Select from one of the secondary options: Powerpoint 2003 or Powerpoint 2007+.
The File Download dialog opens. Click Open or Save in the File Download dialog.
Based on the user action, the result would either open in Powerpoint (if Microsoft Powerpoint is available in the machine) or will proceed with the Save.
Exporting to Web Archive (mht)
Execute the following steps:
Click Export.
Select the WebArchive (mht) option.
The File Download dialog opens. Click Open or Save in the File Download dialog.
Based on the user action, the result would either open as an MHT file or will proceed with the Save.
Exporting the results in Data Format
The results can be exported in CSV format, tab delimited format, and XML format.
Execute the following steps:
Click Export.
Select the Data option.
Select the CSV sub-option.
The File Download dialog opens. Click Open or Save in the File Download dialog.
Based on the user action, the result would either open as a CSV formatted file with the application for which CSV format is configured or will proceed with the Save.
This section explains about briefing books and steps to add contents to briefing books.
A briefing book is a collection of static or updatable snapshots of dashboard pages, individual analyses, and BI Publisher reports. If your organization is licensed for Oracle BI Briefing Books, you can work with briefing books. A briefing book allows you to perform the following tasks:
Add the content of dashboard pages (including pages that contain BI Publisher reports) or individual analyses to new or existing briefing books.
Edit briefing books to reorder content, delete content, and change the content type, navigation link properties, and content description.
Download briefing books in PDF or MHTML format for printing and viewing.
Add a list of briefing books to a dashboard page.
Update, schedule, and deliver briefing books using agents, if your organization is licensed to Oracle Business Intelligence Delivers.
Execute the following steps to add content to a briefing book:
Navigate to the page to add or to the page that contains the analysis to be added.
Perform one of the following actions:
To add the contents of the dashboard page to a briefing book, click the Page Options toolbar button on the Dashboard page and select Add To Briefing Book.
To add the results of an individual analysis to a briefing book, locate the analysis on the dashboard and click the Add to Briefing Book link.
The Save Briefing Book Content dialog is displayed.
Click Browse to display the Save As dialog.
In the Save As dialog:
To save the contents to a new briefing book, specify the location in which to save the briefing book in the Save In field. Enter a name for the briefing book in the Name field. You can also enter a description in the Description field (optional), and click OK.
To save the contents to an existing briefing book, select the briefing book and click OK.
In the Save Briefing Book Content dialog, complete the remaining fields as appropriate.
Click OK.
The content is now added to the briefing book.
For more information about the briefing book, please refer to the OBIEE Administration and User Guide or Help files.
This section explains about sorting values in columns.
You can use one of the following mechanisms to sort values in columns:
Right-click in the column header of pivot tables and tables to display the following list of options for sorting the columns. In the Selected Columns pane, click the Options button. You can also right-click to display the Right-Click Menu for Tables and Pivot Tables, where you can select options for sorting.
Sort Ascending - Sorts the values in the column by ascending order, as a first-level sort. For example, string values sort alphabetically A through Z, numbers sort lowest to highest, and dates sort earliest to latest. In the Selected Columns pane, when you select this option as the first sort, a Sort button is displayed to the left of the column name in the Selected Columns pane. If you later add another sort, then the Sort button includes the number 1.
Sort Descending - Sorts the values in the column by descending order, as a first-level sort. In the Selected Columns pane, when you select this option as the first sort, a Sort button is displayed to the left of the column name in the Selected Columns pane. If you later add another sort, then the Sort button includes the number 1.
Add Ascending Sort - Specifies that an ascending sort for this column is added as another sort for the analysis. In the Selected Columns pane, when you select this option, a Sort button with a number such as 2 or 3 is displayed to the left of the column name in the Selected Columns pane.
Add Descending Sort - Specifies that an descending sort for this column is added as another sort for the analysis. In the Selected Columns pane, when you select this option, a Sort button with a number such as 2 or 3 is displayed to the left of the column name in the Selected Columns pane.
Clear Sort - Removes the sort specification for the specified column. This option works differently in the Selected Columns pane than in other places. If you make sort specifications in both the Selected Columns pane and in the view itself, then you return to the Selected Columns pane and click Clear Sort, only the sort that you specified in the Selected Columns pane is removed. A sort that you specified in the view remains.
Clear Sorts in All Columns or Clear All Sorts in View - Removes all sort specifications that you have made. The Clear Sorts in All Columns option works differently in the Selected Columns pane than in other places. If you make sort specifications in both the Selected Columns pane and in the view itself, then you return to the Selected Columns pane and click Clear Sorts for All Columns, only the sorts that you specified in the Selected Columns pane are removed. Sorts that you specified in the view remain.
Hover the mouse pointer over the area to the right of the column name in the header of a pivot table or table and click either the upward facing triangle (Sort Ascending) or the downward facing triangle (Sort Descending) for that column. These sort specifications override those that you make with the right-click menu. Hovering is not available in the Selected Columns pane.
If you see a shaded-in sort button in the column header or the row header, then you know that the column contains a primary sort. You can add a second-level or third-level sort by hovering over another innermost column header or row header and clicking the appropriate sort button.
These options are also available in the Results tab: Data View editor, the Results tab: Table editor, and in views on dashboards. The Sort Ascending and Sort Descending triangles are not available in the Selected Columns pane or the Layout pane.
Many of the results that are displayed in views represent hierarchical data structures. The metadata specifies these hierarchies, and this enables you to access the different levels of detail within them. For example, information in a sales graph might be categorized by region. Clicking a specific region in the graph might display each country within that region, if the country is the next level within the hierarchy of the metadata. Such clicking is referred to as drilling.
If the content designer has set up views for drilling, then you can drill in them on dashboards.
Drilling is a way to navigate through data in views quickly and easily.
You drill down to display data in more detail, which displays more members.
You can drill down to an actual item in the database. For example, if you work in sales, you can drill down to the city level within a sales analysis, and observe that there is a large sale pending in Paris.
You drill up to display data in less detail, in hierarchical columns.
For example, you might drill up from a month value to see a summary for the whole year. You can drill up in the current hierarchy, either for the entire column at the header level or for individual members. You can drill up from District to Region. Drilling up hides the current level (such as District) and retains the higher level (such as Region).
You can drill in the following types of views:
Table and Pivot Table
Graphs
Maps
Drilling in Tables and Pivot Tables
When you drill down in a table or a pivot table, the detail level data is added to the current data. For example, when you drill from a continent, the table displays data for the continent and for the countries in that continent. For an attribute column, the list of members in the header is expanded, and it includes the original member.
The way that you drill in tables and pivot tables depends on the column type, as described in the following sections:
To drill in an attribute column, click the heading or member in which you want to drill. When you hover over the value before clicking, an underline is displayed below the value to indicate that you can click to drill.
When you drill in an attribute column, you add the lower level to the view. All views are affected by drilling in an attribute column, which is equivalent to a filter drill. After you click the value, a column is added to the analysis and a filter is automatically created and listed in the Criteria tab.
You cannot drill on groups for attribute columns. To see the definition of a group for an attribute column, edit the corresponding step in the Selection Steps pane.
To drill in a hierarchical column, click the Expand and Collapse icons beside the members. Click to expand or collapse one level. For example, expanding from Total Products to Products inserts the Product members while retaining the value for Total Products.
When you drill in a hierarchical column, you expand and collapse the nodes of data that are in the view. Drilling in a hierarchical column affects only that particular view. No other views are affected.
Drilling in level-based hierarchies and value-based hierarchies works the same. Each time you drill in a hierarchy, you expand or collapse one level. For example, if the hierarchy has a level for continents, regions, and cities, and the view shows continent data, you can expand from Australia down one level to display regions in Australia. From there, you can expand one level from a region, to cities in that region, or you can collapse one level, back to continents.
When you drill, the drill state is preserved. If you collapse at a higher level and re-expand, then the members are re-displayed at the same drill point.
When you click the Collapse icon, you collapse back to the current level any levels in the hierarchy that are present in the analysis, regardless of whether they were added by drilling down or by adding the levels from the Subject Areas pane.
You can perform asymmetric drilling, which enables you to drill various members to different levels. For example, if you expand World, then you might see Americas, Asia, and Australia at the same second-level for continents. You can then drill Americas to expand it and see its regions, while Asia and Australia are not expanded.
You can expand and collapse the members of a group for hierarchical columns. For example, if you have a group that includes cities and the group is included in a view, then you see the cities when you click the group name.
When you drill down in a graph, the detail level data replaces the current data. For example, when you drill down from a continent, the graph displays data for the countries in that continent, but not for the continent itself.
You can drill down in the following ways:
You can click a label (for which drilling is available) on any axis or in the legend to drill down. A change in the mouse pointer indicates that drilling is available.
If the graph contains only attribute columns and measure columns, then you can click a data point to drill all columns.
If the graph contains multiple columns including at least one hierarchical column, then when you click a label or a data point, you see a menu from which you can select which columns to drill down. If there are action links available, then the menu also displays those links.
You do not drill up in a graph. Click the Back button on the browser to return to a previous graph.
Note:
The time series line graph does not support drill down on a time column where data types other than data or date-time are used.You can display printer-friendly versions of existing dashboards and requests. A printer-friendly version does not contain any extraneous links or other hypertext items.
You can print using HTML or Adobe PDF (Portable Document Format). Adobe PDF is the only print option available for Oracle BI Publisher reports. Adobe Reader 6.0 or greater is required to print using Adobe PDF.
Note:
The HTML method of printing relies on the print handling capabilities of your browser. If you do not get the results you want, choose PDF to open, and then print the dashboard or request.To print a dashboard or a request:
Navigate to an existing dashboard or request.
To print a request, click the Print link, and then choose HTML or PDF.
To print a dashboard page, click the following icon at the bottom of the dashboard, and choose HTML or PDF: ![]()
For HTML, a new window shows the selected item without the extraneous links. Choose File > Print on the browser menu.
For PDF, use the options available in the Adobe PDF window to save or print the file.
You can email a dashboard page or a request as an attachment. The format you use depends on your browser, such as Web Archive, Single File (.mht) in Internet Explorer or Mozilla Archive Format (.maf) in Mozilla and Firefox.
Note:
The Mozilla Archive Format capability is available as a separately downloaded plug-in.In any browser, you can also save a dashboard page or request as a collection of HTML files. You can then zip and email the corresponding directory of associated files.
To email a dashboard page or request:
Navigate to the dashboard page or request that you want to send.
To email a request, click the Print link, and then choose HTML or PDF. To email a dashboard page, locate and click the Print icon at the bottom of the dashboard, and then choose HTML or PDF.
A new browser window opens that contains the dashboard page or the request.
From the browser's toolbar, choose File > Save As.
Save the file to the desired location, with the appropriate file type for your browser.
Send the saved attachment using an email application.
Note:
The saved attachments can also be used as a means to archive and restore requests as they exist at a particular point in time.
|
Copyright © 2011, Oracle and/or its affiliates. All rights reserved. Legal Notices |
|