| Oracle® Enterprise Data Quality for Product Data Services for Excel Reference Guide Release 11g R1 (11.1.1.6) Part Number E29143-03 |
|
|
PDF · Mobi · ePub |
| Oracle® Enterprise Data Quality for Product Data Services for Excel Reference Guide Release 11g R1 (11.1.1.6) Part Number E29143-03 |
|
|
PDF · Mobi · ePub |
This chapter describes the following:
With the Services for Excel metadata file load functionality, you can merge data records from similar Excel workbooks into a single workbook. This can be very helpful in creating single file sources for processing by a DSA rather than processing the data in each file individually.
You can merge multiple source metadata Excel files into a single target Excel file of the same type. The file consolidation functionality makes the merging of distinct data files straightforward and easy.
Before beginning, you should do the following:
Ensure that all the source files that you want to consolidate are located in a single folder.
Create a single target file that you want to merge the source files into.
Ensure that you create worksheets in the target Excel workbook that exactly match the source worksheet names. The Excel workbooks are merged by using the target worksheet names. All source worksheets that match a target worksheet name are merged. All source worksheets that do not match a target worksheet name are ignored.
Open the target workbook.
To consolidate files, click the DataLens Tools button on the Services for Excel toolbar, and then select Load Meta-Data Files….
By default, the system appends the records it finds in all of the source files to the Excel target file.
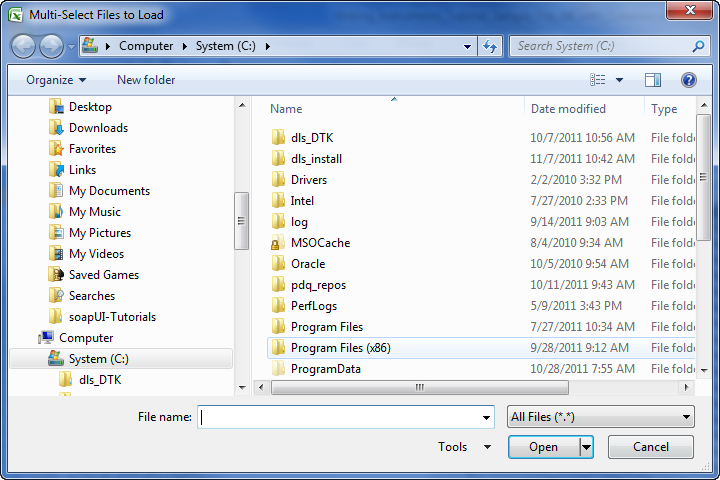
You are prompted to locate and select the source files that you want consolidated. Use the Shift or Ctrl+A to select multiple files continuously or discontinuously respectively, and then click Open.
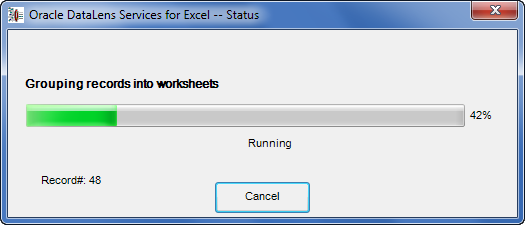
A progress dialog displays the overall progress.
This section describes how you can change or group your data.
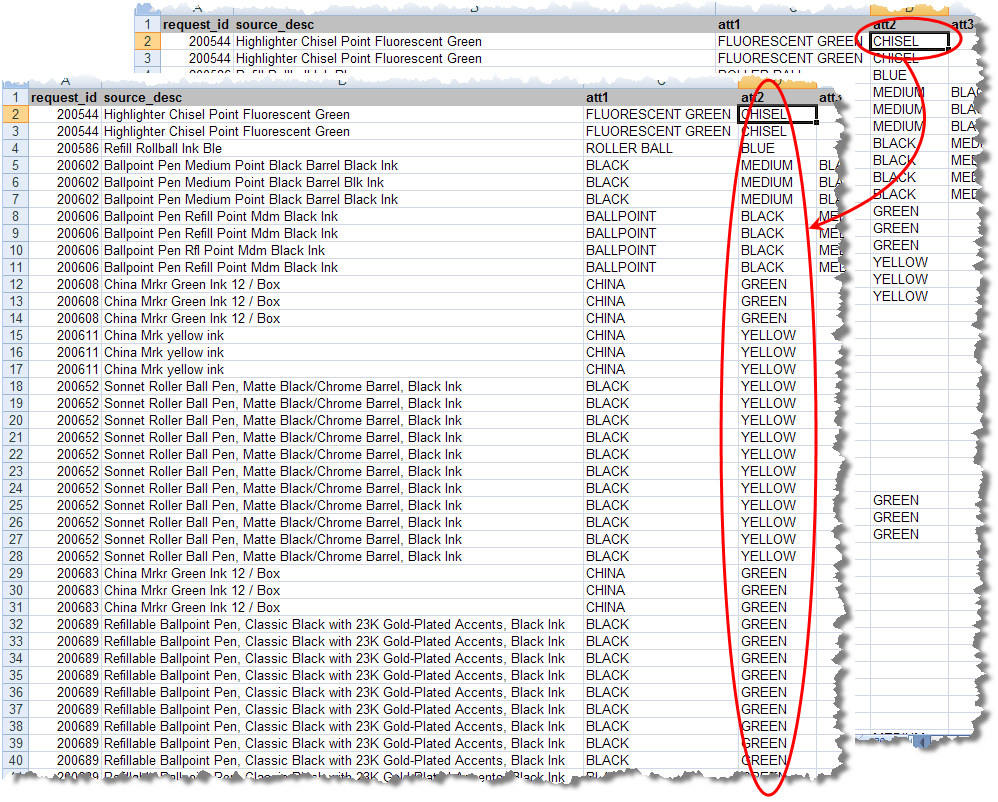
The record grouping functionality allows you to group all of the records in the active worksheet into a set of separate worksheets based on the values found in one of the input columns. This enables closer analysis of your data in a more granular fashion.
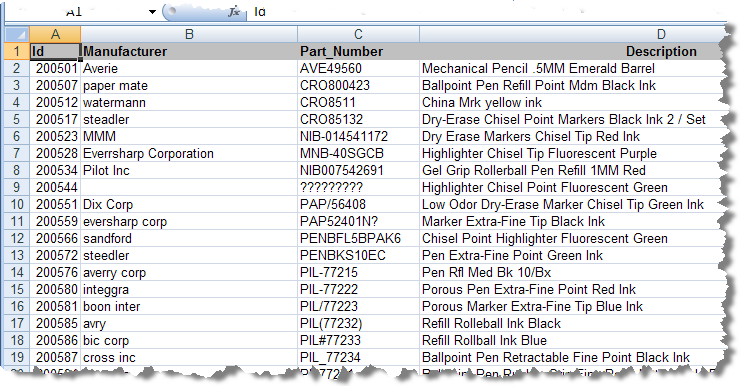
For example, the following data could be grouped by manufacturer.
To group records, right-click on any cell then select DataLens Services, and then select Group Records into Worksheets.
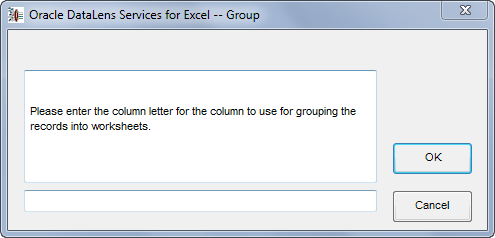
Enter the column you want to use as filter for grouping the records; it is case insensitive. Click OK to continue.
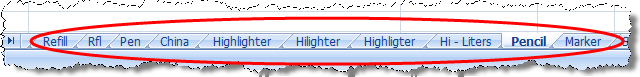
Your records are sorted into new worksheets that are created and named by the groups found in the selected column and stored in a new workbook.
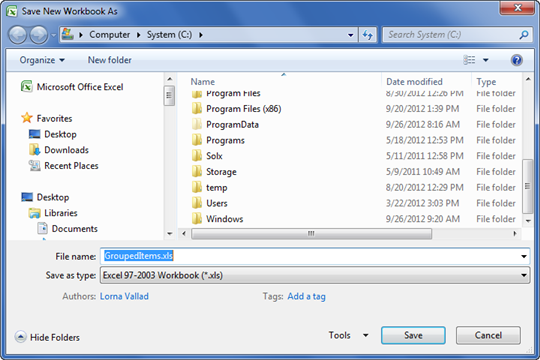
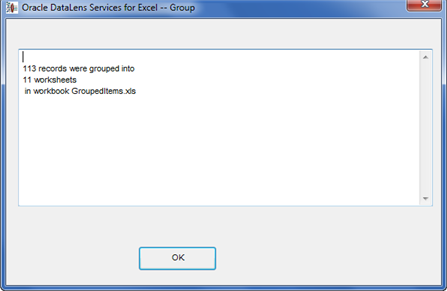
You can use the default file name or enter your own, change the directory, and then click Save to complete the process. A confirmation message describing the number of records grouped, the number of tabs created, and the a name of the saved file.
The new workbook containing a worksheet for each group of data will be similar to the following:
In addition to adding unique data (as described in Creating the Unique Identifier Column on page 27), you can add data to your source columns. This is particularly useful in adding data to your attribute category columns, which must contain data. The data is completed from the selected cell downward so it is most useful when you select the first cell in the column.
To fill in (complete) the data in a column, select a cell to serve as the starting point. Right-click on the selected cell, select DataLens Services, and then select Fill in Columns.
As in the preceding example, the attribute category column was completed by selecting the first cell in the column then using the fill in function. It operates in much the same way as this similar functionality in Excel as it completes the cells with data based on the data in other cells.
When your data records contain control characters, hexadecimal values, or HTML tags, it is advantageous to remove these characters to ensure proper data processing. These characters can be misinterpreted by Excel so removing them is important.
You can use Services for Excel to examine your data records to ascertain whether there are any control characters or Unicode spaces.
To do this, select the data records that you want to analyze and right-click then select DataLens Services, select Character Analysis and Replacement, and then select Analyze Character Set.
The selected cells are immediately examined and a report is provided upon completion.
Note:
If you select the entire worksheet, the Services for Excel context sensitive menu is not active.To replace control characters, select the data records that you want to analyze and right-click then select DataLens Services, select Character Analysis and Replacement, and then select Replace Control Characters.
The selected cells are immediately examined, any control characters that are found are replaced with spaces, and a report is provided upon completion.
To search for hex values so that you can modify your source data appropriately, select the data records that you want to analyze and right-click then select DataLens Services, select Character Analysis and Replacement, and then select Report Character Hex Values.
You should review Hex Values in situations where the characters are not visible because there is not an equivalent ASCII character, such as double byte languages or control characters.
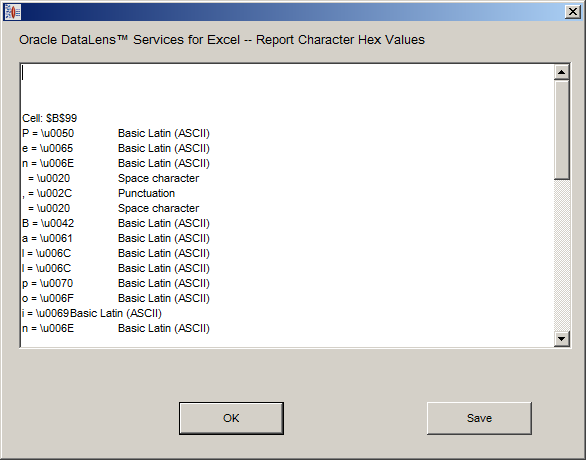
The selected cells are immediately examined; any hex values found are reported. You can save the report to a folder so that you can use it to correct these hex values. The saved report is similar to the following:
Cell: $B$3R = \u0052 Basic Latin (ASCII)E = \u0045 Basic Latin (ASCII)S = \u0053 Basic Latin (ASCII)P = \u0050 Basic Latin (ASCII)C = \u0043 Basic Latin (ASCII)F = \u0046 Basic Latin (ASCII) = \u0020 Space characterA = \u0041 Basic Latin (ASCII)X = \u0058 Basic Latin (ASCII)3 = \u0033 Basic Latin (ASCII)0 = \u0030 Basic Latin (ASCII)0 = \u0030 Basic Latin (ASCII)O = \u004F Basic Latin (ASCII)H = \u0048 Basic Latin (ASCII)M = \u004D Basic Latin (ASCII)1 = \u0031 Basic Latin (ASCII)/ = \u002F Punctuation
The cell containing the hex values is identified as are each of the hex values.
When your data contains HTML tags, you must remove all tags to enable successful data processing. The tags and their contents including Java scripts, meta data, escape characters, etc. must be stripped from your data.
To remove all embedded HTML tags and control characters, select the data records cells that may contain HTML tags. Right-click the selected cells then select DataLens Services, select Character Analysis and Replacement, and then select Strip Embedded HTML Tags from selected cells.
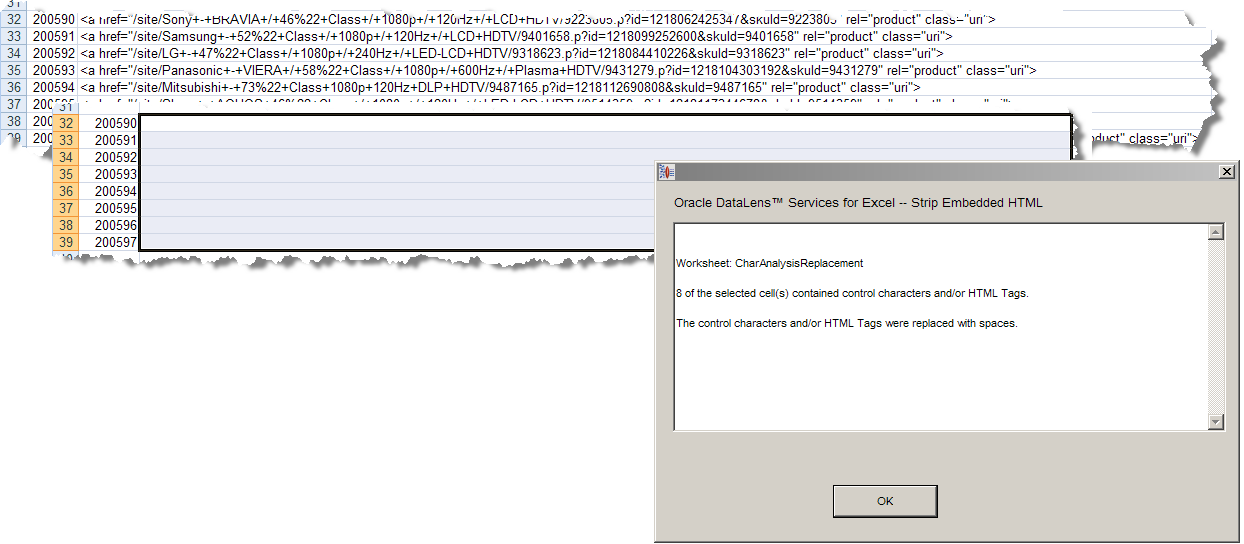
The selected cells are parsed for HTML tags, which are removed if found. An informational message is displayed that details how many of the cells contained data that was replaced with spaces.
The purpose of regression testing is to ensure that formerly acceptable results have not unexpectedly changed based on recent changes to a datalens or DSA. This important step should be performed after changes have been made to the source data.
A regression set is tied to the source data worksheet from which it is created. A good regression base is typically large, usually composed of more than a thousand records. You should recreate your regression set each time you change your data lens or DSA to ensure that recent data lens or DSA changes are apparent.
The first step to regression testing is to create the regression set of data. You can create a regression set of the source data or any result worksheet. To do this, from the Services for Excel toolbar, click Test, and then select Create Regression Set.
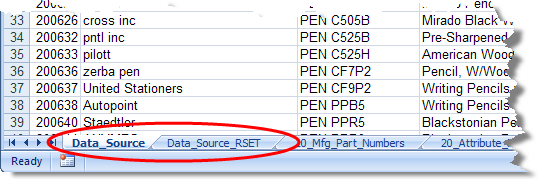
The regression set is automatically created and stored in a new worksheet named the same as the source data worksheet with the _RSET suffix.
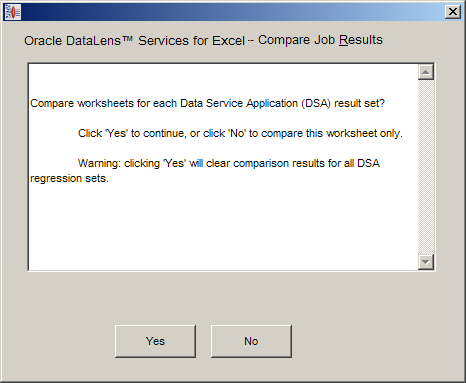
You use this same process to update an existing regression set and when an existing regression record set is detected, the following query appears:
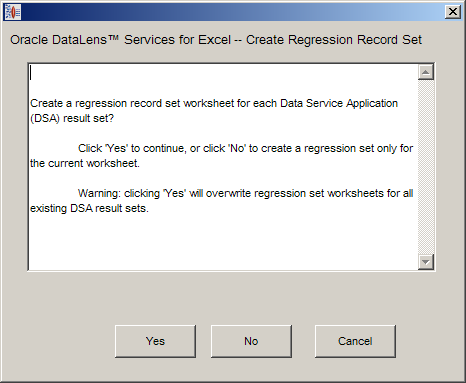
You can overwrite (or create) the existing regression record sets for the active worksheet and all result worksheets by selecting Yes; selecting No only overwrites the regression set for the active worksheet. Use the Cancel button to exit without changing any worksheets.
The data comparison functions in the following sections can be used to compare your source data against your regression data.
All regression set worksheets can be removed at one time so that you can create a new set. To do this, from the Services for Excel toolbar, click Test, and then select Remove All Regression Sets.
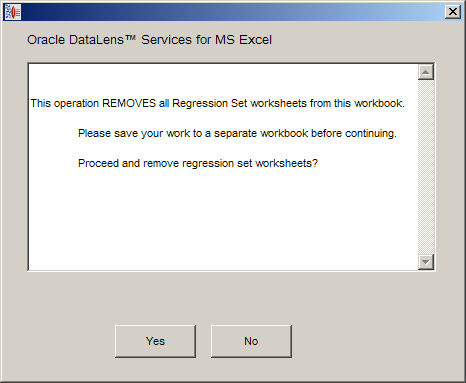
A confirmation query is displayed and when you click Yes, all regression worksheets are removed from your workbook.
Once you have reviewed and approved a set of cells in a result worksheet, you can update the corresponding regression worksheet so that you can track your work. This allows you to see your data testing progression, particularly in large regression sets.
To do this, select the cells of data that you want to copy. Right-click in the selection then select DataLens Services, and select Copy Cells to Regression Set.
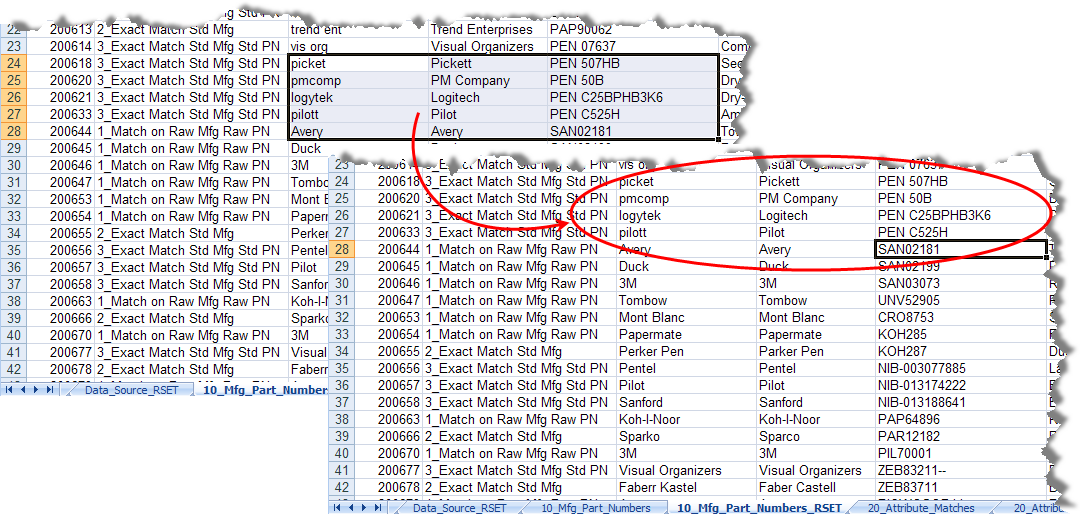
The selected cells, or records, are copied to the same location in the regression set worksheet as in the preceding example.
Additionally, you can select one of the highlighted result cells and Services for Excel can locate similar or 'like' cells of data to your regression set. To do this, select one cell of data and right-click then select DataLens Services, and select Copy Like Cells to Regression Set.
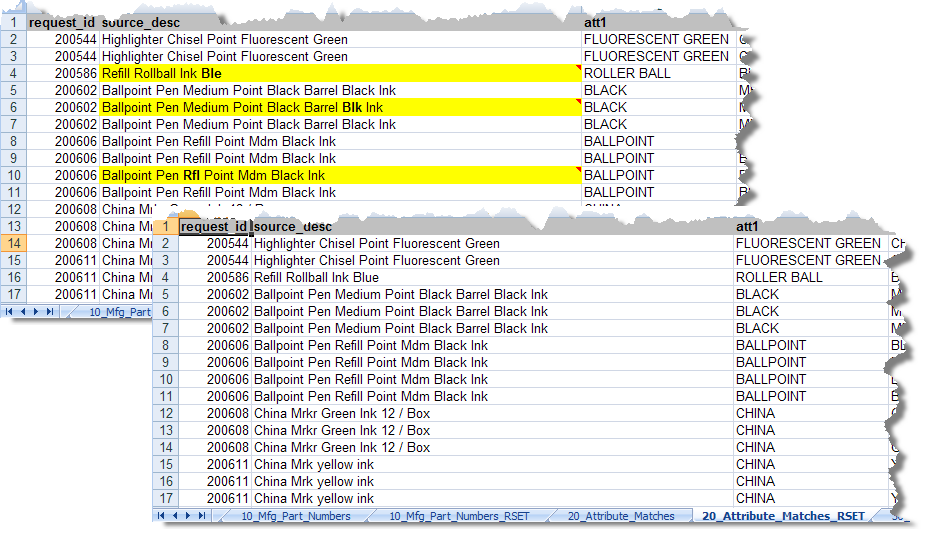
You can compare a selection of records to quickly isolate data of interest and avoid comparing all the records in the regression set. To do this, select the rows of interest on a source data or result worksheet then right-click, select DataLens Services, and then select Compare Selected Records.
The records are compared and any differences are highlighted in yellow as in the following example, which selected the records 2 through 10:
To clear the comparison highlighting, select the rows you want to return to normal then select DataLens Services, and then select Clear Comparisons for Selected Cells. The colorization is removed from the selected cells as in the following example:
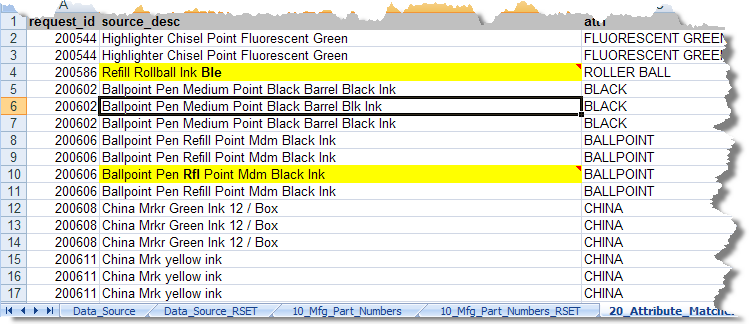
The cell in row six was selected and so the highlighting was removed.
You can compare the processed data on all result worksheets or just one. In an active results worksheet, from the Services for Excel toolbar, click Test, and then select Compare Job Results.
Select Yes to compare all result worksheets and clear any previous comparison results or select No to compare the active worksheet only.
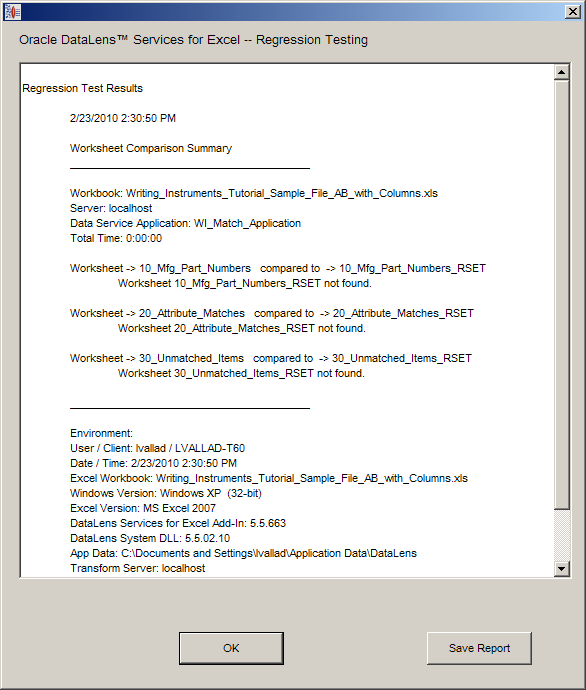
The report lists all differences found between the result worksheet and its regression worksheet divided by each sheet. Use the Save Report button to save the information to a text file for later review or printing.
It can be advantageous to create a sampling of your data records to test or debug your DSA, or visually inspect your processed data. By identifying a subset of data records, you can save processing time. The data samples are created with a random set of records. You can use these sampling methods:
The key record set is created with at least 20 randomly selected records, though not more than 1% of the total number of records, taken from the active worksheet. You can use a key record set worksheet to test the basic functionality of the selected DSA and associated data lenses. When the data source contains less than 20 records, all records are used.
To create a key sample, select the worksheet that for which you want a key data sample. Click the Test button, select Sampling, and then select Create Key Record Sample.
The data sample is automatically created and is stored in a sheet that has the same name as the active worksheet with _KSET appended to the end. For example, if the active worksheet name were Source_Data then the key sample worksheet created would be named Source_Data_KSET.
The baseline record set is created with at least 1000 randomly selected records, though not more than 8% of the total number of records, taken from the active worksheet. It is used to test your data rather than the data transformation process. When the data source contains less than 1000 records, all records are used.
To create a key sample, select the worksheet that you want a key data sample of. Click the Test button, select Sampling, and then select Create
The data sample is automatically created and is stored in a sheet that has the same name as the active worksheet with _KSET appended to the end. For example, if the active worksheet name were Source_Data then the key sample worksheet created would be named Source_Data_KSET.
When you have created a data sampling worksheet, you can then set up a DSA job to process the data so that you can review it more easily.
If you attempt to create another sampling of the same data, you are prompted to choose whether you want to overwrite your existing sample.
You can use a standard worksheet deletion in Excel to remove any data sampling worksheets that you create.
You can create a backup of your source data worksheet to ensure that you do not lose any of your work. This backup worksheet created and updated automatically when you select the Backup Worksheet option when setting up your DSA processing job. For more information about setting this option, see "Advanced Options Section".
Note:
This backup worksheet is a hidden worksheet to avoid accidental deletion.The following functions, found on the Jobs menu, are used in conjunction with the backup worksheet:
Restores the source data worksheet using the latest backup worksheet. Since a restore potentially overwrites the active worksheet, if there is an associated hidden backup worksheet, you are prompted to proceed with overwriting the data.
Removes the backup worksheet, regression worksheet, and all other hidden worksheets created by the Services for Excel application. This is useful if you no longer want to use the workbook and are archiving the contents or if you want to share the workbook with others without providing all of the processing information.
The purpose of the AutoBuild application is to extract implicit and explicit taxonomy information from existing product information and then use that extracted information to create a data lens specific to your enterprise content. The application relies upon product information contained in Excel spreadsheets and is available with the Services for Excel.
With AutoBuild, you can leverage existing Excel worksheet product information and Enterprise DQ for Product Smart Glossaries to create initial data lenses specific to your business requirements. You can then enhance the knowledge captured in your data lenses by using the full suite of Enterprise DQ for Product applications to recognize, standardize, classify, and translate your data as well as for further transformation in accordance with comprehensive business processes that you define.
To start AutoBuild, click the DataLens Tools button, and then select AutoBuild... or click the AutoBuild button on the toolbar.
Note:
The following message may be displayed:No data lenses were found. Please make sure the Knowledge Studio is installed and check out the Smart Glossaries.
This means that Services for Excel is installed though the EDQP Client Software is not installed. For installation instructions, see "Installing and Configuring Services for Excel".
For details on using the AutoBuild application, see Oracle Enterprise Data Quality for Product Data AutoBuild Reference Guide.
|
Copyright © 2001, 2013, Oracle and/or its affiliates. All rights reserved. Legal Notices |
|