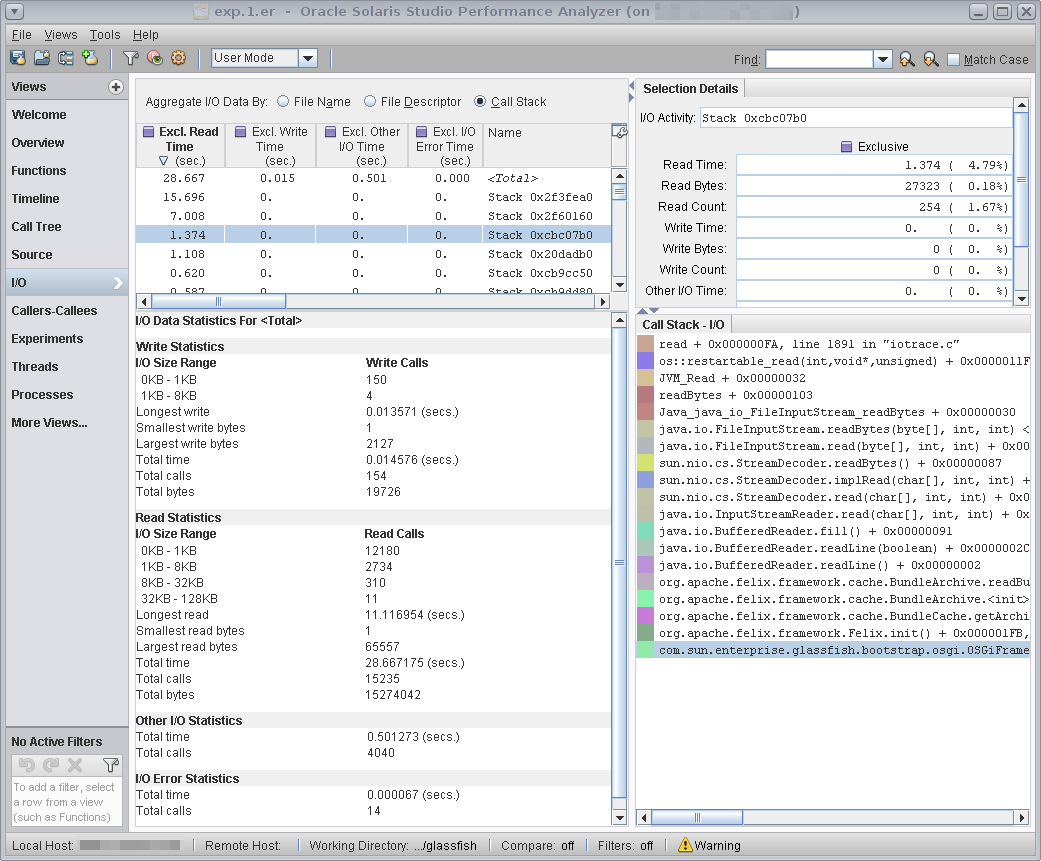
New I/O Data View
A new I/O view can help you identify the I/O patterns in your application and pinpoint the I/O bottlenecks that impact its performance. The I/O view is available if you profiled your application for I/O tracing data from Performance Analyzer, or using collect -i on command.
I/O view shows read and write data aggregated by file name, file descriptor, or call stack. You can also use it to filter I/O events from your data. A new Duration view is available for analyzing the time duration of I/O operations. A new Data Size view is available that shows the distribution of I/O operations by byte size. See the Help in the Performance Analyzer for more information about the I/O view.
Figure 3-10 I/O Data View
