Timeline Improvements
The Timeline view has the following enhancements to make it easier to examine your data.
-
Click and then drag the mouse to set markers that define a precise time period for zooming and filtering.
-
Zoom to show the maximum number processes and threads using the new toolbar control for vertical zoom.
-
Zoom in using Shift-drag with the mouse.
See the Timeline section of the Keyboard Shortcuts and Mnemonics in the Help menu for more information about navigation in the timeline.
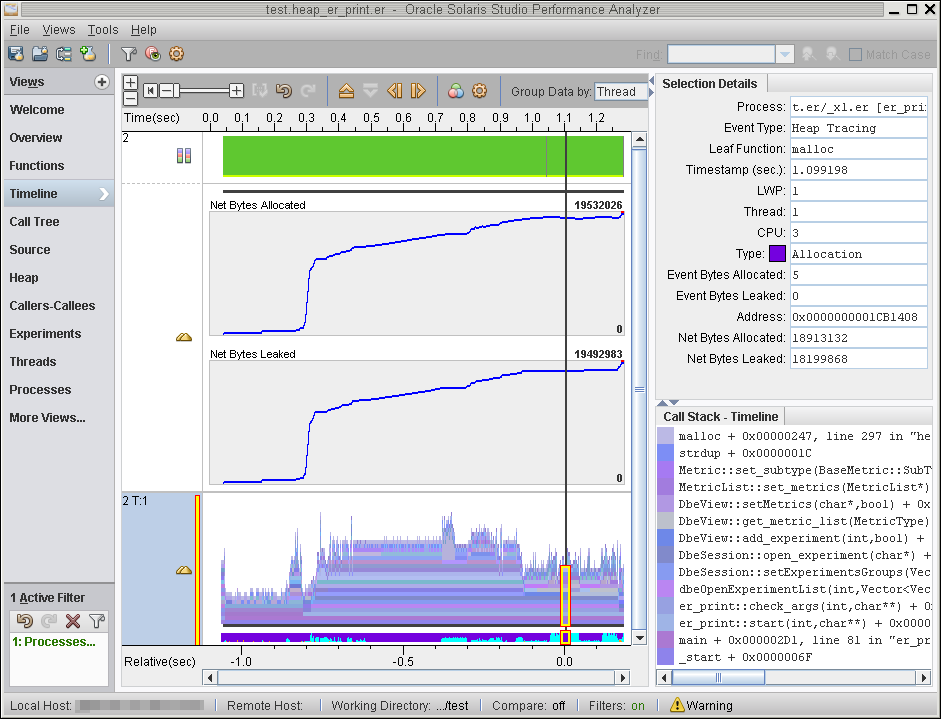
The following figure shows a Timeline view of heap tracing data. The timeline shows graphs of heap allocations and leaks, as well as the callstacks for the allocations and frees. The right side shows details about the current selection's memory allocation and callstack.
Figure 3-4 Timeline View

See Oracle Solaris Studio 12.4: Performance Analyzer Tutorials for step-by-step instructions for using the Timeline on sample experiments.