Using the Performance Analyzer to Examine the lowfruit Data
This section shows how to explore the data in the experiment created from the lowfruit sample code.
-
If the experiment you created in the previous section is not already open, you can start Performance Analyzer from the lowfruit directory and load the experiment as follows:
% analyzer test.1.er
When the experiment opens, Performance Analyzer shows the Overview screen.
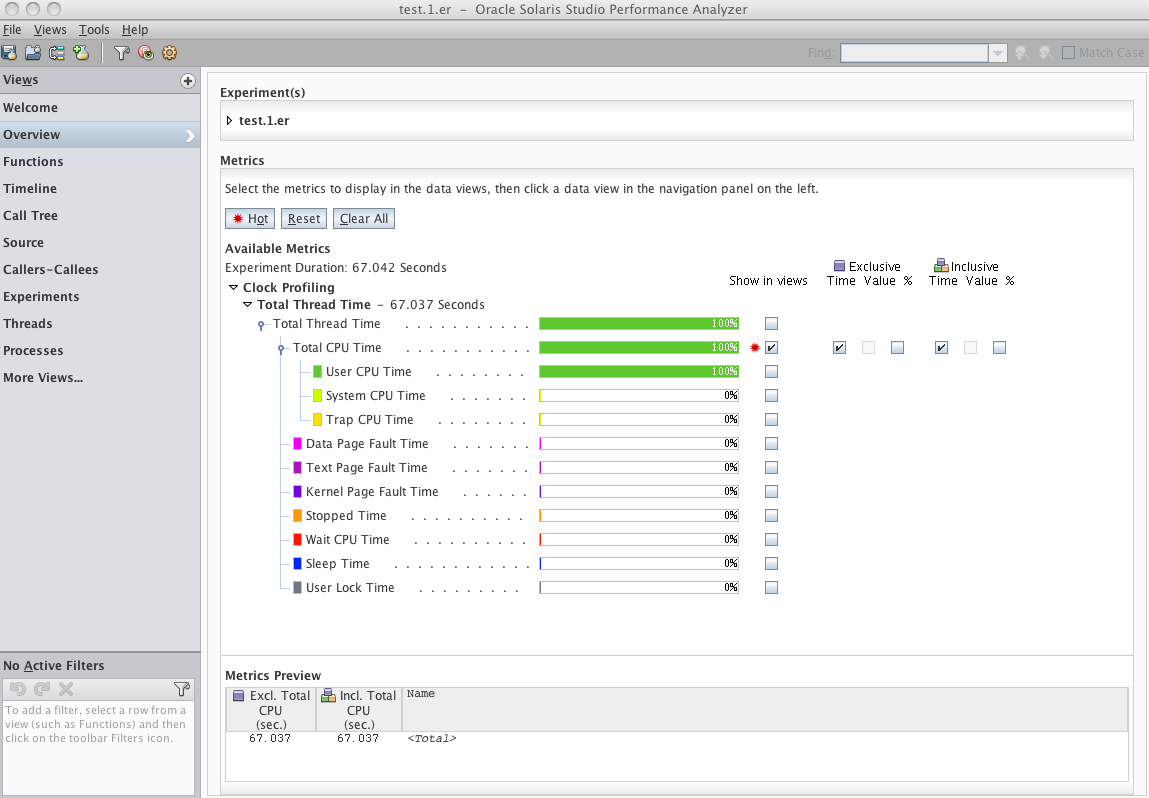
In this experiment the Overview shows essentially 100% User CPU time. The program is single-threaded and that one thread is CPU-bound. The experiment was recorded on a Oracle Solaris system, and the Overview shows twelve metrics recorded but only Total CPU Time is enabled by default.
The metrics with colored indicators are the times spent in the ten microstates defined by Oracle Solaris. These metrics include User CPU Time, System CPU Time, and Trap CPU Time which together are equal to Total CPU Time, as well as various wait times. Total Thread Time is the sum over all of the microstates.
On a Linux machine, only Total CPU Time is recorded because Linux does not support microstate accounting.
By default, both Inclusive and Exclusive Total CPU Time are selected. Inclusive for any metric refers to the metric value in that function or method, including metrics accumulated in all the functions or methods that it calls. Exclusive refers only to the metric accumulated within that function or method.
-
Click on the Functions view in the Views navigation bar on the left side, or select it using Views > Functions from the menu bar.
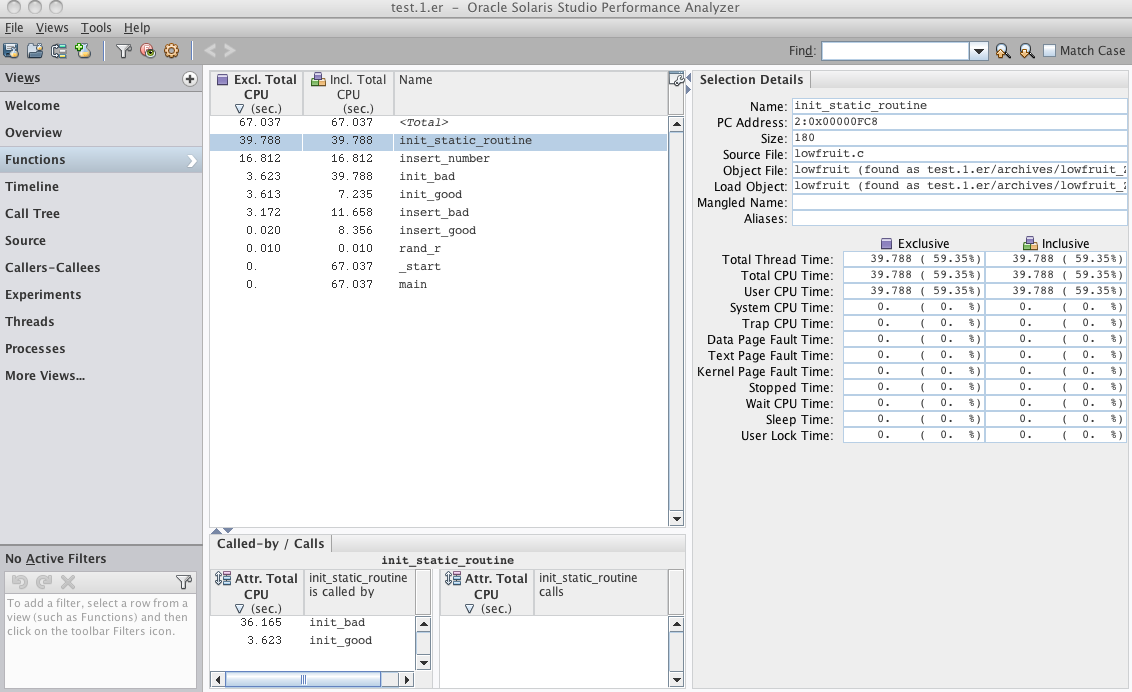
The Functions view shows the list of functions in the application, with performance metrics for each function. The list is initially sorted by the Exclusive Total CPU Time spent in each function. The list includes all functions from the target application and any shared objects the program uses. The top-most function, the most expensive one, is selected by default.
The Selection Details window on the right shows all the recorded metrics for the selected function.
The Called-by/Calls panel below the functions list provides more information about the selected function and is split into two lists. The Called-by list shows the callers of the selected function and the metric values show the attribution of the total metric for the function to its callers. The Calls list shows the callees of the selected function and shows how the Inclusive metric of its callees contributed to the total metric of the selected function. If you double-click a function in either list in the Called-by/Calls panel, the function becomes the selected function in the main Functions view.
-
Experiment with selecting the various functions to see how the windows in the Functions view update with the changing selection.
The Selection Details window shows you that most of the functions come from the lowfruit executable as indicated in the Load Object field.
You can also experiment with clicking on the column headers to change the sort from Exclusive Total CPU Time to Inclusive Total CPU Time, or by Name.
-
In the Functions view compare the two versions of the initialization task, init_bad() and init_good().
You can see that the two functions have roughly the same Exclusive Total CPU Time but very different Inclusive times. The init_bad() function is slower due to time it spends in a callee. Both functions call the same callee, but they spend very different amounts of time in that routine. You can see why by examining the source of the two routines.
-
Select the function init_good() and then click the Source view or choose Views > Source from the menu bar.
-
Adjust the window to allow more space for the code: Collapse the Called-by/Calls panel by clicking the down arrow in the upper margin, and collapse the Selection Details panel by clicking the right-arrow in the side margin.
You should scroll up a little to see the source for both init_bad() and init_good(). The Source view should look similar to the following screen shot.
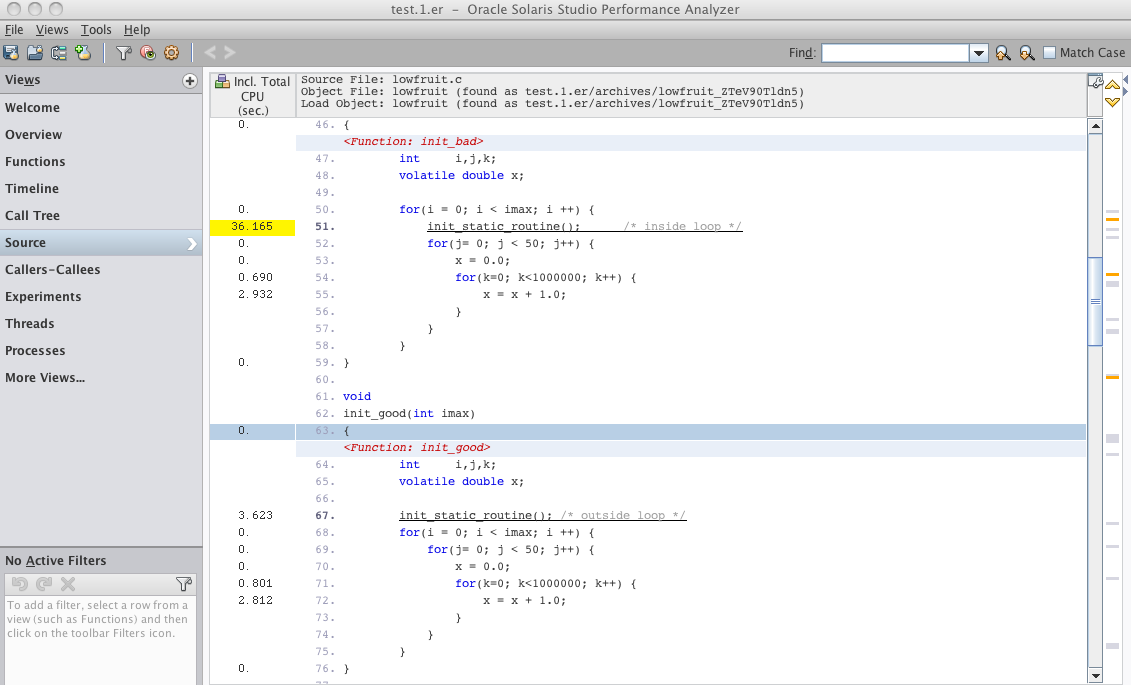
Notice that the call to init_static_routine() is outside of the loop in init_good(), while init_bad() has the call to init_static_routine() inside the loop. The bad version takes about ten times longer (corresponding to the loop count) than in the good version.
This example is not as silly as it might appear. It is based on a real code that produces a table with an icon for each table row. While it is easy to see that the initialization should not be inside the loop in this example, in the real code the initialization was embedded in a library routine and was not obvious.
The toolkit that was used to implement that code had two library calls (APIs) available. The first API added an icon to a table row, and second API added a vector of icons to the entire table. While it is easier to code using the first API, each time an icon was added, the toolkit recomputed the height of all rows in order to set the correct value for the whole table. When the code used the alternative API to add all icons at once, the recomputation of height was done only once.
-
Now go back to the Functions view and look at the two versions of the insert task, insert_bad() and insert_good().
Note that the Exclusive Total CPU time is significant for insert_bad(), but negligible for insert_good(). The difference between Inclusive and Exclusive time for each version, representing the time in the function insert_number() called to insert each entry into the list, is the same. You can see why by examining the source.
-
Select insert_bad() and switch to the Source view:
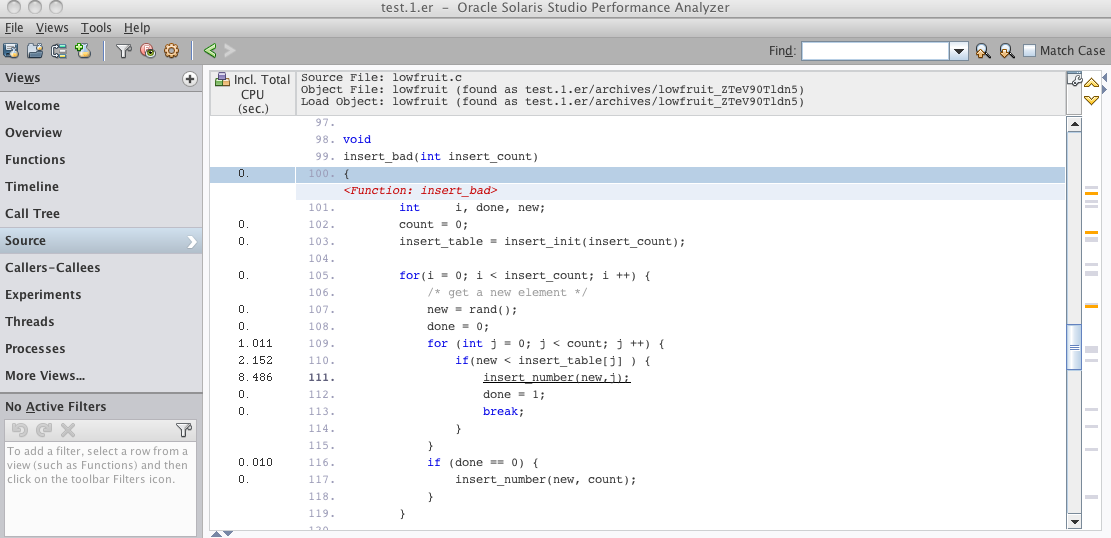
Notice that the time, excluding the call to insert_number(), is spent in a loop looking with a linear search for the right place to insert the new number.
-
Now scroll down to look at insert_good().
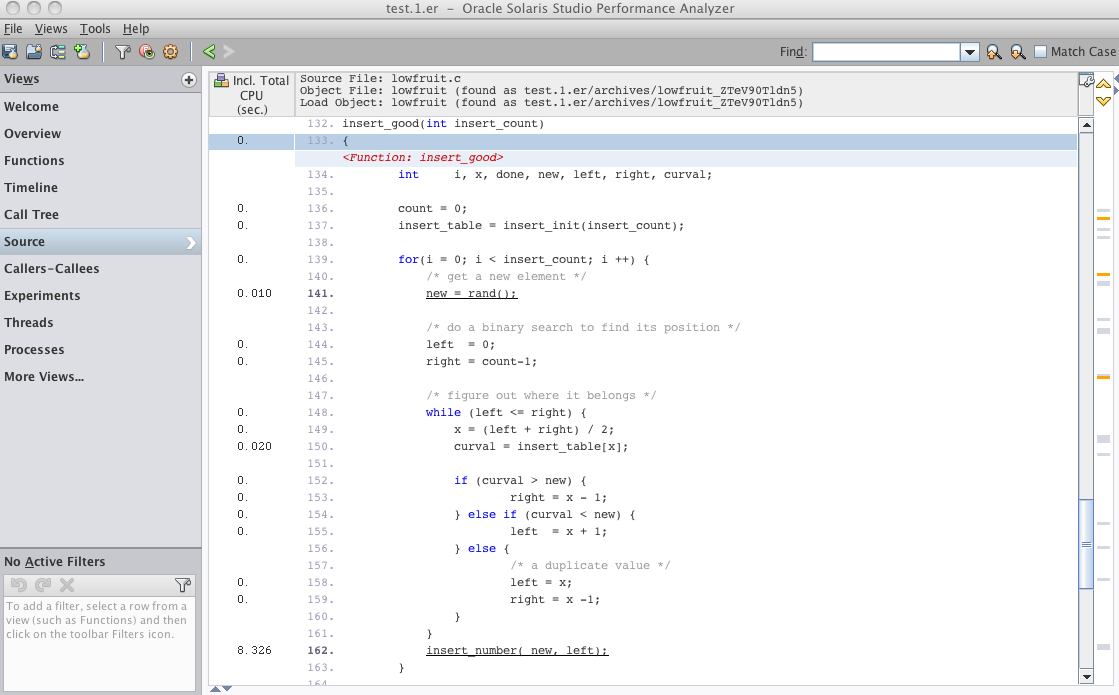
Note that the code is more complicated because it is doing a binary search to find the right place to insert, but the total time spent, excluding the call to insert_number(), is much less than in insert_bad(). This example illustrates that binary search can be more efficient than linear search.
You can also see the differences in the routines graphically in the Timeline view.
-
Click on the Timeline view or choose Views > Timeline from the menu bar.
The profiling data is recorded as a series of events, one for every tick of the profiling clock for every thread. The Timeline view shows each individual event with the callstack recorded in that event. The callstack is shown as a list of the frames in the callstack, with the leaf PC (the instruction next to execute at the instant of the event) at the top, and the call site calling it next, and so forth. For the main thread of the program, the top of the callstack is always _start.
-
In the Timeline tool bar, click the Call Stack Function Colors icon for coloring functions or choose Tools > Function Colors from the menu bar and see the dialog box as shown below.
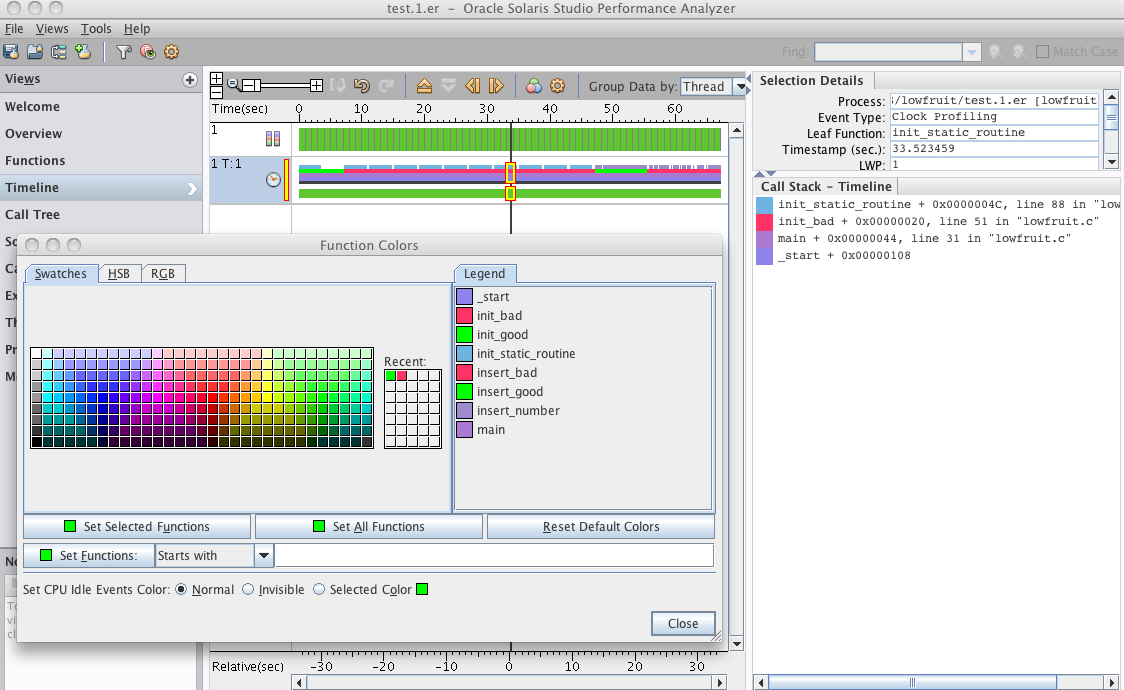
The function colors were changed to distinguish the good and bad versions of the functions more clearly for the screen shot. The init_bad() and insert_bad() functions are both now red and the init_good() and insert_good() are both bright green.
-
To make your Timeline view look similar, do the following in the Function Colors dialog box:
-
Scroll down the list of java methods in the Legend to find the init_bad() method.
-
Select the init_bad() method, click on a red color square in Swatches, and click Set Selected Functions button.
-
Select the insert_bad() method, click on a red color square in Swatches, and click Set Selected Functions button.
-
Select the init_good() method, click on a green color square in Swatches, and click Set Selected Functions button.
-
Select the insert_good() method, click on a green color square in Swatches, and click Set Selected Functions button.
-
-
Look at the top bar of the Timeline.
The top bar of the Timeline is the CPU Utilization Samples bar as you can see in the tool tip if you move your mouse cursor over the first column. Each segment of the CPU Utilization Samples bar represents a one-second interval showing the resource usage of the target during that second of execution.
In this example, all the segments are green because all the intervals were spent accumulating User CPU Time. The Selection Details window shows the mapping of colors to microstate although it is not visible in the screenshot.
-
Look at the second bar of the Timeline.
The second bar is the Clock Profiling Call Stacks bar, labeled "1 T:1" which means Process 1 and Thread 1, the only thread in the example. The Clock Profiling Call Stacks bar shows two bars of data for events occurring during program execution. The upper bar shows color-coded representations of the callstack and the lower bar shows the state of the thread at each event. The state in this example was always User CPU Time so it appears to be a solid green line.
If you click anywhere within that Clock Profiling Call Stacks bar you select the nearest event and the details for that event are shown in the Selection Details window. From the pattern of the call stacks, you can see that the time in the init_good() and insert_good() routines shown in bright green in the screenshot is considerably shorter than the corresponding time in the init_bad() and insert_bad() routines shown in red.
-
Select events in the regions corresponding to the good and bad routines in the timeline and look at the call stacks in the Call Stack - Timeline window below the Selection Details window.
You can select any frame in the Call Stack window, and then select the Source view on the Views navigation bar, and go to the source for that source line. You can also double-click a frame in a call stack to go to the Source view or right-click the frame in the call stack and select from a popup menu.
-
Zoom in on the events by using the slider at the top of the Timeline, or using the + key, or by double-clicking with the mouse.
If you zoom in enough you can see that the data shown is not continuous but consists of discrete events, one for each profile tick, which is about 10 ms in this example.
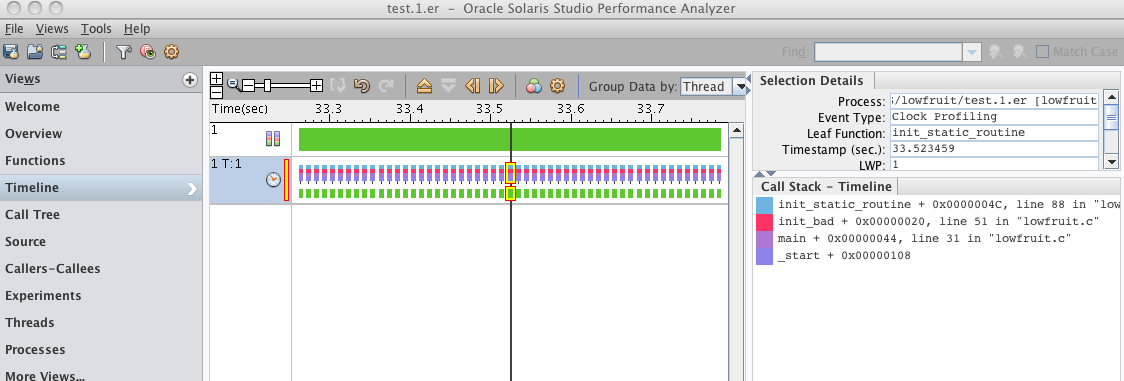
Press the F1 key to see the Help for more information about the Timeline view.
-
Click on the Call Tree view or choose Views > Call Tree to see the structure of your program.
The Call Tree view shows a dynamic call graph of the program, annotated with performance information.
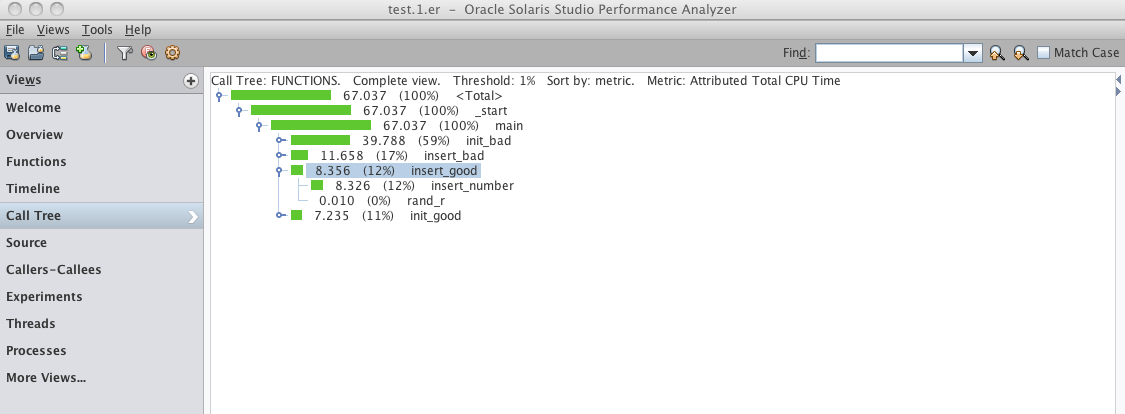
Performance Analyzer has many additional views of the data, such as the Caller-Callees view which enables you to navigate through the program structure, and the Experiments view which shows you details of the recorded experiment. For this simple example the Threads and Processes views are not very interesting.
By clicking on the + button on the Views list you can add other views to the navigation bar. If you are an assembly-language programmer, you might want to look at the Disassembly. Try exploring the other views.
Performance Analyzer also has a very powerful filtering capability. You can filter by time, thread, function, source line, instruction, call stack-fragment, and any combination of them. The use of filtering is outside the scope of this tutorial, since the sample code is so simple that filtering is not needed.