Understanding the Java Garbage Collector Behavior
This procedure shows you how to use the Timeline view and the affect of the view mode setting on the Timeline, while examining the activities that trigger Java garbage collection.
-
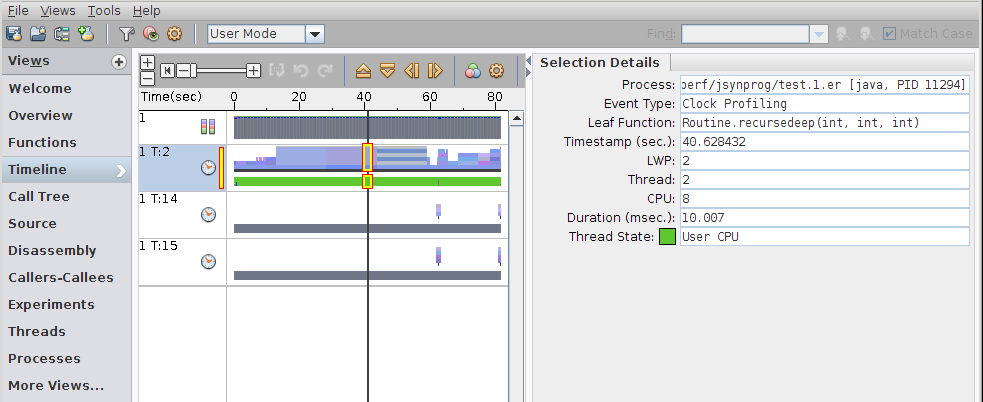
Set the view mode to User Mode and select the Timeline view in the navigation panel to reveal the execution detail of this hybrid Java/native application, jsynprog.

You should see the CPU Utilization Samples bar at the top and profile data for three threads. In the screenshot you can see data for Process 1, Threads 2, 14, 15. The numbering and the number of threads you see might depend on the OS, the system, and the version of Java you are using.
Only the first thread, Thread 2 labeled as T:2 in the example, shows its microstate as User CPU. The other two threads spend all their time waiting for a User Lock, part of the JVM synchronization.
-
Set the view mode to Expert Mode.
The Timeline view should now show more threads although the user thread T:2 appears almost unchanged.
-
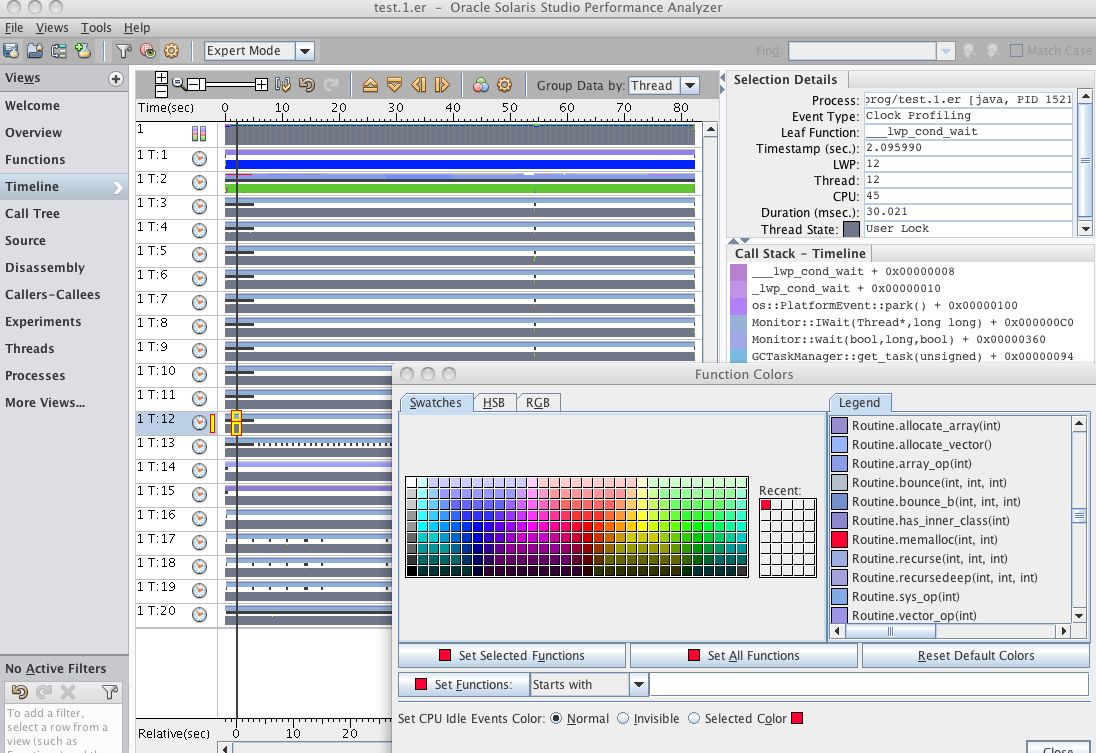
Use the vertical zoom control at the top of the timeline to adjust the zoom so that you can see all the threads.
The vertical zoom control is highlighted in red in the following screenshot. Click the minus button to reduce the height of the thread rows until you can see all twenty threads.

-
Click the Call Stack Function Colors button in the Timeline tool bar to set the color of the function Routine.memalloc() to red.
In the Function Colors dialog, select the Routine.memalloc() function in the Legend, click a red box in Swatches and click Set Selected Functions.

Note that Thread 2 now has a bar of red across the top of its stack. That area represents the portion of time where the Routine.memalloc() routine was running.
You might need to zoom out vertically to see more frames of the callstack, and zoom in horizontally to the region of time that is of interest.
-
Use the horizontal slider in the Timeline tool bar to zoom in close enough to see individual events in thread T:2.
You can also zoom by double-clicking or pressing the + key on your keyboard.

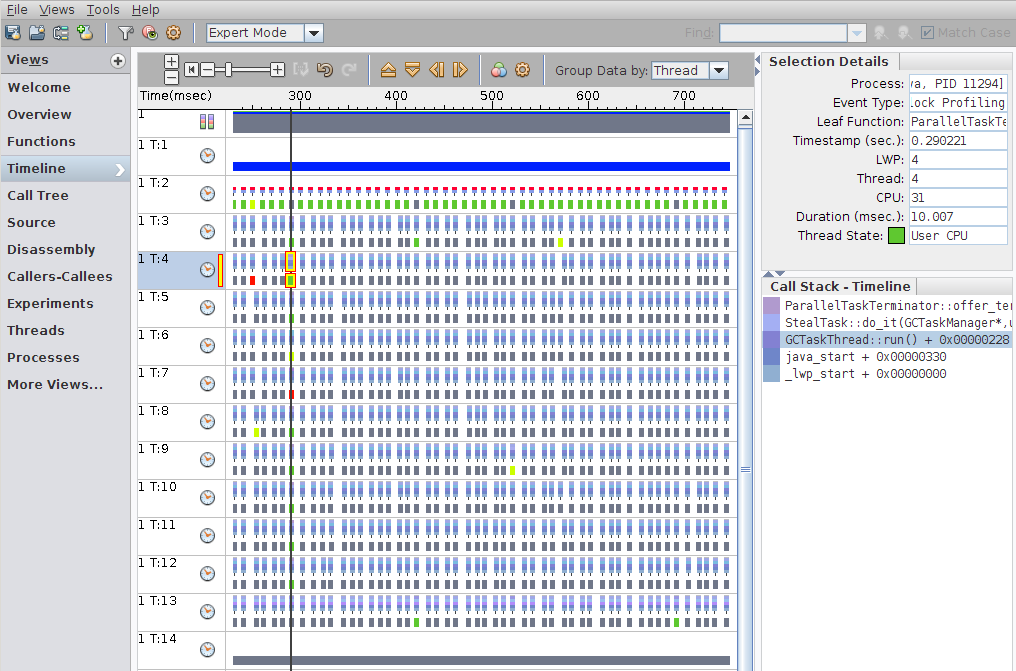
Each row of the timeline actually includes three data bars. The top bar is a representation of the callstack for that event. The middle bar shows black tick marks wherever events occur too closely together to show them all. In other words, when you see a tick mark, you know that there are multiple events in that space.
The lower bar is an indicator of the event state. For T:2 the lower bar is green, which indicates User CPU Time was being used. For threads 3 through 12 the lower bar is gray, which indicates User Lock Time.
Notice however that all of those threads 3 through 12 have many events clustered together arriving at the same time as the user thread T:2 is in Routine.memalloc, the routine shown in red.
-
Zoom in to the Routine.memalloc region and filter to include only that region by doing the following:
-
Click on the T:2 bar close to the beginning of the Routine.memalloc region with the red function call on top.
-
Click and drag the mouse to close to the end of that region where the red at the top of the call stack ends.
-
Right-click and select Zoom > To Selected Time Range.
-
With the range still selected, right-click and select Add Filter: Include only events from selected time range.
After zooming you can see that there are some event states in threads 3-12 that are green to indicate User CPU time, and even a few that are red to indicate Wait CPU Time.
-
-
Click on any of the events on threads 3-12 and you see in the Call Stack panel that each thread's events include GCTaskThread::run() in the stack.
Those threads represent the threads that the JVM uses to run garbage collection. While they do not take a great amount of User CPU Time, the GC threads do run while the user thread is in Routine.memalloc, but not otherwise.

-
Go back to the Functions view and click on the Incl. Total CPU column header to sort by inclusive Total CPU Time.
You should see that one of the top functions is the GCTaskThread::run() function. This leads you to the conclusion that the user task Routine.memalloc is somehow triggering garbage collection.
-
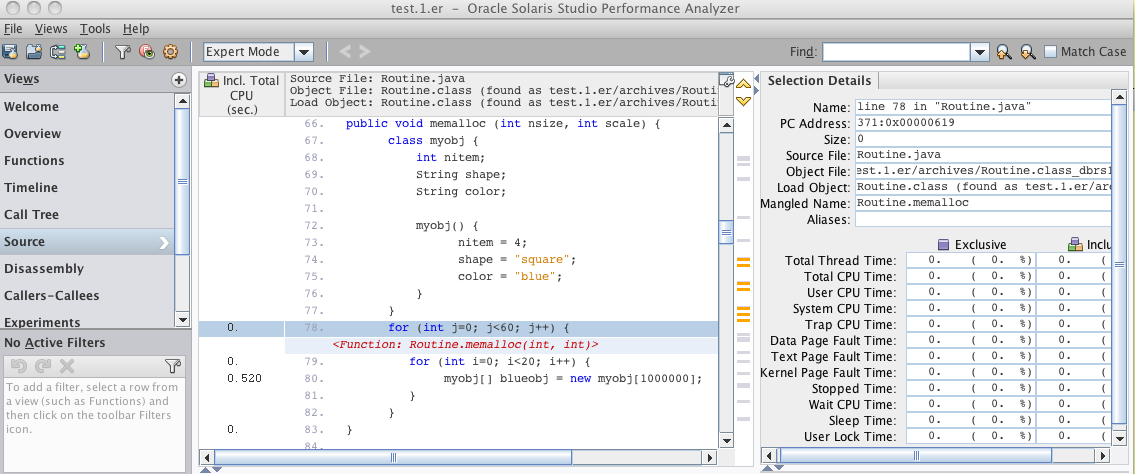
Select the Routine.memalloc function and switch to the Source view.

From this fragment of source code it is easy to see why garbage collection is being triggered. The code allocates an array of one million objects and stores the pointers to those objects in the same place with each pass through the loop. This renders the old objects unused, and thus they become garbage.
Continue to the next section.