Collecting and Displaying Dynamic Memory Usage Data
Regardless of whether you have collected static data, you can compile, instrument, and run your application to collect dynamic memory access data. For a list of the dynamic memory access errors found by instrumenting your application with discover and then running it, see Dynamic Memory Access Issues.
-
In your sample directory, build the sample application with the –g option.
This option generates debug information that enables Code Analyzer to display source code and line number information for errors and warnings.
-
On Oracle Solaris:
$ cc -g main.c previse*.c sample1.c sample2.c sample3.c
-
On Oracle Linux:
$ cc -xannotate -g main.c previse*.c sample1.c sample2.c sample3.c
Note - You are not compiling sample4.c for this portion of the tutorial. -
-
Save a copy of the binary to use when you collect coverage data because you cannot instrument a binary that is already instrumented.
$ cp a.out a.out.save
-
Instrument the binary with discover.
$ discover -a a.out
-
Run the instrumented binary to collect the dynamic memory access data.
$ ./a.out
The dynamic memory access error data is written to the sample/a.out.analyze/dynamic directory.
-
Start the Code Analyzer GUI to view the results.
$ code-analyzer a.out &
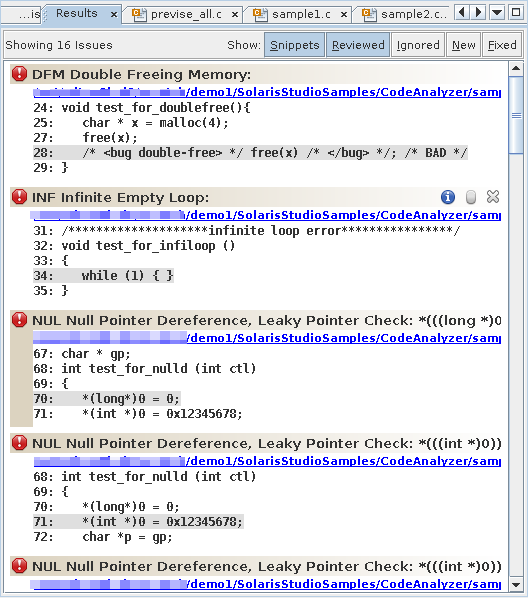
The Results tab shows both static issues and dynamic memory issues. The background color behind an issue description indicates whether it is a static code issue (tan) or a dynamic memory access issue (pale green).
-
To filter the results and show just the dynamic memory issues, select the Dynamic option in the Issues tab.
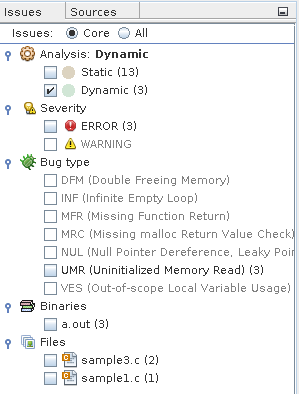
The Results tab now shows just the three core dynamic memory issues.
Note - Core issues are issues that, when fixed, are likely to eliminate the other issues. A core issue usually combines several of the issues listed in the All view because, for example, those issues have a common allocation point or occur at the same data address in the same function. -
To see all of the dynamic memory issues, select the All radio button at the top of the Issues tab. The Results tab now displays six dynamic memory issues.
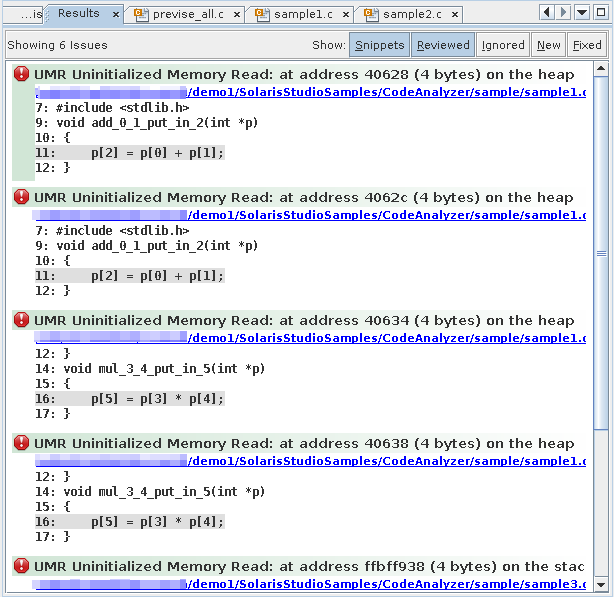
Look at the three issues that were added to the display and see how they are related to the core issues. Fixing the cause of the first issue in the display is likely also to eliminate the second and third issues.
To hide the other dynamic memory access issues while you investigate the first one, click the Ignore button
 for each of the issues.
Note - You can later redisplay the closed issues by clicking the Ignored button at the top of the Results tab. -
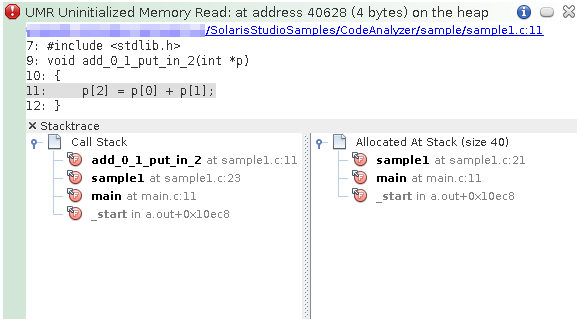
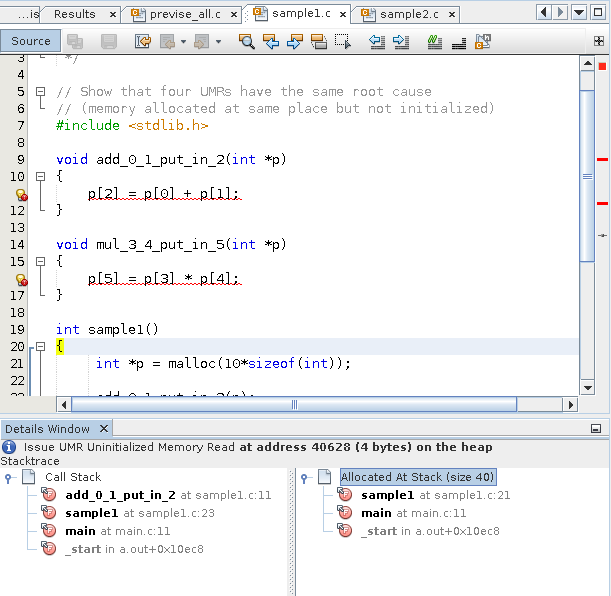
Investigate the first issue by clicking the error icon to display the stack trace.
For this issue, the stack trace includes the Call Stack and the Allocated At Stack.
-
Double-click function calls in the stacks to see the associated lines in the source file.
When the source file opens, the stack trace is displayed in a Details window below the file.
-
Close the Code Analyzer GUI by pressing the X in the upper right corner.