| Oracle® Argus Safety English User's Guide Release 7.0.2 E35668-01 |
|
|
PDF · Mobi · ePub |
| Oracle® Argus Safety English User's Guide Release 7.0.2 E35668-01 |
|
|
PDF · Mobi · ePub |
This chapter discusses the different utility functions to help you view, change, or retrieve case-related information.
To access the Utilities menu, place the cursor over the Utilities menu bar to view the available options.The following utilities are available to you.
Change Password
MedDRA Browser
User Login List
Logs
E2B
Case Undelete
Batch Reports
End of Study
Clear Cache
Advanced Condition Library
The Change Password functionality allows users to change the password that they use to login to Argus. When you log on to the system for the first time, change the password that has been assigned to you.
Note:
LDAP users cannot change their passwords.Select Change Password from the Utilities menu.
When the system opens the Change Password dialog box:
Enter your current password in the Old Password field.
Enter your new password in the New Password field.
Re-enter your new password in the Confirm Password field to verify it.
Click OK to change your password,
3. Your password has been changed.
Be aware of the following:
If the system has difficulty confirming the password, it presents the Password Confirmation Failure dialog box.
You cannot re-enter the password you are currently using when the system prompts you to change your password.
When you update your password, the system displays the system date and time.
Use the Medical Dictionary for Regulatory Activities (MedDRA) to encode diseases, symptoms, signs, and so forth. In Argus Safety, the usage of such a dictionary provides consistency to the assignment of terms for adverse events.
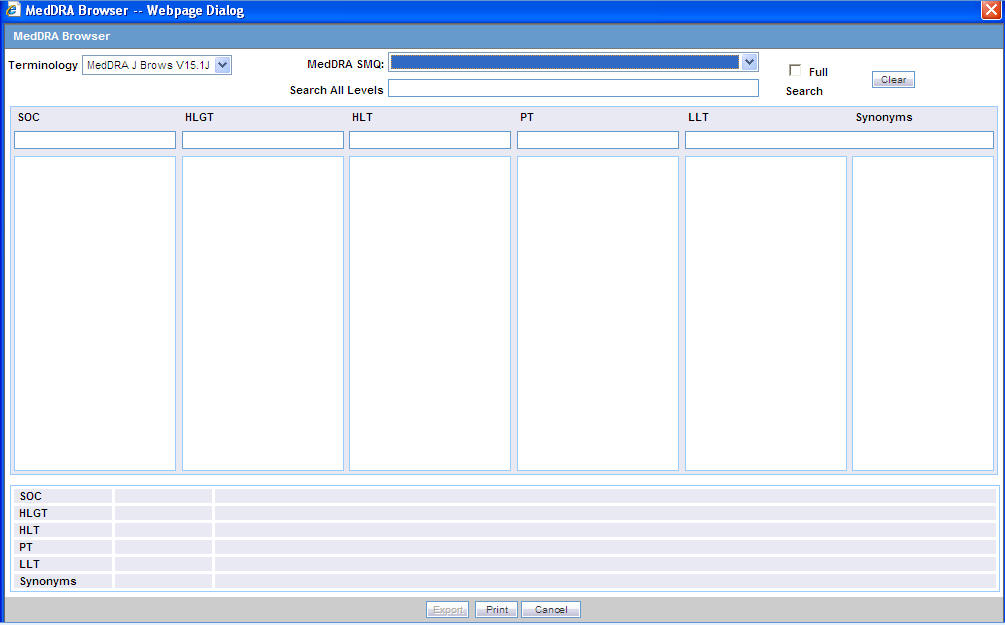
Select Utilities --> MedDRA Browser.
The system opens the MedDRA Browser screen.
The User Login List displays a list of all the current users and their security levels. It also displays a list of all the currently logged in users. The following is an illustration of the User Login List.
Select Utilities --> User Login List.
The system opens the User Login List screen.
When using the User Log List, be aware of the following:
You can click a column heading to sort the displayed records.
By default, the system displays the User Login List in ascending order based on Login Time.
The following table lists and describes the fields on the User Login List.
| Field | Description |
| Full Name | Displays the full name of the user. |
| Login Time | Displays the login time. |
| Workflow Manager | Displays whether the user is a workflow manager or not. |
| OS User Name | Displays the Operating System user name. |
| Terminal | Displays the name of the terminal. |
| Print List | Allows you to print the user login list. |
You can configure the number of cases to display from the Page Size drop-down list in the User Login List dialog box. The Page Size drop-down list contains the following values:
50
100 (default)
250
500
1000
2000
The system displays the number of cases currently in view and automatically updates the range as defined by the Page Size drop-down list. For example, if the user selects 100, the system separates the rows to display into groups of 100 cases.
You can go directly to a range of cases by selecting a range from the Displaying Rows drop-down list.
You can scroll through the User Login List search results in page-by-page increments.
You can select multiple users or click the All users check box in the header.
When you select a user and click Reset User, the system resets all selected users in the list.
The system does not permit you to reset your login.
Logs are a repository of all the cases in the database, displaying the Activity, Audit Data, User ID, and Date/Time entries. Three (3) types of logs are available in Argus:
View Audit Log
LAM Audit Log
View Error Log
Select Utilities --> Logs --> <Log Type> to view a log.
The system open the selected log type.
The audit log is a chart that show modifications that have been made to a particular case since the case's inception.
It also shows which user made the changes, the date and time the changes were made, and the old and new field values. Run the AG Service Audit Log update to audit log all the cases.
Select Utilities --> Logs --> View Audit Log.
The system opens the Audit Log screen.
The Search Conditions section enables you to enter information about the logs you want to view.
The following table lists and describes the fields in the Search Conditions section.
| Field | Description |
|---|---|
| Category | Select the category for the search criterion.
Tip: You can also search for Advanced Conditions in this Application release. The system enables you to Select All to view all updates performed by a user. You can select a category and filter on a specific field elements, and you can view all revisions at the same time by clicking the checkbox near the Revisions column. |
| Case Number | Enables you to search for logs for a specific case number |
| Date Range | Select the date range from the given drop-down list. This selection automatically populates the From and To fields. |
| From | Enter the initial date of the time period to be searched. |
| To | Enter the end date of the time period to be searched. |
| User Name | Select the User Name for the search. |
| Search button | Displays the results of the specified search criteria. |
The system displays the search results in the Total Number of Rows section.
The following table lists and describes the fields in the Total Number of Rows section.
| Field | Description |
|---|---|
| Action | Displays the Audit Log Details screen |
| Activity | Displays the status of the activity. Displays whether it has changed or not. |
| Audit Data | Displays the audit data in the following format:
Name of the entity (such as Advanced Condition): deleted or changed (as applicable) in entity (such as Advanced Condition) |
| User | Displays the last user who made changes to the case. |
| Date/Time | Displays the last time the case was changed.
Note: The time displayed is as per GMT. |
| Print List button | Prints the list of all the logs. |
The Audit Log functionality tracks all central coding activities for the code-able event and products.
Audit log for the case has the record of the central coding related changes. These changes display the Username as the associated Central Coding Username concatenated with Central Coding.
Multiple selections can be made to view the details of revisions.
To view the Audit Log Details screen
Click the Action icon to view the Audit Log Details screen.
2. Click a row displaying a revision to display the details in the upper portion of the screen.
The following table describes the fields in the Audit Log Details screen.
| Field | Description |
| Total Number of Rows | Displays the total number of rows in the list. |
| Parent | Displays the parent screen where the change has been made. |
| Field | Displays the field where the change has been made. |
| Old Value | Displays the previous value. |
| New Value | Displays the new, changed value. |
| Rev | Displays the revision number. The list is sorted in descending order of the revisions that have been made so the latest revision is displayed at the top. |
| User Name | Displays the name of the last user who made a change. |
| Revisions Date | Displays the last date when the change was made. |
| User | Displays the name of the user who last made the revision. |
The LAM Audit Log enables you to track changes made while using the LAM module.
Select Utilities --> Logs --> LAM Audit Log.
The system opens the LAM Audit Log screen.
When using the Argus Safety Audit Log, be aware of the following:
In the Argus Audit Log Options, Category has an <ALL> option that enables viewing of all updates made by a user.
If you select All, you must select the appropriate User Name from the drop-down to enable the Search button. The system updates the default User Name to the name of the user who is logged in.
The system identifies the category on the UI.
The print list displays the Category.
The system updates the element field label based on the category selected by the user. If you do not enter an element value, the system returns the audit details as is does in the current system.
You can view All revisions at the same time by selecting the check box near the revisions column. This system displays the entire audit trail for the elements.
When using the Argus Affiliate Audit Log be aware of the following:
You can filter for a specific Affiliate event in the audit log.
You can view all revisions at the same time by selecting the check box near the revisions column. The system displays the entire Audit trail for the elements.
You can view all LAM user updates made for Argus Safety cases under the LAM Audit Trial. For example, the action Items which can be closed or local labeling performed by a Affiliate user is visible under the LAM audit trail.
Central User updates do not display under the LAM audit trail.
Any user who has access to LAM Audit Log can view All cases associated with that site.
The audit trail detail print includes only the revisions the selected by the user.
The Search Conditions section enables you to enter information for retrieving the audit logs you want to view.
The following table lists and describes the fields in the Search Conditions sections.
| Field | Description |
|---|---|
| Local Event Number | Enter the appropriate local event number. |
| From | Enter the initial date of the time period to be searched. |
| To | Enter the end date of the time period to be searched. |
| Search button | Displays the results of the specified search criteria. |
The system puts the search results in the Total Number of Rows section.
The following table lists and describes the fields in this section.
| Field | Description |
|---|---|
| Action | Displays the Audit Log Details screen. |
| Activity | Displays the status of the activity. Displays whether it has changed or has been added. |
| Audit Data | Displays the audit data. |
| Category | Displays the category data. |
| User | Displays the last user who made changes to the case. |
| Date/Time | Displays the last time the case was changed.
Note: The time displayed is as per GMT. |
| Print List button | Prints the list of all the logs. |
The Audit Log functionality tracks all central coding activities for the code-able event and products.
Audit log for the case has the record of the central coding related changes. These changes display the Username as the associated Central Coding Username concatenated with Central Coding.
Multiple selections can be made to view the details of revisions.
To view the Audit Log Details screen
Click the Action icon to view the Audit Log Details screen.
Click a row displaying a revision to display the details in the upper portion of the screen.
The following table describes the fields in the Audit Log Details screen.
| Field | Description |
|---|---|
| Total Number of Rows | Displays the total number of rows in the list. |
| Parent | Displays the parent screen where the change has been made. |
| Field | Displays the field where the change has been made. |
| Old Value | Displays the previous value. |
| New Value | Displays the new, changed value. |
| Rev | Displays the revision number. The list is sorted in descending order of the revisions that have been made so the latest revision is displayed at the top. |
| User Name | Displays the name of the last user who made a change. |
| Revisions Date | Displays the last date when the change was made. |
| User | Displays the name of the user who last made the revision. |
The Error Log screen provides information about errors that occurred during case processing.
Select Utilities --> Logs --> View Error Log.
The system opens the Error Log screen.
In the Search Conditions section, enter or select a date range and click Search.
The system displays the search results in the Total Number of Rows section.
Locate the error log you want to view and click to view the error message text.
The Search Conditions section enables you to search for error logs based on pre-defined or custom date ranges.
The following table lists and describes the fields in the Search Conditions section.
| Field | Description |
|---|---|
| Date Range | Select the date range from the given drop-down list. This selection automatically populates the From and To fields. |
| From | Enter the initial date of the time period to be searched. |
| To | Enter the end date of the time period to be searched. |
| Search button | Displays the results of the specified search criteria. |
Total Number of Rows
The system retrieves the error logs for the specified date range and places the results in the Total Number of Rows section.
The following table lists and describes the fields in the Total Number of Rows section.
| Field | Description |
| Total Number of Rows | Displays the total number of rows in the list. |
| Argus User Name | Displays the Argus User Name of the user who got the error. |
| OS User Name | Displays the OS User Name of the user who got the error. |
| Error Date | Displays the date and time of the error. |
| Application | Displays the name of the application where the error occurred. |
| Terminal | Displays the name of the terminal where the error occurred. |
| Machine | Displays the name of the machine where the error occurred. |
| Error Text | Displays the text of the error.
Note: click the Zoom icon to view the complete text. |
| Print List button | Prints the list of all the errors. |
The purpose of the E2B Transmit Status and E2B Receive Status screens is to monitor the incoming and outgoing messages and acknowledgments. E2B screens are categorized as:
E2B Transmit
E2B Receive Status
Select Utilities --> E2B --> <E2B Category>.
The system opens the appropriate E2B screen.
The E2B Transmit Status screen enables you to track outgoing messages. The following is an illustration of the E2B Transmit Status screen:
To view E2B transmit status data
Select Utilities --> E2B --> E2B Transmit Status.
When the system opens the E2B Transmit Status screen:
Enter the appropriate search criteria in the Search Reports section.
Click Search to display the search results in the Total Number of Rows section.
The Search Reports section enables you to enter information for retrieving transmission information.
The following table lists and describes the fields in the Search Reports section.
| Field | Description |
|---|---|
| Agency/Trading Partner | Select the agency/trading partner as the receiver from this list. |
| Search button | Displays all the E2b messages and acknowledgments only for the specified receiver.
Note: If 'Any' is selected as the Agency, the search results display all messages and acknowledgements for all receivers. |
| Transmit Date Range | Select this radio button to specify the date range for all transmissions. |
| From | Enter the initial date of the specified period |
| To | Enter the end date of the specified period. |
| Message # Range | Select this radio button to specify the date range for all messages. |
| From | Enter the initial date of the specified period. |
| To | Enter the end date of the specified period. |
| Range | Select the desired range from the list. |
| Type | Select the desired type from the list. |
The system displays the search results in the Total Number of Rows section as shown in the following illustration.
The following table lists and describes the fields in this section.
| Field | Description |
|---|---|
| Total Number of Rows | Displays the total number of rows that displayed in the list, as shown in the parenthesis. |
| Type | Allows the user to view the type of entity transmitted.
Click the Details icon to view the attachment as a PDF. |
| Reports | Allows the user to view the number of attachments transmitted. |
| Trading Partner | Allows the user to view the Reporting Destination to which the attachment is transmitted. |
| Control # | This field is left blank for attachment transmission only. |
| Local Msg# | Displays the local message number. |
| Remote Msg# | Displays the remote message number. |
| File Name | Allows the user to view the filename transmitted by EDI Gateway. |
| Transmit to EDI | Allows the user to view the date and time when the attachment was transmitted to the EDI Gateway. |
| EDI Tracking ID | Allows the user to view the EDI Tracking ID. |
| EDI Transmit Date | Allows the user to view the EDI Transmit Date and Time from the gateway. |
| Transmission Status | Allows the user to view the Transmission Status of the attachment file transmitted from EDI Gateway such as Failure / Success / Pending. |
| EDI Receive Receipt | Allows the user to view the date and time of the EDI MDN Acknowledgement date. |
| Print button | Prints the list. |
Click the Type icon to view these options:
Any - Displays all the E2B messages and acknowledgments
MSG - Double-click on MSG to view messages in the E2B Viewer.
ACK - Double-click on ACK to view the acknowledgement.
When you click these options, the system opens the Message Acknowledgement screen shown in the following illustration. This screen contains all the safety report detail information such as, if the report is loaded or not loaded with error and enables you to monitor message acknowledgements.
The following table lists and describes the fields in the Message Acknowledgement Status dialog box.
| Field | Description |
|---|---|
| ICSR Message Number | Displays the ICSR Message Number. |
| ICSR Message Receiver ID | Displays the ICSR Message Receiver ID. |
| ICSR Message Sender ID | Displays the ICSR Message Sender ID. |
| Sender Acknowledgement Message # | Displays the acknowledgement message number of the sender. |
| ICSR Message Date | Displays the ICSR Message Date. |
| Acknowledgement Message Initiated On | Displays when the acknowledgement was initiated. |
| Transmission Acknowledgement Code | Displays the Transmission Acknowledgement Code. |
| Case # | Displays the Case #. |
| Message | Displays the message. |
| Authority # | Displays the Authority #. |
| Local Case # | Displays the Local Case #. |
| Other # | Displays the Other #. |
| Report Status | Displays the Report Status. |
| E2B Report Type | Displays the type of the E2B Report. |
The E2B Receive Status screen enables you to monitor incoming E2B messages. The following is an illustration of the E2B Receive Status screen:
The Search Reports section enables you to search for received messages.
The following table lists and describes the fields in the Search Reports section.
| Field | Description |
|---|---|
| Agency/Trading Partner | Select the agency/trading partner as the receiver from this list. |
| Receive Date Range | Select this radio button to specify the date range for all transmissions. |
| From | Enter the initial date of the specified period. |
| To | Enter the end date of the specified period. |
| Range | Select a predefined date range from the drop-down list. |
| Message # Range | Select this radio button to specify the date range for all messages. |
| From | Enter the initial date of the specified period. |
| To | Enter the end date of the specified period. |
| Type | Select the desired message type from the list. |
| Search | Initiates the search and displays all the E2b messages and acknowledgments only for the specified receiver.
Note: If 'Any' is selected as the Agency, the search results display all messages and acknowledgements for all receivers. |
The Total Number of Rows section contains the search results.
The following table lists and describes the columns:
| Field | Description |
| Total Number of Rows | Displays the total number of rows that displayed in the list, as shown in the parenthesis. |
| Type | Displays the Type icon containing options. |
| Trading Partner | Displays the name of the trading partner. |
| Control # | Displays the control number. |
| Local Msg# | Displays the local message number. |
| Remote Msg# | Displays the remote message number. |
| Total Reports | Displays the total number of reports. |
| Rejected Reports | Displays the number of rejected reports. |
| File Name | Displays the file name. |
| Receive from EDI | Displays the messages received from EDI. |
| Transmission Status | Displays the Transmission Status. |
| Enables you to print the list. |
Click the Type icon to view these options:
Any - Displays all the E2B messages and acknowledgments
MSG - Double-click on MSG to view messages in the E2B Viewer.
ACK - Double-click on ACK to view the acknowledgement.
When you click these options, the system opens the Message Acknowledgement screen. This screen contains all the safety report detail information such as, if the report is loaded or not loaded with error and enables you to monitor message acknowledgements.
The following table lists and describes the fields in the Message Acknowledgement Status dialog box.
| Field | Description |
|---|---|
| ICSR Message Number | Displays the ICSR Message Number. |
| ICSR Message Receiver ID | Displays the ICSR Message Receiver ID. |
| ICSR Message Sender ID | Displays the ICSR Message Sender ID. |
| Sender Acknowledgement Message # | Displays the acknowledgement message number of the sender. |
| ICSR Message Date | Displays the ICSR Message Date. |
| Acknowledgement Message Initiated On | Displays when the acknowledgement was initiated. |
| Transmission Acknowledgement Code | Displays the Transmission Acknowledgement Code. |
| Case # | Displays the Case #. |
| Message | Displays the message. |
| Authority # | Displays the Authority #. |
| Local Case # | Displays the Local Case #. |
| Other # | Displays the Other #. |
| Report Status | Displays the Report Status. |
| E2B Report Type | Displays the type of the E2B Report. |
The Case Undelete option enables you to restore deleted cases.
Select Utilities --> Case Undelete.
When the system opens the Undeleted Cases screen, enter the appropriate information in the Case Search Criteria fields and click Search.
The Case Search Criteria enables you to enter information to help you retrieve deleted cases.
The following table lists and describes the fields in this section.
| Field | Description |
|---|---|
| Case Number | Enables you to enter the number for a specific case. |
| Date Range | Enables you to select a date range from which cases may be selected. The selection made from the Date Range drop-down list automatically populates the From and To fields. |
| From | Displays the initial date of the search period |
| To | Displays the end date of the search period |
| Search | Click to display the Search results that match the specified search criteria |
When the system displays the search results in the Total Number of Rows section:
Locate the case you want to restore and click the check box associated with its case number.
Click Case Undelete.
The system displays the search results in the Total Number of Rows section on the Case Undelete screen.
The following table lists and describes the columns in the Total Number of Rows Section
| Field | Description |
|---|---|
| Total Number of Rows | Displays the total number of rows in the list |
| Check Box | Enables you to select the case to restore. |
| Case Number | Displays the case number of each deleted case. |
| Initial Receipt Date | Displays the initial receipt date of the case. |
| Product | Displays the product category that the belongs to. |
| Event | Displays the event related to the deleted case. |
| Workflow State | Displays the workflow state of the case. |
| Serious | Displays if the deleted case was serious or not. |
| Deleted By | Displays the name of the user who deleted the case. |
| Deleted Date | Displays when the case was deleted. |
| Justification | Displays the justification for deleting the case.
Note: Click the check box corresponding to the case to view the justification for its deletion. |
| Case Undelete | Displays the Justification dialog box.
Enables you to restore the selected case number. |
| Print List | Prints the current worklist for reference. |
When the system opens the Action Justification dialog box:
Enter the justification manually in the Please enter a justification for performing this action field
OR
Select a preconfigured justification from the Select a standard justification for this field drop-down list.
Click OK.
When using Case Undelete functions, be aware of the following:
You can search for a specific case from the Case Undelete dialog shown in the following illustration.
If you enter the Case Number to search for a specific case, the following apply:
The system disables the date range fields including From and To.
If you enter an invalid case number, the system displays the following message:
The Case Number entered is not valid. Please enter a correct Case Number and search again.
You can configure the number of cases to display in the Case Undelete dialog box from the Page Size drop-down list.
The Page Size drop-down list contains the following values:
50
100 (default)
250
500
1000
2000
The system displays the number of cases currently in view and automatically updates the range as defined by the Page Size drop-down list. For example, if you select 100, the system separates the rows to display into groups of 100 cases.
You can go directly to a range of cases by selecting a range from the Displaying Rows drop-down list.
You can scroll through the Case Undelete search results in page-by-page increments as defined in the Page Size drop-down list.
The following table lists and describes the fields in the Action Justification dialog box.
| Field | Description |
|---|---|
| Please enter a justification for performing this action | Enter the text that justifies the need to un-delete a case. |
| Select a standard justification for this field | Contains standard, pre-configured descriptions of justifications for un-deletion. |
| Spell Check | Checks the entered/selected text for any grammatical errors. |
| OK | Saves the justification entered/selected for case un-deletion. |
| Cancel | Exits out of this dialog without saving any justification. |
The Batch Reports dialog displays a list of those batch reports that have been scheduled for generation.
To view a list of batch reports
Select Batch Reports from Utilities in the menu bar.
The system opens Batch Reports dialog box with a list of batch reports along with their report titles and next run dates.
Description of the illustration batchreportsdb.gif
To delete a batch report from the list
Select the check box corresponding to the batch report to delete.
Click Delete.
When a study is complete, use the End of Study utility to unblind all the cases associated with the study at the same time instead of unblinding them one by one.
Select Utilities --> End of Study.
The system opens the End of Study Unblinding dialog box.
Description of the illustration studyunblinding.gif
The following table lists and describes the fields in the End of Study Unblinding dialog box.
| Field | Description |
|---|---|
| Display only Unbroken cases | Enables the user to view only unbroken cases |
| End of Study Unblinding | Only those studies that are "Eligible for unblinding" (as determined via List Maintenance) are displayed in this list. Select a study from this list. This populates the list of cases based on the study chosen. |
| Case ID | Displays the ID of each case. |
| AE Date | Displays the Associated Event Date for the case. |
| Pat ID | Displays the Patient ID. |
| Rand No | Displays the Randomization Number of the case. |
| Drug Received | Displays the name of the drug received. |
| Dosage | Displays the Select button to view the Dosage Regimens screen. |
Select the appropriate study from the End-of-Study Unblinding drop-down list.
When the system displays the selected information, locate the appropriate study and click Select in the End of Study dialog.
When the system opens the Dosage Regimens dialog box, enter the drug dosage information as required.
Click OK to save the changes, update the cases, and close this dialog.
Note:
For each case that is unblinded by this method, the Blinding Status is adjusted to "Broken After Study" if the study type is single or double blinded and fills information about the Unblinding Date, Study Drug, Follow-up Received Date, Mark case as Significant, and Dosage Regimen.This section describes the steps required to clear cache. This action clears the previously stored information in the system.
To clear your cache of previously stored information
Select Utilities --> Clear Cache.
The system clears the cache and displays the following message in the Clear Cache dialog box.
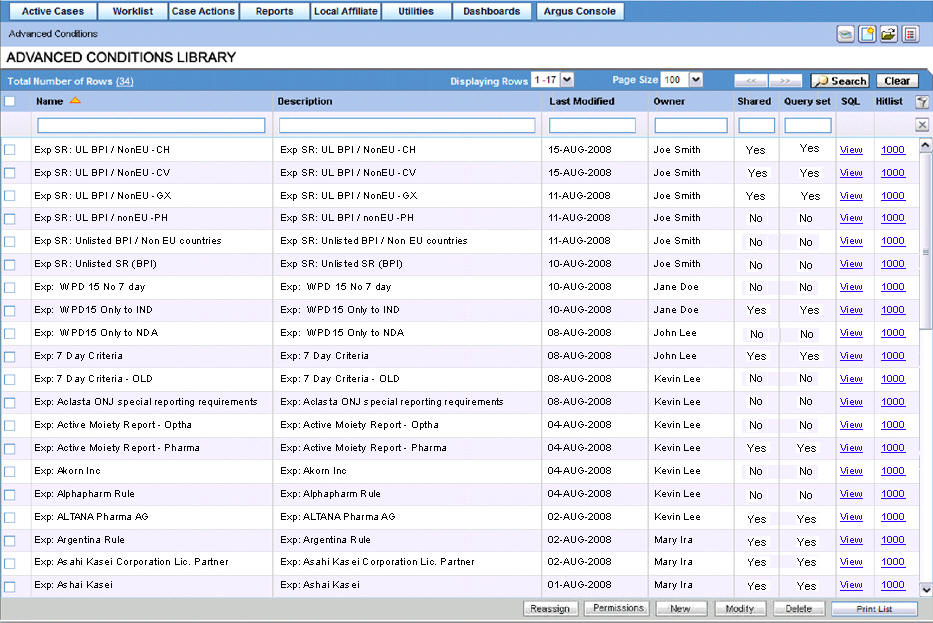
The Advanced Condition Library option enables you to access the advanced condition library and do the following:
Create a new advanced condition
Reassign an advanced condition
Set advanced condition permission levels
Modify an existing advanced condition
Delete an advanced condition
Print a list of advanced conditions
To open the Advanced Condition Library
Select Utilities --> Advanced Condition Library.
The system opens the Advanced Condition Library screen.
For further information about Advanced Conditions, see Advanced Conditions.
All the fields on this page are type-ahead fields.
To search for existing query sets or advanced conditions, enter the search criteria and click Search.
The following table lists and describes the fields in the Advanced Condition Library.
| Field | Description |
|---|---|
| Name | The name of the Query Set or Advanced Condition given by the user. |
| Description | A description of the Query Set or Advanced Condition given by the user. |
| Last Modified | The date the last modification was made. |
| Owner | The current owner of the Query Set or Advanced Condition. |
| Shared | Displays whether the Query Set or Advanced Condition has been shared or not. |
| Query Set | Displays whether the record in the row is a Query Set or not. |
| SQL | Displays a View link that redirects the user to a Qery Set or Advanced Condition dialog for the selected record. |
| HitList | Appears only if the selected Query Set or Advanced Condition has a HitList. It displays a link displaying the number of hits on the last HitList update. |
|
Copyright © 2013, Oracle and/or its affiliates. All rights reserved. Legal Notices |
|