Oracle® Enterprise Manager Ops Center
Tuning Monitoring Rules and Policies
12c Release 2 (12.2.2.0.0)
E40793-02
December 2014
This guide provides an end-to-end example for how to use Oracle Enterprise Manager Ops Center.
Introduction
Oracle Enterprise Manager Ops Center includes a set of monitoring policies that provide in-depth monitoring for your managed assets. This example shows you how to tune the alert triggers for your organization. For example, you might want to create a specific monitoring profile for assets that are on a critical path.
All of the monitoring rules for a specific type of asset, such as an operating system, are bundled into a monitoring policy. When you add an asset to Oracle Enterprise Manager Ops Center, the software automatically begins monitoring it with the appropriate default monitoring policy. You can use the default policies, or you can tune them for your needs. Tuning includes disabling, editing, and adding rules. You can tune rules for an individual asset, or you can create customized policies that monitor groups of like-assets. For example, you can create a group and add your mission-critical operating systems to the group. You can then create a monitoring policy with rules that are specific for the members of that group.
Monitoring rules define the values and boundaries for an asset's activity and the alerting conditions. Information on the available monitored attributes is available in the Javadoc that is in the Oracle Enterprise Manager Ops Center Software Developer's Kit (SDK). System-defined rules are for specific attributes and are hard-coded into the drivers. You can only disable and enable them. The more interesting rules are the user-defined rules. You can edit them, add new rules, or apply rules to a specific asset or group of assets.
User-defined rules are associated with, and determined by, the type of managed resource:
-
Threshold: Sets an upper or lower monitoring threshold for the monitored attribute.
-
Boolean Control: Sets a logical operator of true or false for the monitored attribute.
-
Enumerated Control: A series of values that defines a subset of specific values among the possible values of the monitored attribute. An alert occurs when the attribute matches one of those specific values.
-
Expression: Defines the variables, literals, and operators for an attribute. An expression is an instruction to execute something that returns a value.
Most types of user-defined rules include some parameters that you can tune, or edit. For example, threshold type rules have default values for Info, Warning, and Critical severity level alarms. You can change the values for each severity level.
You can view and edit the rules for a specific asset or policy:
-
Asset View: Rules for a specific asset are located in asset's Monitoring tab. Select an asset in the Asset section of the Navigation pane, then click the Monitoring tab in the center pane. Editing a rule from the asset view creates a new policy for that asset.
-
Policy View: Rules for a specific policy are located in Monitoring Policies in Plan Management. Expand Plan Management in the Navigation pane, scroll down to the Operational Plans section and click Monitoring Policies. Editing a rule from the policy view changes the monitoring policy.
Policies enable you to maintain consistency by applying the same rule parameters to individual assets or to a group of assets. When you edit a rule from the asset view, you create a separate policy. This might be appropriate for a single system, but the preferred method is to perform the tasks from the policy view. When you tune from the policy view, all assets associated with the policy use the same rules.
This document provides an example of how you can tune monitoring for your organization. This example shows you how to copy the generic OC - Operating System monitoring policy and create a new policy called Critical Operating Systems and create a new policy called Critical Servers. In this example, a policy is tuned by editing an existing rule, creating three new rules, and then assigning systems to the policy.
See Related Articles and Resources for links to related information and articles.
What You Will Need
You need the following to tune monitoring:
-
Several agent-managed operating systems managed with Oracle Enterprise Manager Ops Center.
-
The Profile/Plan Admin role to modify monitoring policies.
-
The Fault Admin role to apply a monitoring policy to an asset. To apply the monitoring policy to a group, the Asset Admin role is also required.
Tuning Monitoring Rules and Policies
Tuning rules and policies involves creating monitoring policies and revising monitoring rules to meet your organization's objectives.
This example describes how to do the following:
Create a New Policy
Oracle Enterprise Manager Ops Center has a default set of monitoring polices. The default set of policies all begin with the letters OC and are read-only. The policies are based on a target type. You cannot edit or add to the default policies, but you can copy an existing policy for the target type that you want to monitor, such as operating systems, and create an editable version. Alternatively, you can create a new policy and select the subtype for the policy.
You will need to create two policies to use for later tasks. Either method is acceptable. This example uses both methods to create the new policies.
-
Create a policy for critical operating systems by using the Copy Policy action, see To Create a Copy of a Policy.
-
Create a new policy for critical servers by using the Create Policy action, see To Create a Policy.
This example creates a policy for critical operating systems.
-
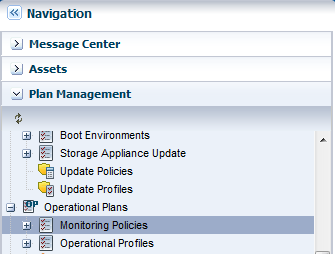
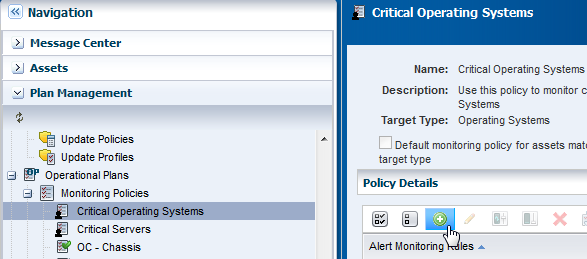
Expand Plan Management in the Navigation pane, scroll down to Operational Plans, then click Monitoring Policies.
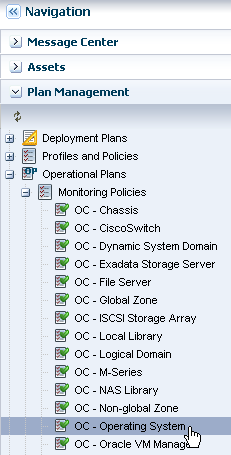
Description of the illustration nav_policies.png
-
Right click and click Copy Policy or click Copy Policy in the Actions pane.
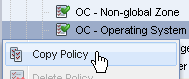
Description of the illustration copy_policy.png
-
Revise the policy name and description for the new policy, then click Next. In this example, the new policy is named Critical Operating Systems.
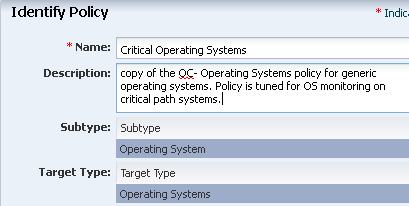
Description of the illustration id_policy.png
-
Click Finish to create the policy.
The policy appears in the list of Monitoring Policies. Click the policy to display details in the center pane. You can now tune the new policy by editing and adding rules.
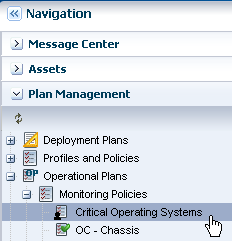
Description of the illustration new_policy.png
This example creates a new policy for critical servers.
-
Expand Plan Management in the Navigation pane, scroll down to Operational Plans, then click Monitoring Policies.
Description of the illustration nav_monitor_policy.png
-
Right click and click Create Policy in the Navigation pane, or click Create Policy in the Actions pane.
-
Enter a policy name and description, then select Server as the subtype. In this example, the new policy is named Critical Servers. Click Next.
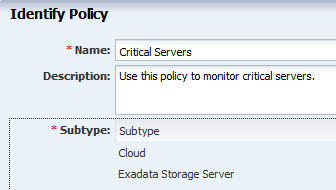
Description of the illustration policyid_server.png
-
Click Finish to create the policy. The policy includes the default rules based on the Server subtype that you selected for the policy in the previous step.
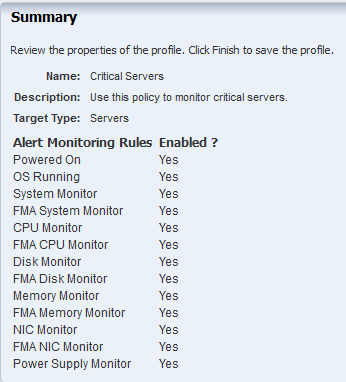
Description of the illustration policy_summary_server.png
You can edit the rules to customize them for your environment.
Edit a Rule
You can only edit rules that are in user-defined policies. You cannot change the monitored attribute, rule name, or description of a user-defined policy, but you can change the monitoring and alert conditions. You can change the monitoring time frame, the amount of time between when the event occurs and the alert to generate, the alert parameters, and the actions.
This example shows how to change the alert parameters for a threshold type rule to be more stringent for the critical operating systems.
-
Expand Plan Management in the Navigation pane, scroll down to Operational Plans, then click Monitoring Policies. Select the Critical Operating Systems policy that you created earlier.
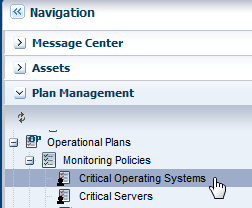
Description of the illustration nav_criticalos.png
-
With the policy open in the center pane, select the rule you want to edit, then click the Edit icon. In this example, the File System Reachability rule in the Boolean Control rules section is selected.
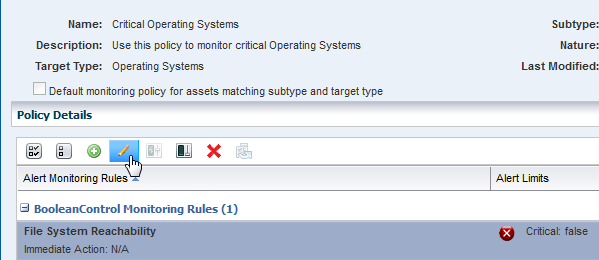
Description of the illustration os_fs_rule.png
-
Edit the rule parameters. In this example, the default time to generate an alert is changed from 10 minutes to 5 minutes.
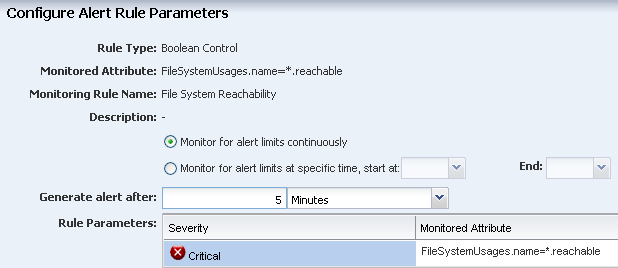
Description of the illustration edit_rule.png
-
Click Apply to submit the changes.
Add New Rules
In addition to using the default rules, you can create your own rules and add them to your user-defined monitoring policies. Before you add new rules, you must know the valid constructor details, attributes, and parameters. See the Oracle Enterprise Manager Ops Center Feature Reference Guide for details on monitoring attributes, classes, lexical elements, grammar, and semantics. See Get a List of the Monitoring Attributes for the steps to download the API Javadocs that are part of the Software Development Kit (SDK) package.
The following examples are available for creating a new rule:
Note:
It is a good practice to test your new rules. The software will show that you have successfully added your rule, but it does not test the validity of the new rule. In some, but not all cases, the word No appears in the Enabled column for a newly created, but invalid rule.Get a List of the Monitoring Attributes
The Java documentation contains a list of the valid attributes that you can use when you create new monitoring rules. The Java documentation is in the Software Development Kit package (SUNWxvmoc-sdk.pkg) in the Oracle Enterprise Manager Ops Center downloaded installation bundle.
-
Go to the
/OC/xvmoc_full_bundle/SunOS_*/Product/components/packagesdirectory on the Enterprise Controller./var/tmp/OC/xvmoc_full_bundle/SunOS_i386/Product/components/packages -
Unpack the Software Development Kit package (SUNWxvmoc-sdk.pkg). You can do this on the Enterprise Controller, or any other system.
# pkgadd -d SUNWxvmoc-sdk.pkg -
Open the javadoc index, then the OperatingSystem javadoc page, or just go to the OperatingSystem javadoc page.
Index: file:///<host_name>/xvm_oc/doc/javadoc/index.html
or
OperatingSystem page: file:///<host_name>/xvm_oc/doc/javadoc/com/sun/hss/type/os/OperatingSystem.html
-
Locate the parameter you need. This image shows a FileSystemUsage constructor that creates a Boolean rule and Expression rule later in this document. The javadoc provides the constructor details, and the parameters that you can use in creating a rule. In this case, the parameters are: name, type, totalSpace, freeSpace, usedSpace, freeSpacePercentage, and usedSpacePercentage. A brief description appears next to each parameter.
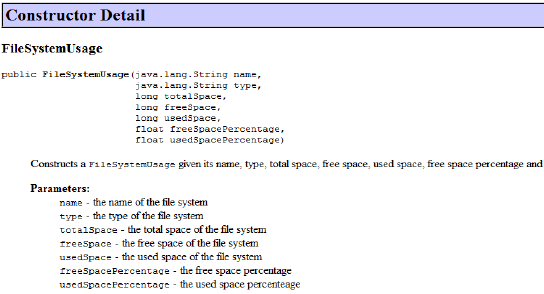
Description of the illustration javadoc_fs_usage.png
See Expression Query Language in the Oracle Enterprise Manager Ops Center Feature Reference Appendix Guide for details on monitoring attributes, classes, lexical elements, grammar, and semantics.
Add a New Threshold Rule
A Threshold rule sets an upper or lower monitoring threshold for the monitored attribute. You must define the monitored attribute for threshold rules.
The following are some examples of monitored attributes:
-
CpuUsage.usagePercentage
-
ProcessUsage.topMemoryProcesses.pid=*.physicalMemoryUsage
-
DiskUsageSet.name=*.busyPercentage
See the Oracle Enterprise Manager Ops Center Feature Reference Appendix Guide for details on monitoring attributes, classes, lexical elements, grammar, semantics, and examples.
-
Expand Plan Management in the Navigation pane, scroll down to Operational Plans, then click Monitoring Policies. Select the type of monitoring policy to which you want to add a rule.
Description of the illustration nav_criticalos.png
-
With the policy open in the center pane, click the Add icon.
Description of the illustration add_rule.png
-
Select Threshold from the menu.
-
Enter the monitored attribute and description.
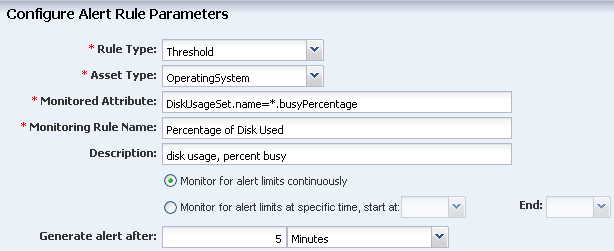
Description of the illustration threshold_attribute.png
-
Define the amount of time that can elapse before an alert is generated, then define the alert severity parameters and limits.
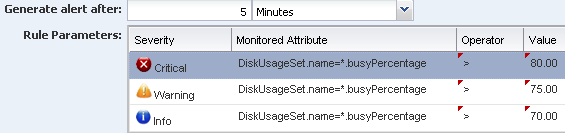
Description of the illustration threshold_alert.png
-
Click Apply.
The new rule is now part of the policy.
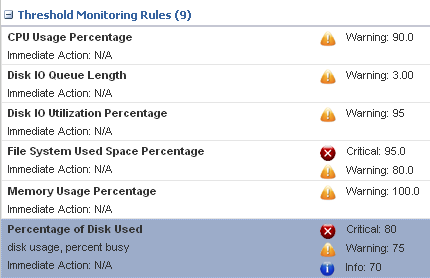
Description of the illustration new_threshold_rule.png
Add a New Boolean Rule
A Boolean rule sets a logical operator of true or false for the monitored attribute.
A default Boolean rule uses the FileSystemUsages.name=*.reachable parameter and generates a critical problem when the file system is not reachable for five (5) minutes. This example uses the same parameter, but triggers a warning when the file system cannot be reached for two (2) minutes.
-
Expand Plan Management in the Navigation pane, scroll down to Operational Plans, then click Monitoring Policies. Select the policy for the rule.
-
With the policy open in the center pane, click the Add icon.
Description of the illustration add_rule.png
-
Select Boolean Control from the Rule Type menu.
-
Enter FileSystemUsages.name=*.reachable in the monitored attribute field, name the rule, and add a description
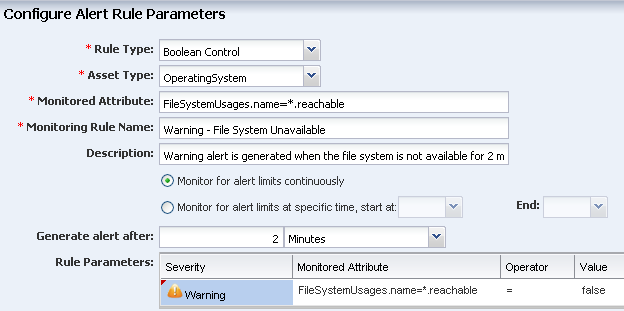
Description of the illustration rule_boolean.png
-
Define the amount of time that can elapse before an alert is generated. This example uses 2 minutes. Select the Warning severity parameter. The monitored attribute is populated from the field at the top of the page. The operator is equals (=) and the Value is false.
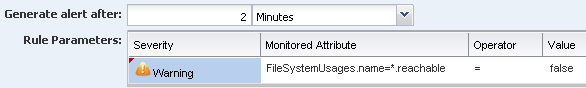
Description of the illustration boolean_parameters.png
-
Click Apply.
The new rule is now part of the policy. The first rule is the default system-defined Boolean control rule that generates a Critical problem when the file system is not reachable for 5 minutes. The second rule, which is highlighted, is the new rule that generates a Warning when the file system is not reachable for 2 minutes.
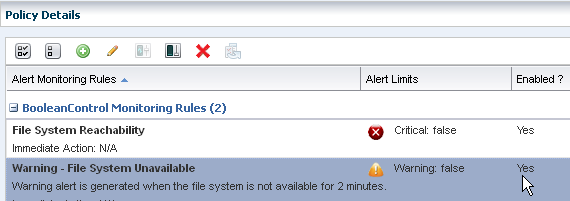
Description of the illustration rule_boolean_enabled.png
Add a New Enumerated Rule
An Enumerated rule contains series of values that defines a subset of specific values among the possible values of the monitored attribute. An alert occurs when the attribute matches one of those specific values. The state of the SMF service for a non-global zone is an example of an enumerated rule. The attribute ServiceInfos.id=*.state is used in this example. The rule generates a critical alert when the SMF services are disabled.
-
Expand Plan Management in the Navigation pane, scroll down to Operational Plans, then click Monitoring Policies. Select the policy for the rule.
-
With the policy open in the center pane, click the Add icon.
Description of the illustration add_rule.png
-
Select Enumerated Control from the Rule Type drop-down menu and OperatingSystem from the Asset Type drop-down menu.
-
Enter ServiceInfos.id=*.state in the monitored attribute field, name the rule, and add a description.
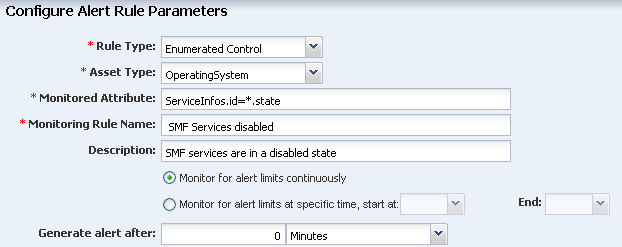
Description of the illustration rule_enumerated_param.png
-
Define the amount of time that can elapse before an alert is generated. In this example, the policy is 0 minutes and there is no delay before generating an alert. Select the Critical severity parameter. The monitored attribute is populated from the field at the top of the page. The operator is equals (=) and the Value is disabled.
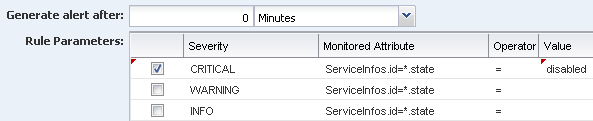
Description of the illustration rule_enumerated_param2.png
-
Click Apply.
The new rule is now part of the policy. When the SMF service is disabled, a critical alert is generated.
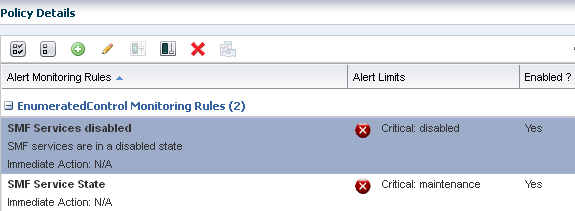
Description of the illustration rule_enumerated_enabled.png
Add a New Expression Rule
An expression is an instruction to execute something that returns a value. An Expression rule defines the variables, literals, and operators for an attribute. An expression rule specifies an expression that references one or more attributes to monitor
To create an expression monitoring rule, you must use the Oracle Enterprise Manager Ops Center query language to write a logical expression that defines the alerting condition for one or more resource attributes. The logical expression includes attribute names, operators, and literal values. You can use a dotted notation to reference attribute subfields.
The asset type is based on the policy. This example is based on a server policy and will raise an alert when the root disk is above 80% and the CPU usage is above 10. The expression for this example is: FileSystemUsages.name="/".usedSpacePercentage >= 80) AND (CpuUsage.usagePercentage >= 10.
-
Expand Plan Management in the Navigation pane, scroll down to Operational Plans, then click Monitoring Policies.
-
Select the Critical Servers policy that you created earlier. Click the Add icon in the center pane to add an alert monitoring rule.
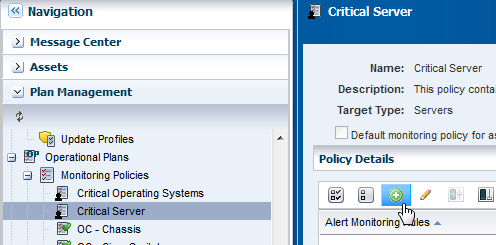
Description of the illustration add_rule_server.png
-
Configure the rule with following parameters:
-
Select Expression from the Rule Type menu.
-
The default Asset Type is Server. This is based on the monitoring policy and is the only option available.
-
Enter a monitoring rule name and description.
-
Select the monitoring frequency. This example uses Monitor for alert limits continuously.
-
Define the amount of time that can elapse before an alert is generated. In this example, the policy is two (2) minutes and there is no delay before generating an alert.
-
Select the Warning severity parameter.
-
Enter the expression that you created. For this example, enter the following:
FileSystemUsages.name="/".usedSpacePercentage >= 80) AND (CpuUsage.usagePercentage >= 10
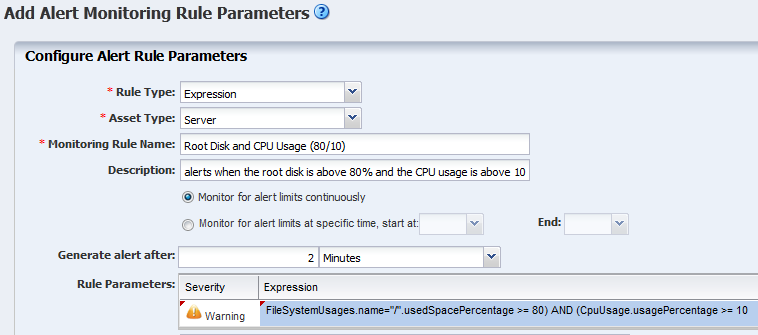
Description of the illustration add_rule_exp2.png
-
-
Click Apply.
The new rule is now part of the policy. An alert will generate when the root disk is above 80% and the CPU usage is above 10.
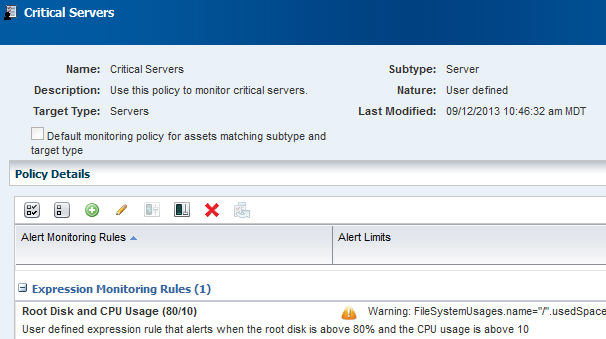
Description of the illustration add_rule_exp3.png
Associate a Group of Assets With the Policy
The software automatically assigns a default monitoring policy when an asset is managed. You can change that default action for a defined set of systems by creating a group and associating the group with your customized monitoring policy.
With this example, you created a monitoring policy called Critical Operating Systems and tuned the rules to be more stringent. Now you can create an asset group and assign the monitoring policy to the group.
You can configure group rules to automatically add newly managed assets to the group. This example assumes that the host name for each of your critical operating systems includes the term xvm and uses that as a deciding factor in what is added to the group.
-
Click Assets in the Navigation pane, then click Create Group.
-
Enter a name and description for the group. Select a Top Level location. In Advanced Options, select Configure Group Rules and Preview Group Before Creation. Click Next.
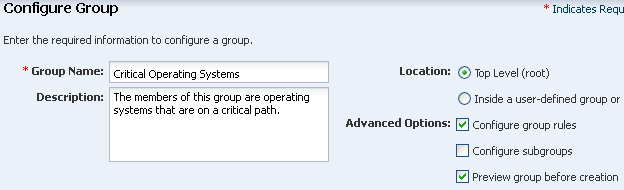
Description of the illustration group_create.png
-
Configure the group rules. Select All, then select Operating System as the asset type in the first drop-down menu. Use the Add icon to add rules. This example uses one rule, which is to add all assets that have a user friendly name that contain the term xvm. Click Next.

Description of the illustration group_rules.png
-
The Preview Group page shows all assets that meet the rules that you defined. These are the assets that will be added to the group. Click Next.
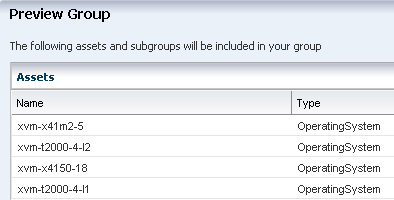
Description of the illustration group_preview.png
-
Click Finish to create the group.
-
Expand Assets, select All User Defined Groups filter from the menu.
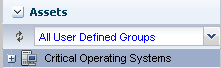
Description of the illustration group_user_defined.png
-
Select the group. The Summary page and Membership Graph appear in the center pane. The Membership Graph shows the group with four members. One of the members has a Warning alert. The Warning shows on the affected asset and at the group level.

Description of the illustration group_membership_graph.png
-
Click Apply Monitoring Profile in the Actions pane.
-
Select the policy from the Policy menu, then click Apply.
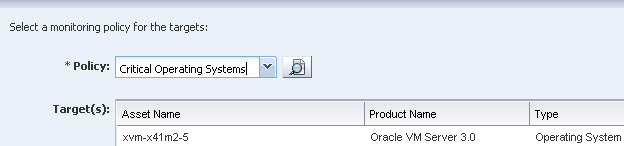
Description of the illustration group_apply_policy.png
The policy is now associated with all assets in the group. To see all assets associated with the policy, open the policy in Plan Management, then view the Membership Graph, or click View Associated Assets.
What's Next?
Use the Analytics feature to analyze how a specific operating system is performing, and further tune the rules. You can create monitoring policies for other asset types and add those policies to your user-defined groups.
A best practice is to tune the rules in the monitoring policy, not the asset. When you tune a rule from the asset view, you create a new policy. The new policy is no longer associated with the group or with other assets of the same type and you can easily lose consistency in your monitoring strategy.
Related Articles and Resources
See the Oracle Enterprise Manager Ops Center Feature Reference Guide for more information on the features. The documentation is available at >http://docs.oracle.com/cd/E40871_01/index.htm.
The following chapters in the Oracle Enterprise Manager Ops Center Feature Reference Guide contain more information:
See Expression Query Language in the Oracle Enterprise Manager Ops Center Feature Reference Appendix Guide for details on monitoring attributes, classes, lexical elements, grammar, and semantics.
For end-to-end examples, see the workflows and how to documentation in the Deploy How To library at http://docs.oracle.com/cd/E40871_01/nav/deployhowto.htm and the Operate How To library at http://docs.oracle.com/cd/E40871_01/nav/operatehowto.htm.
Documentation Accessibility
For information about Oracle's commitment to accessibility, visit the Oracle Accessibility Program website at http://www.oracle.com/pls/topic/lookup?ctx=acc&id=docacc.
Oracle customers that have purchased support have access to electronic support through My Oracle Support. For information, visit http://www.oracle.com/pls/topic/lookup?ctx=acc&id=info or visit http://www.oracle.com/pls/topic/lookup?ctx=acc&id=trs if you are hearing impaired.
Oracle Enterprise Manager Ops Center Tuning Monitoring Rules and Policies, 12c Release 2 (12.2.2.0.0)
E40793-02
Copyright © 2007, 2014, Oracle and/or its affiliates. All rights reserved.
This software and related documentation are provided under a license agreement containing restrictions on use and disclosure and are protected by intellectual property laws. Except as expressly permitted in your license agreement or allowed by law, you may not use, copy, reproduce, translate, broadcast, modify, license, transmit, distribute, exhibit, perform, publish, or display any part, in any form, or by any means. Reverse engineering, disassembly, or decompilation of this software, unless required by law for interoperability, is prohibited.
The information contained herein is subject to change without notice and is not warranted to be error-free. If you find any errors, please report them to us in writing.
If this is software or related documentation that is delivered to the U.S. Government or anyone licensing it on behalf of the U.S. Government, then the following notice is applicable:
U.S. GOVERNMENT END USERS: Oracle programs, including any operating system, integrated software, any programs installed on the hardware, and/or documentation, delivered to U.S. Government end users are "commercial computer software" pursuant to the applicable Federal Acquisition Regulation and agency-specific supplemental regulations. As such, use, duplication, disclosure, modification, and adaptation of the programs, including any operating system, integrated software, any programs installed on the hardware, and/or documentation, shall be subject to license terms and license restrictions applicable to the programs. No other rights are granted to the U.S. Government.
This software or hardware is developed for general use in a variety of information management applications. It is not developed or intended for use in any inherently dangerous applications, including applications that may create a risk of personal injury. If you use this software or hardware in dangerous applications, then you shall be responsible to take all appropriate fail-safe, backup, redundancy, and other measures to ensure its safe use. Oracle Corporation and its affiliates disclaim any liability for any damages caused by use of this software or hardware in dangerous applications.
Oracle and Java are registered trademarks of Oracle and/or its affiliates. Other names may be trademarks of their respective owners.
Intel and Intel Xeon are trademarks or registered trademarks of Intel Corporation. All SPARC trademarks are used under license and are trademarks or registered trademarks of SPARC International, Inc. AMD, Opteron, the AMD logo, and the AMD Opteron logo are trademarks or registered trademarks of Advanced Micro Devices. UNIX is a registered trademark of The Open Group.
This software or hardware and documentation may provide access to or information about content, products, and services from third parties. Oracle Corporation and its affiliates are not responsible for and expressly disclaim all warranties of any kind with respect to third-party content, products, and services unless otherwise set forth in an applicable agreement between you and Oracle. Oracle Corporation and its affiliates will not be responsible for any loss, costs, or damages incurred due to your access to or use of third-party content, products, or services, except as set forth in an applicable agreement between you and Oracle.