32 Monitoring Oracle Unified Directory
Oracle Unified Directory provides an extensible monitoring framework. This chapter provides an overview of the monitoring functionality, and describes how to configure monitoring. When the monitoring framework has been configured, you can view the statistics on a server instance, or replicated topology.
This chapter covers the following topics:
-
Section 32.4, "Configuring Alerts and Account Status Notification Handlers"
-
Section 32.8, "General Purpose Enterprise Monitoring Solutions"
32.1 Monitoring Overview
Monitoring information and performance data can be found in:
-
logs
For information about configuring logs, see Section 32.3, "Configuring Logs".
-
alerts
For information about configuring alerts, see Section 32.4, "Configuring Alerts and Account Status Notification Handlers".
-
cn=monitorFor information about
cn=monitor, see Section 32.5, "Monitoring the Server With LDAP". -
DIRECTORY_SERVER_MIB, defined by RFC 2605
For information about monitoring the server with SNMP, see Section 32.6, "Monitoring the Server With SNMP".
To access the monitoring information, ensure that you have the required protocol:
-
For logs you need a file system.
-
For alerts you need JMX:RMI or SMTP.
-
For
cn=monitoryou need LDAP or JMX:RMI (for example jconsole). -
For DIRECTORY_SERVER_MIB you need SNMP.
32.2 Configuring Monitor Providers
Monitor providers are enabled by default and provide information about the server that can be useful for monitoring or troubleshooting purposes. The cn=monitor entry contains the monitoring information that is published by the monitor providers. When the monitor provider is disabled, the provided information is no longer available under cn=monitor.
Monitor providers can be configured by using the dsconfig command. For more information, see Section 17.1, "Managing the Server Configuration With dsconfig".
32.2.1 To View Monitor Providers
Run the dsconfig command with the list-monitor-providers subcommand, as follows:
$ dsconfig -h localhost -p 4444 -D "cn=directory manager" -j pwd-file -X -n \
  list-monitor-providers

Monitor Provider   : Type              : enabled
-------------------:-------------------:--------
Client Connections : client-connection : true
Entry Caches       : entry-cache       : true
JVM Memory Usage   : memory-usage      : true
JVM Stack Trace    : stack-trace       : true
System Info        : system-info       : true
Version            : version           : true
32.2.2 To Disable a Monitor Provider
Run the dsconfig command with set-monitor-provider-prop as follows:
For example, to set the JVM Stack Trace monitor provider to false, use the following command:
$ dsconfig -h localhost -p 4444 -D "cn=Directory Manager" -j pwd-file -X -n \
  set-monitor-provider-prop --provider-name "JVM Stack Trace" \
  --set enabled:false
Running the dsconfig command with the list-monitor-providers subcommand now shows the JVM Stack Trace monitor provider as false:
Monitor Provider   : Type             : enabled
-------------------:-------------------:--------
Client Connections : client-connection : true
Entry Caches       : entry-cache       : true
JVM Memory Usage   : memory-usage      : true
JVM Stack Trace    : stack-trace       : false
System Info        : system-info       : true
Version            : version           : true
32.3 Configuring Logs
Oracle Unified Directory provides several types of logs: access logs, audit logs, error logs, debug logs, and a replication repair log. The replication repair log is read-only and its use is restricted to enabling replication conflict resolution. The following sections describe how to configure access, audit, error, and debug logs by using the dsconfig command-line interface or Oracle Directory Services Manager. In addition, the section describes how to log admin operations.
For a breakdown of the result codes found in the logs, see Section E.17.11, "result code."
This section contains the following topics:
32.3.1 Configuring Logs by Using dsconfig
The easiest way to configure logging with dsconfig is to use the command in interactive mode, which walks you through the configuration. This section provides the required commands in non-interactive mode, so that you can see the specific parameters that are set. For more information about dsconfig, see Section 17.1, "Managing the Server Configuration With dsconfig".
Log configuration includes the definition of three configuration objects:
-
Log publisher. A log publisher is defined for each logger. The log publisher type corresponds to the type of log. For more information about log publishers, see Section 32.3.1.1, "Configuring Log Publishers".
-
Log retention policy. The retention policy determines how long archived log files are stored. For more information about log retention policies, see Section 32.3.1.2, "Configuring Log Retention Policies".
-
Log rotation policy. The rotation policy determines how often log files are rotated. For more information on log rotation policies, see Section 32.3.1.3, "Configuring Log Rotation Policies".
32.3.1.1 Configuring Log Publishers
Oracle Unified Directory provides several log publishers by default.
Any number of log publishers of any type can be defined and active at any time. This means that you can log to different locations or different types of repositories and that you can specify various sets of criteria for what to include in the logs.
For more information about the configuration properties associated with log publishers, see Oracle Unified Directory Configuration Reference.
This section covers the following topics:
32.3.1.1.1 To List Existing Log Publishers
-
To view the existing log publishers run the following
dsconfigcommand:$ dsconfig -h localhost -p 4444 -D "cn=Directory Manager" -j pwd-file -X -n \ list-log-publishers
The default output will be similar to the following:
Log Publisher                  : Type              : enabled
-------------------------------:-------------------:--------
File-Based Access Logger       : file-based-access : true
File-Based Admin Access Logger : file-based-access : true
File-Based Audit Logger        : file-based-access : false
File-Based Debug Logger        : file-based-debug  : false
File-Based Error Logger        : file-based-error  : true
Oracle Access Logger           : file-based-access : false
Oracle Error Logger            : file-based-error  : false
Replication Repair Logger      : file-based-error  : true
-
To display the properties of a log publisher run the following
dsconfigcommand:$ dsconfig -h localhost -p 4444 -D "cn=Directory Manager" -j pwd-file -X -n \ get-log-publisher-prop --publisher-name "File-Based Error Logger"
32.3.1.1.2 To Enable a Log Publisher
Not all of the log publishers are enabled by default. If a log publisher is disabled, messages of that type are not logged.
To enable a log publisher, set its enabled property to true. For example, to enable the audit logger, run the following command:
$ dsconfig -h localhost -p 4444 -D "cn=Directory Manager" -j pwd-file -X -n \
  set-log-publisher-prop --publisher-name "File-Based Audit Logger" \
  --set enabled:true
When a log publisher is enabled, the server immediately starts logging messages to the appropriate publisher. You do not need to restart the server for this change to take effect.
32.3.1.1.3 To Delete a Log Publisher
To delete a log publisher, for example the File-Based Audit Logger run the following command:
$ dsconfig -h localhost -p 4444 -D "cn=Directory Manager" -j pwd-file -X -n \
delete-log-publisher --publisher-name "File-Based Audit Logger"
The logger is deleted successfully.
Note:
The audit logger is aFile-Based Access Log. Therefore, to create a File-Based Audit Logger, you must run the following dsconfig command using the advanced option in the interactive mode to set the Java class as org.opends.server.loggers.TextAuditLogPublisher.
$ dsconfig -X -j pwd-file --advanced
Alternatively, you can also create an audit logger using the non-interactive mode of the dsconfig command as follows:
dsconfig create-log-publisher \
          --set enabled:false \
          --set log-file:log/myauditlog \
          --set java-class:org.opends.server.loggers.TextAuditLogPublisher \
          --type file-based-access \
          --publisher-name myauditlog \
          --hostname localhost \
          --port 4444 \
          --trustAll \
          --bindDN cn=Directory Manager \
          --bindPasswordFile /tmp/password.txt \
          --no-prompt
32.3.1.1.4 Logging in ODL Format
Oracle Unified Directory also writes diagnostic log files in the Oracle Diagnostic Logging (ODL) format.
ODL is disabled by default. To enable ODL, set the enabled property of the ODL Access Log publisher or the ODL Error Log publisher to true. The following example enables the access logger:
$ dsconfig -h localhost -p 4444 -D "cn=Directory Manager" -j pwd-file -X -n \
  set-log-publisher-prop --publisher-name "Oracle Access Logger" \
  --set enabled:true
To enable the error logger, use --publisher-name "Oracle Error Logger".
ODL access logs are stored in the following file:
instance_dir/OUD/logs/access.log
ODL error logs are stored in the following directory:
instance_dir/OUD/logs/errors.log
Note that the standard access and error loggers are not disabled when you enable the ODL loggers. You should therefore disable the standard access and error logs after you enable the ODL loggers, unless you specifically want to maintain logs in both formats.
For more information about ODL, including an explanation of the log file format, see "Managing Log Files and Diagnostic Data" in the Oracle Fusion Middleware Administrator's Guide.
32.3.1.1.5 Logging Internal Operations
By default, the suppress-internal-logging property for log publishers is set to true. If you need to log internal operations (such as operations performed by the LDIF connection handler and certain plug-ins), set suppress-internal-logging to false. The following example sets suppress-internal-logging to false for the file-based access logger:
dsconfig set-log-publisher-prop \
--publisher-name File-Based\ Access\ Logger \
--add operations-to-log:internal \
--hostname localhost \
--port 4444 \
-X \
--bindDN cn=directory\ manager \
--bindPasswordFile /tmp/password \
--no-prompt
32.3.1.1.6 Configuring the Name of Rotated Log Files Using Local Time Stamp
By default, Oracle Unified Directory automatically renames (rotates) its local server log file using date stamp in GMT format.
You can change these default settings for log file rotation. You can configure a server instance to include a local time stamp in the file name of rotated log files.
To configure the log file names using local time stamp, you must set the log-file-use-local-time property of the appropriate log publisher to true. The following example describes how to set up the local time stamp in the file name of access rotated log files:
dsconfig -h localhost -p 4444 -D "cn=Directory Manager" -j pwd-file -X -n \
set-log-publisher-prop --publisher-name "File-Based Access Logger" \
--set log-file-use-local-time:true
Note:
The rotated log file name using local time stamp follows the format used by Oracle Directory Server Enterprise Edition to ensure compatibility.32.3.1.2 Configuring Log Retention Policies
Log retention policies dictate size and space limits for log files. Oracle Unified Directory provides the following three log retention policies:
-
File count retention (
file-count). By default, this policy sets the maximum number of log files to 10, for a specified type of log file. -
Free disk space retention (
free-disk-space). By default, this policy sets a minimum remaining free disk space limit to 500 Mb, for a specified type of log file. -
Size limit retention (
size-limit). By default, this policy sets the disk spaced used to a maximum of 500 Mb, for a specified type of log file.
By default, the log retention policy that is enabled is File count retention.
You can also create your own custom log retention policies.
32.3.1.2.1 To View the Log Retention Policies
To view a list of the existing log retention policies run the following dsconfig command:
$ dsconfig -h localhost -p 4444 -D "cn=Directory Manager" -j pwd-file -X -n \
  list-log-retention-policies
The default output will be similar to the following:
Log Retention Policy             : Type            : disk-space-used : free-disk-space : number-of-files
---------------------------------:-----------------:-----------------:-----------------:----------------
File Count Retention Policy      : file-count      : -               : -               : 10
Free Disk Space Retention Policy : free-disk-space : -               : 500 mb          : -
Size Limit Retention Policy      : size-limit      : 500 mb          : -               : -
To list the log retention policy properties run the following dsconfig command
$ dsconfig -h localhost -p 4444 -D "cn=Directory Manager" -j pwd-file -X -n \
  get-log-retention-policy-prop --policy-name "Free Disk Space Retention Policy"
32.3.1.2.2 To Create a Log Retention Policy
To create a log retention policy, and to set it as enabled, type:
$ dsconfig -h localhost -p 4444 -D "cn=Directory Manager" -w pwd-file -X -n
  create-log-retention-policy --policy-name MyMaxDiskSpace \
  --type size-limit --set disk-space-used:100mb
32.3.1.2.3 To Modify a Log Retention Policy
To modify the properties of an existing log retention policy run the following dsconfig command:
$ dsconfig -h localhost -p 4444 -D "cn=Directory Manager" -w pwd-file -X -n \
  set-log-retention-policy-prop --policy-name "File Count Retention Policy" \
  --set number-of-files:20
Instead of setting a property value, you can add, reset or remove a property value, using the --add, --reset, or --remove subcommands instead of the --set subcommand. For details, see Section A.2.4, "dsconfig".
32.3.1.3 Configuring Log Rotation Policies
Log rotation policies dictate how often the files are rotated, that is to say, how long log files are kept based on various criteria. Oracle Unified Directory provides the following four log rotation policies:
-
24 Hours time limit rotation policy. By default, this policy sets the rotation interval to one day. Time of day can be configured.
-
7 Days time limit rotation policy. By default, this policy sets the rotation interval to one week. Time of day can be configured.
-
Fixed time limit rotation policy. By default, this policy sets the time of day that log files are to be rotated, to one minute before midnight.
-
Size time limit rotation policy. By default, this policy sets a maximum size that log files can reach to 100 Mb, before the log file is rotated.
The type of log rotation policy enabled by default depends on the log type.
-
For access and audit logs, the following are enabled:
-
24 Hours time limit rotation policy
-
Size time limit rotation policy
-
-
For error and replication repair logs, the following are enabled:
-
7 Days time limit rotation policy
-
Size time limit rotation policy
-
You can create your own custom log rotation policies.
Note:
When multiple rotation policies are specified for the same log, the first threshold that is reached triggers the rotation.32.3.1.3.1 To View the Log Rotation Policies
To view a list of the existing log rotation policies run the following dsconfig command:
$ dsconfig -h localhost -p 4444 -D "cn=Directory Manager" -j pwd-file -X -n \
  list-log-rotation-policies
The default output will be similar to the following:
Log Rotation Policy                 : Type       : file-size-limit : rotation-interval : time-of-day
------------------------------------:------------:-----------------:-------------------:------------
24 Hours Time Limit Rotation Policy : time-limit : -               : 1 d               : -
7 Days Time Limit Rotation Policy   : time-limit : -               : 1 w               : -
Fixed Time Rotation Policy          : fixed-time : -               : -                 : 2359
Size Limit Rotation Policy          : size-limit : 100 mb          : -                 : -
To display the log rotation policy properties, run the following command:
$ dsconfig -h localhost -p 4444 -D "cn=Directory Manager" -j pwd-file -X -n \
  get-log-rotation-policy-prop "Fixed Time Rotation Policy"
32.3.1.3.2 To Create a Log Rotation Policy
To create a log rotation policy run the following dsconfig command:
$ dsconfig -h localhost -p 4444 -D "cn=Directory Manager" -j pwd-file -X -n \
  create-log-rotation-policy --policy-name my2DayPolicy \
  --type time-limit --set rotation-interval:2d
The policy type can be one of the following:
-
size-limit -
fixed-time -
time-limit
32.3.1.3.3 To Set Log Rotation or Retention for a Specific Log File
To set a rotation or retention policy on a specific log file, you must create a log publisher and set the log rotation or log retention policy.
To set log rotation or retention for a specific log file run the following dsconfig command:
$ dsconfig -h localhost -p 1444 -D "cn=Directoy manager" -j pwd-file -n -X \
  create-log-publisher --publisher-name myPublisher \
  --type file-based-access --set log-file:logs/myLogs --set enabled:true \
  --set retention-policy:MyMaxDiskSpace --set rotation-policy:my2DayPolicy
32.3.2 Configuring Logs by Using ODSM
This section describes how to use ODSM to configure logs. It contains the following topics:
32.3.2.1 Modify Logger Properties
Oracle Unified Directory provides several log publishers, or loggers, by default. Any number of loggers of any type can be defined and active at any time. This means that you can log to different locations or different types of repositories and that you can specify various sets of criteria for what to include in the logs.
You cannot create a new log publisher with ODSM, but you can modify the properties of an existing log publisher.
To configure logger properties by using ODSM, complete the following steps:
-
Connect to the directory server from ODSM, as described in Section 21.2, "Connecting to the Server From Oracle Directory Services Manager."
-
Select the Configuration tab.
-
Expand the General Configuration element.
-
Expand the Logging element.
-
Expand the Loggers element and click on the logger whose properties you want to modify.
The properties of the logger are displayed in the right hand pane. The configurable properties will depend on the type of logger that you have selected. For a comprehensive list of all configurable properties and their allowed values, see the Oracle Unified Directory Configuration Reference.
Oracle Unified Directory provides the following general configuration policies depending on the type of logger you have selected:
-
Enabled. It indicates whether the Log Publisher is enabled for use.
-
Log Publisher File Location. It specifies the file name to use for the log files generated by the File-Based Access Log Publisher. The path to the file is relative to the server root.
-
Log Publisher Permissions. It indicates the UNIX permissions of the log files created by this File-Based Access Log Publisher.
-
Operations to Log. It indicates which operations must be logged.
This property is only available for the access and audit log publishers.
-
Log Request and Response Controls. It indicates whether the request controls and response controls should be logged along with the operations that are requested by the client applications.
This property is only available for the access and audit log publishers.
-
Time Zone in Rotated Log File Names. It indicates whether the local time of the server or Greenwich Mean Time (GMT) should be used in the rotated log file names.
-
Default Severity. It specifies the default severity levels for the logger.
This property is only available for the error log publishers.
-
Default Debug Level. It specifies the lowest severity level of debug messages to log when none of the defined targets match the message.
This property is only available for the debug log publishers.
For a comprehensive list of all configurable properties and their allowed values for each logger, see the Oracle Unified Directory Configuration Reference.
Note:
You can configure the log rotation and log retention policies for the logger that you select in Step 5. For more information about configuring log rotation and log retention policies, see Section 32.3.2.2, "Modify Log Rotation Policies" and Section 32.3.2.3, "Modify Log Retention Policies." -
32.3.2.2 Modify Log Rotation Policies
Log rotation policies dictate how often log files are rotated, that is to say, how long log files are kept based on various criteria.
Oracle Unified Directory provides the following four log rotation policies:
-
24 Hours time limit rotation policy. By default, this policy sets the rotation interval to one day. Time of day can be configured.
-
7 Days time limit rotation policy. By default, this policy sets the rotation interval to one week. Time of day can be configured.
-
Fixed time limit rotation policy. By default, this policy sets the time of day that log files are to be rotated, to one minute before midnight.
-
Size time limit rotation policy. By default, this policy sets a maximum size that log files can reach to 100 Mb, before the log file is rotated.
The type of log rotation policy that is enabled by default depends on the logger type.
You can configure log rotation policies by using ODSM, as follows:
-
Connect to the directory server from ODSM, as described in Section 21.2, "Connecting to the Server From Oracle Directory Services Manager."
-
Select the Configuration tab.
-
Expand the General Configuration element.
-
Expand the Logging element.
-
Select the Rotation Policies element and modify the required properties.
You can also add a new rotation policy or delete an existing rotation policy by clicking the Add or Delete icons on this page, and completing the required information.
32.3.2.3 Modify Log Retention Policies
Log retention policies dictate size and space limits for log files. Oracle Unified Directory provides the following three log retention policies by default:
-
File count retention (file-count). By default, this policy sets the maximum number of log files to 10, for a specified type of log file.
-
Free disk space retention (free-disk-space). By default, this policy sets a minimum remaining free disk space limit to 500 Mb, for a specified type of log file.
-
Size limit retention (size-limit). By default, this policy sets the disk spaced used to a maximum of 500 Mb, for a specified type of log file. By default, the log retention policy enabled is File count retention.
You can configure log retention policies by using ODSM, as follows:
-
Connect to the directory server from ODSM, as described in Section 21.2, "Connecting to the Server From Oracle Directory Services Manager."
-
Select the Configuration tab.
-
Expand the General Configuration element.
-
Expand the Logging element.
-
Select the Retention Policies element and modify the required properties.
You can also add a new retention policy or delete an existing retention policy by clicking the Add or Delete icons on this page, and completing the required information.
32.3.3 Logging Operations to Access Log Publishers
Oracle Unified Directory provides a new parameter to specify the operations to log. This section describes the this new configuration parameter, and contain the following topics:
32.3.3.1 Overview of the Admin Logger
Oracle Unified Directory provides a mechanism for separating admin logs from user logs by means of Admin connector. Administration operations are now logged into a separate file that provides logging information associated with the administration traffic.
Note:
Oracle Unified Directory out-of-the-box supports a dedicated access logger, namelyFile-Based Admin Access Logger, which contains only operations of the administrator connector. Therefore, you don't have to perform any action specific action to log administration operations into a separate file.You can configure the access logs to specify the type of operation to log using operations-to-log property. This property is optional, and has the following configurable values:
-
SYNCHRONIZATION -
INTERNAL -
ADMINISTRATION -
USER -
ADMIN_BROWSING -
ALL
In that sense, Oracle Unified Directory supports the following operation types:
-
Synchronization Operations
Synchronization operations, such as locks, process synchronization, attribute mapping and transformation.
-
Internal Operations
Internal operations are internal, because they are initiated not by external requests from clients, but instead internally by plug-ins. You must use internal operation calls when the plug-in needs Directory Server to perform an operation for which no client request exists.
-
Administration Operations
Administration operations are performed on the admin network group, excluding operations associated with network group selection control.
-
User Operations
User operations are performed on any user network group, excluding operations associated with network group selection control.
-
Admin Browsing Operations
Admin browsing operations are associated with the network group selection control. This excludes operations associated with network group dependency.
Note:
Operations handled by network group that are created by a user and accessing admin suffixes is considered as User operations.32.3.3.2 Configuring Logged Operations in Access Log Publishers Using ODSM
ODSM groups the log publisher properties into three different headers, namely Logger General Properties, Rotation and Retention Properties, and Advanced Properties depending on the nature and behavior of the property. The Logger General Properties region is visible by default for all loggers and allows you to configure operations to log for file-based access loggers.
You can configure operations to log in Access Log Publishers using ODSM, as follows:
-
Connect to the directory server or directory proxy server from ODSM, as described in Section 21.2, "Connecting to the Server From Oracle Directory Services Manager."
-
Select the Configuration tab.
-
Expand the General Configuration element.
-
Expand the Logging element.
-
Expand the Loggers element.
-
Click the file-based access logger that you want to modify, for instance File-Based Admin Access Logger.
-
In the Logger General Properties region, perform the following step:
From the Operation to Log list, select the operations to log.
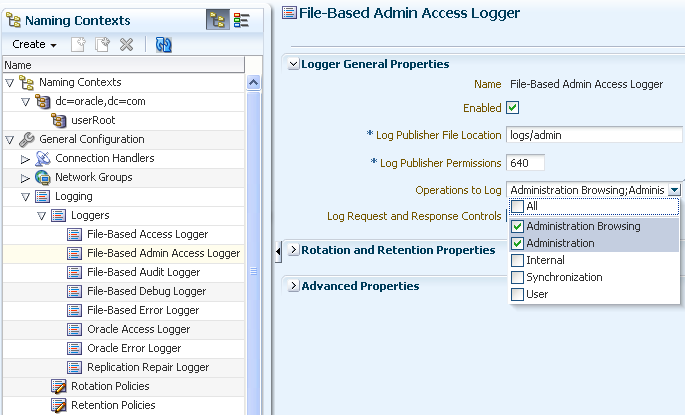
Description of the illustration ''file_based_admin_logger.png''
-
Click Apply.
32.4 Configuring Alerts and Account Status Notification Handlers
Oracle Unified Directory provides mechanisms for transmitting alert and account status notifications by means of JMX extensions or SMTP extensions. You can configure the directory server to send alert notifications when an event occurs during processing. Typical server events include server starts and shut downs, or problems that are detected by the server, such as an attempt to write to the configuration file.
You can also receive account status notifications when an event occurs during password policy processing, such as when accounts are locked out, accounts expire, passwords expire, and so on.
Alerts and account status notification handlers are configured by using the dsconfig command. For more information, see Section 17.1, "Managing the Server Configuration With dsconfig".
For additional information about the topics in this section, see Chapter 27, "Managing Password Policies" and "The Alert Handler Configuration" in the Oracle Unified Directory Configuration Reference.
This section contains the following topics:
32.4.1 Managing Alert Handlers
Oracle Unified Directory provides mechanisms for transmitting alert and account status notifications by means of JMX extensions or SMTP extensions.
You can configure Oracle Unified Directory to send alert notifications when an event occurs during processing. Typical server events include server starts and shut downs, or problems that are detected by the server, such as an attempt to write to the configuration file. You can also receive account status notifications when an event occurs during password policy processing, such as when accounts are locked out, accounts expire, passwords expire, and so on.
Oracle Unified Directory supports the following alert handlers:
-
JMX alert handler for JMX notifications
-
SMTP alert handler for email notifications.
The following topics describe how to manage the alert handler configuration:
32.4.1.1 Managing Alert Handlers by Using dsconfig
The following sections describe how to manage the alert handler configuration by using dsconfig. For information about configuring alerts by using the ODSM interface, see Section 32.4.1.2, "Managing Alert Handlers by Using ODSM".
This section contains the following topics:
32.4.1.1.1 To View the Configured Alert Handlers
Oracle Unified Directory stores alert handlers information in the configuration file under the cn=Alert Handlers,cn=config subtree. You can access the information using the dsconfig command.
To display a list of alert handlers, run the following dsconfig command:
$ dsconfig -h localhost -p 4444 -D "cn=directory manager" -j pwd-file -X -n \
 list-alert-handlers

Alert Handler     : Type : enabled
------------------:------:--------
JMX Alert Handler : jmx  : false
32.4.1.1.2 To Enable an Alert Handler
The JMX alert handler is disabled by default. Before you begin, you must configure JMX on the server. For more information, see Section 32.5.3, "Monitoring the Server With JConsole".
-
To list the alert handler's properties, use the
dsconfigcommand as follows.$ dsconfig -h localhost -p 4444 -D "cn=directory manager" -j pwd-file -X -n \ get-alert-handler-prop --handler-name "JMX Alert Handler" Property : Value(s) --------------------:--------------------------------------------- disabled-alert-type : - enabled : false enabled-alert-type : -
-
To enable the alert handler, use
dsconfigas follows.$ dsconfig -h localhost -p 4444 -D "cn=directory manager" -j pwd-file -X -n \ set-alert-handler-prop --handler-name "JMX Alert Handler" --set enabled:true
-
Verify the change by using
dsconfig.$ dsconfig -h localhost -p 4444 -D "cn=directory manager" -j pwd-file -X -n \ get-alert-handler-prop --handler-name "JMX Alert Handler" Property : Value(s) --------------------:--------------------------------------------- disabled-alert-type : - enabled : true enabled-alert-type : -
32.4.1.1.3 To Create a New Alert Handler
The following example configures a new SMTP handler. Before starting this procedure, you must have configured an SMTP server for Oracle Unified Directory.
-
To create an alert handler run
dsconfigwith thecreate-alert-handlersubcommand.$ dsconfig -h localhost -p 4444 -D "cn=directory manager" -j pwd-file -X -n \ create-alert-handler --handler-name "my SMTP Handler" --type smtp \ --set enabled:true --set message-body:"Alert Type: %%alert-type%% \n\nAlert ID: %%alert-id%%\n\nAlert Message: %%alert-message%%" \ --set message-subject:"Alert Message" \ --set recipient-address:directorymanager@example.com \ --set sender-address:OUD-Alerts@directory.example.com
-
View the list of alert handlers as follows.
$ dsconfig -h localhost -p 4444 -D "cn=directory manager" -j pwd-file -X -n \
  list-alert-handlers
32.4.1.1.4 To Delete an Alert Handler
To delete an alert handler, use the dsconfig delete-alert-handler command. The following example removes the JMX alert handler.
$ dsconfig -h localhost -p 4444 -D "cn=directory manager" -j pwd-file -X -n \
  delete-alert-handler --handler-name "JMX Alert Handler"
You can simply disable an alert handler instead of deleting it. In this case, the alert handler is available if you need to enable it again in the future. For more information, see Section 32.4.1.1.5, "To Control the Allowed Alert Types".
32.4.1.1.5 To Control the Allowed Alert Types
For a list of all supported alert types, see Section 32.4.1.3, "Supported Alert Types".
By default, all the supported alert types are allowed. If you specify a value for the enabled-alert-type property, only alerts with one of those types are allowed. If you specify a value for the disabled-alert-type property, all alert types except for the values in that property are allowed. Alert types are specified by their Java class, as shown in this example.
To disable an alert type, specify its Java class as a value of the disabled-alert-type property.
This command disables the startup alert from the JMX Alert Handler.
$ dsconfig -h localhost -p 4444 -D "cn=directory manager" -j pwd-file -X -n \
  set-alert-handler-prop --handler-name "JMX Alert Handler" \
  --set disabled-alert-type:org.opends.server.DirectoryServerStarted
32.4.1.2 Managing Alert Handlers by Using ODSM
The following sections describe how to manage the alert handler configuration by using ODSM. For information about configuring alert handlers by using dsconfig, see Section 32.4.1.1, "Managing Alert Handlers by Using dsconfig".
32.4.1.2.1 Create an Alert Handler
To create an alert handler by using ODSM, follow these steps:
-
Connect to the directory server from ODSM, as described in Section 21.2, "Connecting to the Server From Oracle Directory Services Manager."
-
Select the Configuration tab.
-
From the Create menu, select Alert Handler.
-
Select the type of alert handler that you want to create:
-
JMX. This alert handler is used to generate JMX notifications to alert administrators of significant events that occur within the server.
-
SMTP. This alert handler is used to send e-mail messages to notify administrators of significant events that occur within the server.
-
-
Enter the properties to configure the connection handler in the right hand pane.
The configurable properties will depend on the type of alert handler that you have selected. For a comprehensive list of all configurable properties, and their allowed values, see "The Alert Handler Configuration" in the Oracle Unified Directory Configuration Reference.
-
Note:
By default, all alert types are allowed. If you specify one or more values in the Enabled Alert Type field, only alerts with one of those types are allowed. If you specify one or more values in the Disabled Alert Type field, all alert types except for the values in that field are allowed.For a list of all supported alert types, see Section 32.4.1.3, "Supported Alert Types".
-
When you have configured the required properties for your specific alert handler type, click Create.
32.4.1.2.2 Modify an Alert Handler
You can use ODSM to modify an existing alert handler, as follows:
-
Connect to the directory server from ODSM, as described in Section 21.2, "Connecting to the Server From Oracle Directory Services Manager."
-
Select the Configuration tab.
-
Expand the General Configuration element.
-
Expand the Alert Handlers element.
-
Select the alert handler whose properties you want to modify.
-
The properties are display in the right hand pane.
-
When you have modified the required properties, click Apply.
32.4.1.2.3 Delete an Alert Handler
You can use ODSM to modify an existing alert handler, as follows:
-
Connect to the directory server from ODSM, as described in Section 21.2, "Connecting to the Server From Oracle Directory Services Manager."
-
Select the Configuration tab.
-
Expand the General Configuration element.
-
Expand the Alert Handlers element.
-
Select the alert handler that you want to delete and click the Delete configuration icon.
-
You are prompted to confirm the deletion. Click Yes.
32.4.1.3 Supported Alert Types
The server sends out message alerts when an alert type event occurs in the system. The supported alert types are defined in the following table.
| Alert Type | Description |
|---|---|
| Access Control Disabled
Java Class: |
Notify administrator that the access control handler has been disabled. |
| Access Control Enabled
Java Class: |
Notify administrator that the access control handler has been enabled. |
| Access Control Parse Failed
Java Class: |
Notify administrator if the Oracle Directory Server Enterprise Edition compatible access control subsystem failed to correctly parse one or more ACI rules when the server is first started. |
| Access Control Modified
Java Class: |
Notify administrator if the Oracle Directory Server Enterprise Edition compatible access control subsystem detected that one or more ACI rules have been modified. |
| Backend Environment Unusable
Java Class: |
Notify administrator that the JE back end throws a RunRecoveryException and the directory server needs to be restarted. |
| Cannot Copy Schema Files
Java Class: |
Notify administrator if a problem occurs while attempting to create copies of the existing schema configuration before making a schema update, and the schema configuration is left in a potentially inconsistent state. |
| Cannot Find Recurring Task
Java Class: |
Notify administrator if the directory server is unable to locate a recurring task definition in order to schedule the next iteration once the previous iteration has completed. |
| Cannot Rename Current Task File
Java Class: |
Notify administrator if the directory server is unable to rename the current tasks backing file in the process of trying to write an updated version. |
| Cannot Rename New Task File
Java Class: |
Notify administrator if the directory server is unable to rename the new tasks backing file into place. |
| Cannot Schedule Recurring Iteration
Java Class: |
Notify administrator if the directory server is unable to schedule an iteration of a recurring task. |
| Cannot Write Configuration
Java Class: |
Notify administrator if the directory server is unable to write its updated configuration for some reason and so the server cannot exhibit the new configuration if it is restarted. |
| Cannot Write New Schema Files
Java Class: |
Notify administrator if a problem occurs while attempting to write new versions of the server schema configuration files, and the schema configuration is left in a potentially inconsistent state. |
| Cannot Write Task File
Java Class: |
Notify administrator if the directory server is unable to write an updated tasks backing file for some reason. |
| Distribution Backend Does Not Support PreRead Control
Java Class: |
Notify administrators if the distribution is unable to maintain the content of the global index catalog. This will happen \ if one or more servers do not support the Pre-Read Entry Control (RFC 4527) |
| Entering Lockdown Mode
Java Class: |
Notify administrator that the directory server is entering lockdown mode, in which only root users will be allowed to perform operations and only over the loopback address. |
| LDAP Connection Handler Consecutive Failures
Java Class: |
Notify administrator of consecutive failures that have occurred in the LDAP connection handler that have caused it to become disabled. |
| LDAP Connection Handler Uncaught Error
Java Class: |
Notify administrator of uncaught errors in the LDAP connection handler that have caused it to become disabled. |
| LDAP Server Extension Failed
Java Class: |
Notify administrator that the LDAP Server Extension has been detected as Down. |
| LDAP Server Extension is Up
Java Class: |
Notify administrator that the LDAP Server Extension has been detected as UP. |
| LDIF Backend Cannot Write Update
Java Class: |
Notify administrator that an LDIF back end was unable to store an updated copy of the LDIF file after processing a write operation. |
| LDIF ConnHandler Parse Error
Java Class: |
Notify administrator that the LDIF connection handler encountered an unrecoverable error while attempting to parse an LDIF file. |
| LDIF ConnHandler IO Error
Java Class: |
Notify administrator that the LDIF connection handler encountered an I/O error that prevented it from completing its processing. |
| Leaving Lockdown Mode
Java Class: |
Notify administrator that the directory server is leaving lockdown mode. |
| Manual Config Edit Handled
Java Class: |
Notify administrator if the directory server detects that its configuration has been manually edited with the server online and those changes were overwritten by another change made through the server. The manually-edited configuration will be copied off to another location. |
| Manual Config Edit Lost
Java Class: |
Notify administrator if the directory server detects that its configuration has been manually edited with the server online and those changes were overwritten by another change made through the server. The manually-edited configuration could not be preserved due to an unexpected error. |
| New route elected by the SaturationLoadBalancingAlgorithm
Java Class: |
Notify administrator that a new route has been elected as active route by the saturation load balancing algorithm. |
| New route elected by the FailoverLoadBalancingAlgorithm
Java Class: |
Notify administrator that a new route has been elected as the active route by the failover load balancing algorithm. |
| Replication Unresolved Conflict
Java Class: |
Notify administrator if the multimaster replication cannot automatically resolve a conflict. |
| Server Started
Java Class: |
Notify administrator that the directory server has completed its startup process. |
| Server Shutdown
Java Class: |
Notify administrator that the directory server has begun the process of shutting down. |
| State change for a Saturation Load Balancing Route
Java Class: |
Notify administrator that the saturation load balancing route state has changed (either from saturated to not saturated or from not saturated to saturated). |
| Uncaught Exception
Java Class: |
Notify administrator if a directory server thread has encountered an uncaught exception that caused the thread to terminate abnormally. The impact that this problem has on the directory server depends on which thread was impacted and the nature of the exception. |
| Unique Attr Sync Conflict
Java Class: |
Notify administrator that a unique attribute conflict has been detected during synchronization processing. |
| Unique Attr Sync Error
Java Class: |
Notify administrator that an error occurred while attempting to perform unique attribute conflict detection during synchronization processing. |
| Unsupported Directory Backend
Java Class: |
Notify administrator that the distribution is unable to maintain the content of the global index catalog. This will happen if one or more servers do not support the Pre-Read Entry Control (RFC 4527). |
32.4.2 Managing Account Status Notification Handlers
Account status notification handlers provide alerts on events during password policy processing. By default, the Error Log Account Status Notification handler is set to enabled upon initial configuration. The server writes a message to the server error log when one of the following events has been configured in the password policy and occurs during the course of password policy processing:
-
account-temporarily-locked -
account-permanently-locked -
account-unlocked -
account-idle-locked -
account-reset-locked -
account-disabled -
account-expired -
password-expired -
password expiring -
password-reset -
password-changed
The error log is located at instance-dir/OUD/logs/errors.
32.4.2.1 To View the Configured Account Status Notification Handlers
Use dsconfig with the list-account-status-notification-handlers subcommand.
$ dsconfig -h localhost -p 4444 -D "cn=directory manager" -j pwd-file -X -n \
  list-account-status-notification-handlers

Account Status Notification Handler : Type      : enabled
------------------------------------:-----------:--------
Error Log Handler                   : error-log : true
SMTP Handler                        : smtp      : false
32.4.2.2 To Enable Account Status Notification Handlers
You can enable an existing account status notification handler using the dsconfig command. By default, the directory server enables the Error Log Handler when the server is initially configured. This example enables the SMTP notification handler.
-
To view the
enabledproperty usedsconfigwith theget-account-status-notification-handler-propsubcommand.$ dsconfig -h localhost -p 4444 -D "cn=directory manager" -j pwd-file -X -n \ get-account-status-notification-handler-prop --handler-name "SMTP Handler" \ --property enabled Property : Value(s) ---------:--------- enabled : false
-
To enable the notification handler use
dsconfigwith theset-account-status-notification-handler-propsubcommand.$ dsconfig -h localhost -p 4444 -D "cn=directory manager" -j pwd-file -X -n \ set-account-status-notification-handler-prop --handler-name "SMTP Handler" \ --set property:enabled
32.4.2.3 To Create a New Account Status Notification Handler
-
Use
dsconfigwith thecreate-account-status-notification-handlersubcommand to create the handler.When you specify the type, you can use either
error-logorgeneric(default).$ dsconfig -h localhost -p 4444 -D "cn=directory manager" -j pwd-file -X -n \ create-account-status-notification-handler \ --handler-name "My Password Reset Logger" --type error-log \ --set enabled:true --set account-status-notification-type:password-reset
-
Use
dsconfigto view the list of account status notification handlers.$ dsconfig -h localhost -p 4444 -D "cn=directory manager" -j pwd-file -X -n \ list-account-status-notification-handlers Account Status Notification Handler : Type : enabled ------------------------------------:-----------:-------- Error Log Handler : error-log : true my Password Reset Logger : error-log : true SMTP Handler : smtp : false
32.4.2.4 To Delete an Account Status Notification Handler
You can disable an account status notification handler instead of deleting it. In this case, the alert handler is available if you need to enable it again in the future.
You can remove an account status notification handler entirely by using dsconfig.
Use dsconfig with the delete-account-status-notification-handler subcommand.
$ dsconfig -h localhost -p 4444 -D "cn=directory manager" -j pwd-file -X -n \
  delete-account-status-notification-handler \
  --handler-name "My Password Reset Logger"
32.5 Monitoring the Server With LDAP
Oracle Unified Directory provides a variety of methods to monitor the current state of the server for debugging or troubleshooting purposes.
The topics in this section assume that you have configured monitoring providers on the server. For more information, see Section 32.2, "Configuring Monitor Providers".
You can monitor the server over LDAP in several ways. These are described in the following sections:
32.5.1 Viewing Monitoring Information Using the cn=monitor Entry
The directory server records system, performance, and version information as an entry with the base DN of cn=monitor. This entry provides useful performance metrics and server state information that you can use to monitor and debug a directory server instance.
You can access the cn=monitor suffix over the administration port only. There are advantages to using the administration port to access monitoring information. The main advantage of the administration connector is the separation of user traffic and administration traffic.
For example, if you monitor the number of connections on the LDAP Connection Handler ("cn=Client Connections,cn=LDAP Connection Handler 0.0.0.0 port port-number,cn=monitor") over the regular LDAP port, your monitoring data are "polluted" by the monitoring request itself. All of the examples in this section use the administration port, over SSL. For more information, see Section 17.3, "Managing Administration Traffic to the Server".
This section includes the following topics:
-
Section 32.5.1.2, "To View the Available Monitoring Information"
-
Section 32.5.1.3, "To Monitor General-Purpose Server Information"
-
Section 32.5.1.15, "To Monitor LDAP Connection Handler Statistics"
-
Section 32.5.1.16, "To Monitor Connections on the LDAP Connection Handler"
-
Section 32.5.1.17, "To Monitor the Administration Connector"
-
Section 32.5.1.18, "To Monitor Administration Connector Statistics"
-
Section 32.5.1.19, "To Monitor Connections on the Administration Connector"
-
Section 32.5.1.24, "To Monitor the
userRootDatabase Environment"
32.5.1.1 Monitored Attributes in the Proxy
Monitoring information related to the proxy can be collected at the level under cn=Monitor for dozens of attributes, including those relating to the following:
-
Workflows:
cn=workflow,cn=monitor -
Network Groups:
cn=Network Groups,cn=monitor -
Load balancers:
cn=load balancing,cn=monitor -
Distributions:
cn=distribution,cn=monitor -
Global Index Catalogs:
cn=Global Index Catalogs,cn=monitor -
Client Connections:
cn=Client Connections,cn=monitoror undercn=Client Connections,cn=LDAP Connection Handler0.0.0.0portport number,cn=monitor -
LDAP Connection Handler:
cn=LDAP Connection Handler0.0.0.0portport number,cn=monitor -
LDAP Connection Handler Statistics:
cn=LDAP Connection Handler0.0.0.0portport numberstatistics,cn=monitor -
SNMP Connection Handler:
cn=SNMP Connection Handler,cn=Monitor -
JMX Connection Handler:
cn=JMX Connection Handlerport number,cn=monitor -
Administration Connector:
cn=Administration Connector0.0.0.0portport number,cn=monitor -
System Information:
cn=System Information,cn=monitor -
Version:
cn=Version,cn=monitor -
Back-end LDAP servers:
cn=LDAP Servers,cn=monitor -
JVM stack traces:
cn=JVM Stack Trace,cn=monitor -
JVM memory usage:
cn=JVM Memory Usage,cn=Monitor -
SNMP:
cn=SNMP,cn=Monitor -
Backend Backup:
cn=backup Backend,cn=monitor -
Monitoring of back-end data:
cn=monitor Backend,cn=monitor -
Tasks on the Backend Backup:
cn=backup Backend,cn=monitor -
Entry caches:
cn=Entry Caches,cn=monitor -
Work queues:
cn=Work Queue,cn=monitor
Other attributes are monitored under each of the above in the dn tree. For example, client connections are monitored under both cn=Client Connections, 0.0.0.0 port port number,cn=monitor and under cn=Client Connections,cn=Administration Connector 0.0.0.0 port port number, cn=monitor.
A workflow element is monitored under the part of the tree to which that workflow element relates. For example, a load balancing workflow element can be monitored as cn=load-bal-route1,cn=load balancing,cn=monitor
Hundreds of statistics are collected by the proxy for monitoring. For example, for the persistent search function, psearchCount lists the number of persistent search operations and psearchTotalCount lists the number of persistent search operations since the last server restart.
You can list all of these statistics by using the ldapsearch command on the cn=monitor entry, as described in Section 32.5.1.2, "To View the Available Monitoring Information". Note that access to the cn=monitor entry is restricted to users who have the bypass ACI privilege.
The following procedures use the ldapsearch command at the command line interface.
To view status information on the replication of global indexes, you can use the gicadm status-replication command. For more information, see Section 18.1.8.2.5, "To View the Status of a Replicated Global Index Catalog Configuration".
32.5.1.2 To View the Available Monitoring Information
Use the ldapsearch command to inspect the attributes of cn=monitor. This example lists the base DNs of each monitor entry.
Run the ldapsearch command with a search scope of sub and the search attribute 1.1.
This search attribute indicates that no attributes should be included in the matching entries.
$ ldapsearch -h localhost -p 4444 -D "cn=directory manager" -j pwd-file --useSSL \
  --trustAll -s sub -b "cn=monitor" "(objectclass=*)" "1.1"
dn: cn=monitor
dn: cn=Client Connections,cn=monitor
dn: cn=ads-truststore Backend,cn=monitor
dn: cn=Network Groups,cn=monitor
dn: cn=internal,cn=Network Groups,cn=monitor
dn: cn=default,cn=Network Groups,cn=monitor
dn: cn=LDAP Connection Handler 0.0.0.0 port 1389 Statistics,cn=monitor
dn: cn=Administration Connector 0.0.0.0 port 4444,cn=monitor
dn: cn=Client Connections,cn=Administration Connector 0.0.0.0 port 4444,cn=monitor
dn: cn=backup Backend,cn=monitor
dn: cn=Version,cn=monitor
dn: cn=Work Queue,cn=monitor
dn: cn=System Information,cn=monitor
dn: cn=userRoot Database Environment,cn=monitor
dn: cn=tasks Backend,cn=monitor
dn: cn=adminRoot Backend,cn=monitor
dn: cn=userRoot Backend,cn=monitor
dn: cn=schema Backend,cn=monitor
dn: cn=LDAP Connection Handler 0.0.0.0 port 1389,cn=monitor
dn: cn=admin,cn=Network Groups,cn=monitor
dn: cn=Client Connections,cn=LDAP Connection Handler 0.0.0.0 port 1389,cn=monitor
dn: cn=JVM Memory Usage,cn=monitor
dn: cn=Administration Connector 0.0.0.0 port 4444 Statistics,cn=monitor
dn: cn=JVM Stack Trace,cn=monitor
dn: cn=Entry Caches,cn=monitor
dn: cn=monitor Backend,cn=monitor
32.5.1.3 To Monitor General-Purpose Server Information
Use the ldapsearch command with a base DN of "cn=monitor".
$ ldapsearch -h localhost -p 4444 -D "cn=directory manager" -j pwd-file --useSSL \
  --trustAll -s base -b "cn=monitor" "(objectclass=*)"
Output will be similar to the following:
dn: cn=monitorstartTime: 20120110110156ZobjectClass: extensibleObjectobjectClass: topobjectClass: ds-monitor-entrycn: monitorvendorName: Oracle CorporationcurrentTime: 20120111082026ZvendorVersion: Oracle Unified Directory 11.1.2.0maxConnections: 1productName: Oracle Unified DirectorycurrentConnections: 1totalConnections: 8upTime: 57 days 21 hours 18 minutes 30 seconds
32.5.1.4 To Monitor System Information
Use the ldapsearch command with the base DN "cn=System Information,cn=monitor".
$ ldapsearch -h localhost -p 4444 -D "cn=directory manager" -j pwd-file --useSSL \
  --trustAll -s base -b "cn=System Information,cn=monitor" "(objectclass=*)"
Depending on your configuration, output will be similar to the following:
dn: cn=System Information,cn=monitor
instancePath: /export/home/oracle/OUD/asinst_1/OUD
javaVersion: 1.6.0_20
jvmArchitecture: 64-bit
jvmArguments: "-Dorg.opends.server.scriptName=start-ds"
jvmVersion: 19.0-b09
classPath: /export/home/oracle/OUD/asinst_1/OUD/classes:/export/home/oracle/OUD/
OracleUnifiedDirectory/winlib/classpath.jar:/export/home/oracle/OUD/asinst_1/OU
 D/lib/*.jar
usedMemory: 69402624
freeUsedMemory: 23084640
objectClass: extensibleObject
objectClass: top
objectClass: ds-monitor-entry
javaVendor: Sun Microsystems Inc.
operatingSystem: Linux 2.6.32-200.13.1.el5uek amd64
cn: System Information
systemName: sboy
installPath: /export/home/oracle/OUD/OracleUnifiedDirectory
workingDirectory: /export/home/oracle/OUD/asinst_1/OUD/bin
availableCPUs: 2
maxMemory: 922746880
javaHome: /usr/lib/jvm/java-1.6.0-openjdk-1.6.0.0.x86_64/jre
jvmVendor: Sun Microsystems Inc.
32.5.1.5 To Monitor Version Information
Use the ldapsearch command with base DN "cn=Version,cn=monitor".
$ ldapsearch -h localhost -p 4444 -D "cn=directory manager" -j pwd-file --useSSL \
  --trustAll -b "cn=Version,cn=Monitor" "(objectclass=*)"
The output will be similar to the following:
shortName: OUD
componentVersion: 2
buildID: 20130930154356Z
maintenanceVersion: 1
objectClass: top
objectClass: ds-monitor-entry
objectClass: extensibleObject
labelIdentifier: 1309300606
cn: Version
compactVersion: OUD-11.1.2.2.0
platformVersion: 0
majorVersion: 11
productName: Oracle Unified Directory
releaseVersion: 2
fullVersion: Oracle Unified Directory 11.1.2.2.0
32.5.1.6 To Monitor the User Root Back End
The userRoot back end is the back-end database (the JE environment) for your data. The monitor displays the back end's general properties, such as writability mode, base DN, back-end IDs, entry count, and other properties.
Use the ldapsearch command with base DN "cn=userRoot Backend,cn=monitor".
$ ldapsearch -h localhost -p 4444 -D "cn=directory manager" -j pwd-file \
--useSSL --trustAll -s base -b "cn=userRoot Backend,cn=monitor" "(objectclass=*)"
Depending on your configuration, output will be similar to the following:
dn: cn=userRoot Backend,cn=monitor
objectClass: top
objectClass: ds-monitor-entry
objectClass: ds-backend-monitor-entry
ds-backend-is-private: FALSE
cn: userRoot Backend
ds-backend-writability-mode: enabled
ds-backend-entry-count: 2002
ds-backend-id: userRoot
ds-base-dn-entry-count: 2002 dc=example,dc=com
ds-backend-base-dn: dc=example,dc=com
32.5.1.7 To Monitor the Backup Back End
Use the ldapsearch command with base DN "cn=backup Backend,cn=monitor".
$ ldapsearch -h localhost -p 4444 -D "cn=directory manager" -j pwd-file
--useSSL --trustAll -s base -b "cn=backup Backend,cn=monitor" "(objectclass=*)" \
Depending on your configuration, output will be similar to the following:
dn: cn=backup Backend,cn=monitor
objectClass: top
objectClass: ds-monitor-entry
objectClass: ds-backend-monitor-entry
ds-backend-is-private: TRUE
cn: backup Backend
ds-backend-writability-mode: disabled
ds-backend-entry-count: 1
ds-backend-id: backup
ds-base-dn-entry-count: 1 cn=backups
ds-backend-base-dn: cn=backups
32.5.1.8 To Monitor the Tasks Back End
Tasks are administrative functions (such as import-ldif, export-ldif, backup, and restore) that can be scheduled for processing at some future date or on a recurring basis. The monitor displays the tasks back end's general properties, such as writability mode, base DN, back-end IDs, entry count, and other properties.
Use the ldapsearch command with base DN "cn=Tasks Backend,cn=monitor".
$ ldapsearch -h localhost -p 4444 -D "cn=directory manager" -j pwd-file --useSSL \
  --trustAll -s base -b "cn=Tasks Backend,cn=monitor" "(objectclass=*)"
Depending on your configuration, output will be similar to the following:
dn: cn=tasks Backend,cn=monitor
objectClass: top
objectClass: ds-monitor-entry
objectClass: ds-backend-monitor-entry
ds-backend-is-private: TRUE
cn: tasks Backend
ds-backend-writability-mode: enabled
ds-backend-entry-count: 3
ds-backend-id: tasks
ds-base-dn-entry-count: 3 cn=tasks
ds-backend-base-dn: cn=tasks
32.5.1.9 To Monitor the monitor Back End
This monitor displays the back end's general properties, such as writability mode, base DN, back-end IDs, entry count, and other properties.
Use the ldapsearch command with base DN "cn=monitor Backend,cn=monitor".
$ ldapsearch -h localhost -p 4444 -D "cn=directory manager" -j pwd-file --useSSL \
  --trustAll -s base -b "cn=monitor Backend,cn=monitor" "(objectclass=*)"
Depending on your configuration, output will be similar to the following:
dn: cn=monitor Backend,cn=monitor
objectClass: top
objectClass: ds-monitor-entry
objectClass: ds-backend-monitor-entry
ds-backend-is-private: TRUE
cn: monitor Backend
ds-backend-writability-mode: disabled
ds-backend-entry-count: 25
ds-backend-id: monitor
ds-base-dn-entry-count: 25 cn=monitor
ds-backend-base-dn: cn=monitor
32.5.1.10 To Monitor the Schema Back End
This monitor displays the schema back end's general properties, such as writability mode, base DN, back-end IDs, entry count, and other properties.
Use the ldapsearch command with base DN "cn=schema Backend,cn=monitor".
$ ldapsearch -h localhost -p 4444 -D "cn=directory manager" -j pwd-file --useSSL \
  --trustAll -s base -b "cn=schema Backend,cn=monitor" "(objectclass=*)"
Depending on your configuration, output will be similar to the following:
dn: cn=schema Backend,cn=monitor
objectClass: top
objectClass: ds-monitor-entry
objectClass: ds-backend-monitor-entry
ds-backend-is-private: TRUE
cn: schema Backend
ds-backend-writability-mode: enabled
ds-backend-entry-count: 1
ds-backend-id: schema
ds-base-dn-entry-count: 1 cn=schema
ds-backend-base-dn: cn=schema
32.5.1.11 To Monitor the adminRoot Back End
This monitor displays the adminRoot back end's general properties, such as writability mode, base DN, back-end IDs, entry count, and other properties.
Use the ldapsearch command with base DN "cn=adminRoot Backend,cn=monitor".
$ ldapsearch -h localhost -p 4444 -D "cn=directory manager" -j pwd-file --useSSL \
  --trustAll -s base -b "cn=adminRoot Backend,cn=monitor" "(objectclass=*)"
Depending on your configuration, output will be similar to the following:
dn: cn=adminRoot Backend,cn=monitor
objectClass: top
objectClass: ds-monitor-entry
objectClass: ds-backend-monitor-entry
ds-backend-is-private: TRUE
cn: adminRoot Backend
ds-backend-writability-mode: enabled
ds-backend-entry-count: 7
ds-backend-id: adminRoot
ds-base-dn-entry-count: 7 cn=admin data
ds-backend-base-dn: cn=admin data
32.5.1.12 To Monitor the ads-truststore Back End
The ads-truststore holds a mirror, or copy, of the remote Administrative Directory Service (ADS) host's ADS key entry, so that the new instance can establish trust with existing servers in the ADS domain. The monitor displays the back end's general properties, such as writability mode, base DN, back-end IDs, entry count, and other properties.
Use the ldapsearch command with base DN "cn=ads-truststore Backend,cn=monitor".
$ ldapsearch -h localhost -p 4444 -D "cn=directory manager" -j pwd-file --useSSL \
  --trustAll -s base -b "cn=ads-truststore Backend,cn=monitor" "(objectclass=*)"
Depending on your configuration, output will be similar to the following:
dn: cn=ads-truststore Backend,cn=monitor
objectClass: top
objectClass: ds-monitor-entry
objectClass: ds-backend-monitor-entry
ds-backend-is-private: TRUE
cn: ads-truststore Backend
ds-backend-writability-mode: enabled
ds-backend-entry-count: 3
ds-backend-id: ads-truststore
ds-base-dn-entry-count: 3 cn=ads-truststore
ds-backend-base-dn: cn=ads-truststore
32.5.1.13 To Monitor Client Connections
This monitor represents all of the open client connections. Its contents are different to those of the DN "cn=Client Connections,cn=LDAP Connection Handler 0.0.0.0 port 1389,cn=monitor", which describes the open client connections on the LDAP connection handler only.
Use the ldapsearch command with base DN "cn=Client Connections,cn=monitor".
$ ldapsearch -h localhost -p 4444 -D "cn=directory manager" -j pwd-file --useSSL \
  --trustAll -s base -b "cn=Client Connections,cn=monitor" "(objectclass=*)"
Depending on your configuration, output will be similar to the following:
dn: cn=Client Connections,cn=monitor
connection: connID="11" connectTime="20090702125632Z" source="198.51.100.0:54044"
destination="198.51.100.23:1389" ldapVersion="3" authDN="cn=Directory Manager,cn=Root DNs,
cn=config" security="none" opsInProgress="1"
cn: Client Connections
objectClass: extensibleObject
objectClass: top
objectClass: ds-monitor-entry
32.5.1.14 To Monitor the LDAP Connection Handler
The LDAP connection handler is used to interact with clients over LDAP.
Use the ldapsearch command with base DN "cn=LDAP Connection Handler 0.0.0.0 port port-number,cn=monitor".
$ ldapsearch -h localhost -p 4444 -D "cn=directory manager" -j pwd-file --useSSL \
  --trustAll -s base \
  -b "cn=LDAP Connection Handler 0.0.0.0 port 1389,cn=monitor" \
  "(objectclass=*)"
Depending on your configuration, output will be similar to the following:
dn: cn=LDAP Connection Handler 0.0.0.0 port 1389,cn=monitor
ds-connectionhandler-listener: 0.0.0.0:1389
ds-connectionhandler-num-connections: 1
ds-connectionhandler-protocol: LDAP
objectClass: top
objectClass: ds-monitor-entry
objectClass: ds-connectionhandler-monitor-entry
ds-mon-config-dn: cn=ldap connection handler,cn=connection handlers,cn=config
cn: LDAP Connection Handler 0.0.0.0 port 1389
ds-connectionhandler-connection: connID="22" connectTime="20120302133936Z"
source="198.51.100.0:39574" destination="198.51.100.23:1389" ldapVersion="3"
authDN="cn=Directory Manager,cn=Root DNs,cn=config" security="none" opsInProgress="1"
32.5.1.15 To Monitor LDAP Connection Handler Statistics
Use the ldapsearch command with base DN "cn=LDAP Connection Handler 0.0.0.0 port port-number Statistics,cn=monitor".
$ ldapsearch -h localhost -p 4444 -D "cn=directory manager" -j pwd-file --useSSL \
  --trustAll -s base \
  -b "cn=LDAP Connection Handler 0.0.0.0 port 1389 Statistics,cn=monitor" \
  "(objectclass=*)"
Depending on your configuration, output will be similar to the following:
dn: cn=LDAP Connection Handler 0.0.0.0 port 1389 Statistics,cn=monitor
objectClass: ds-monitor-entry
objectClass: top
objectClass: extensibleObject
operationsCompleted: 37
compareRequests: 0
bytesWritten: 99488
extendedRequests: 0
addRequests: 0
bindRequests: 19
...(more output)
32.5.1.16 To Monitor Connections on the LDAP Connection Handler
This monitor represents the open client connections on the LDAP connection handler.
Use the ldapsearch command with base DN "cn=Client Connections,cn=LDAP Connection Handler 0.0.0.0 port port-number,cn=monitor".
$ ldapsearch -h localhost -p 4444 -D "cn=directory manager" -j pwd-file \
--useSSL --trustAll \
-b "cn=Client Connections,cn=LDAP Connection Handler 0.0.0.0 port 1389 \
cn=monitor" \
"(objectclass=*)"
Depending on your configuration, output will be similar to the following:
dn: cn=Client Connections,cn=LDAP Connection Handler 0.0.0.0 port 1389,cn=monitor
connection: connID="0" connectTime="20090706084747Z" source="198.51.100.0:57523" destination="198.51.100.0:1389" ldapVersion="3" authDN="" security="none" opsInProgress="0"
connection: connID="1" connectTime="20090706084747Z" source="198.51.100.0:57524" destination="198.51.100.0:1389" ldapVersion="3" authDN="" security="none" opsInProgress="0"
connection: connID="2" connectTime="20090706084747Z" source="198.51.100.0:57525" destination="198.51.100.0:1389" ldapVersion="3" authDN="" security="none" opsInProgress="0"
connection: connID="3" connectTime="20090706084747Z" source="198.51.100.0:57526" destination="198.51.100.0:1389" ldapVersion="3" authDN="" security="none" opsInProgress="0"
connection: connID="4" connectTime="20090706084747Z" source="198.51.100.0:57527" destination="198.51.100.0:1389" ldapVersion="3" authDN="" security="none" opsInProgress="0"
32.5.1.17 To Monitor the Administration Connector
This monitor provides basic information about the administration connector. For more information, see Section 17.3, "Managing Administration Traffic to the Server".
Use the ldapsearch command with base DN "cn=Administration Connector 0.0.0.0 port admin-port-number,cn=monitor".
$ ldapsearch -h localhost -p 4444 -D "cn=directory manager" -j pwd-file --useSSL \
  --trustAll -b "cn=Administration Connector 0.0.0.0 port 4444,cn=monitor" \
  "(objectclass=*)"
Depending on your configuration, output will be similar to the following:
objectClass: top
objectClass: ds-monitor-entry
objectClass: ds-connectionhandler-monitor-entry
dn: cn=Administration Connector 0.0.0.0 port 4444,cn=monitor
ds-connectionhandler-listener: 0.0.0.0:4444
ds-connectionhandler-num-connections: 0
ds-connectionhandler-protocol: LDAPS
cn: Administration Connector 0.0.0.0 port 4444
ds-mon-config-dn: cn=administration connector,cn=config
32.5.1.18 To Monitor Administration Connector Statistics
This monitor provides extensive statistical information about operations that are performed through the administration connector. For more information, see Section 17.3, "Managing Administration Traffic to the Server".
Use the ldapsearch command with base DN "cn=Administration Connector 0.0.0.0 port admin-port-number Statistics,cn=monitor".
$ ldapsearch -h localhost -p 4444 -D "cn=directory manager" -j pwd-file --useSSL \
  --trustAll \
  -b "cn=Administration Connector 0.0.0.0 port 4444 Statistics,cn=monitor" \
  "(objectclass=*)"
Depending on your configuration, output will be similar to the following:
dn: cn=Administration Connector 0.0.0.0 port 4444 Statistics,cn=monitor
compareResponses: 0
connectionsClosed: 1
searchResultsDone: 4
ds-mon-resident-time-mod-operations-total-time: 92257568
extendedResponses: 0
bindRequests: 2
operationsAbandoned: 0
bytesWritten: 45056
addResponses: 0
addRequests: 0
ds-mon-resident-time-moddn-operations-total-time: 0
ds-mon-extended-operations-total-count: 0
ds-mon-moddn-operations-total-count: 0
modifyResponses: 1
operationsCompleted: 7
...(more output)...
32.5.1.19 To Monitor Connections on the Administration Connector
This monitor represents the open client connections on the Administration Connector.
Use the ldapsearch command with base DN "cn=Client Connections,cn=Administration Connector 0.0.0.0 port port-number,cn=monitor".
$ ldapsearch -h localhost -p 4444 -D "cn=directory manager" -j pwd-file \
--useSSL --trustAll \
-b "cn=Client Connections,cn=Administration Connector 0.0.0.0 \
port 4444,cn=monitor" \
"(objectclass=*)"
Depending on your configuration, output will be similar to the following:
objectClass: top
objectClass: ds-monitor-entry
objectClass: extensibleObject
dn: cn=Client Connections,cn=Administration Connector 0.0.0.0 port 4444,cn=monitor
connection: connID="339" connectTime="20120307075218Z" source="198.51.100.0:48213"
destination="198.51.100.0:4444" ldapVersion="3" authDN="" security="TLS"
 opsInProgress="1"
cn: Client Connections
32.5.1.20 To Monitor the LDIF Connection Handler
The LDIF connection handler is used to process changes that are read from an LDIF file, using internal operations. Monitoring information for the LDIF connection handler is only available if the connection handler is enabled.
Use the ldapsearch command with base DN "cn=LDIF Connection Handler,cn=monitor".
$ ldapsearch -h localhost -p 4444 -D "cn=directory manager" -j pwd-file --useSSL \
  --trustAll -s base -b "cn=LDIF Connection Handler,cn=monitor" "(objectclass=*)"
Depending on your configuration, output will be similar to the following:
objectClass: top
objectClass: ds-monitor-entry
objectClass: ds-connectionhandler-monitor-entry
dn: cn=LDIF Connection Handler,cn=monitor
ds-connectionhandler-num-connections: 0
ds-connectionhandler-protocol: LDIF
ds-mon-config-dn: cn=ldif connection handler,cn=connection handlers,cn=config
cn: LDIF Connection Handler
32.5.1.21 To Monitor the Work Queue
The work queue keeps track of outstanding client requests and ensures that they are processed.
Use the ldapsearch command with base DN "cn=Work Queue,cn=monitor".
$ ldapsearch -h localhost -p 4444 -D "cn=directory manager" -j pwd-file --useSSL \
  --trustAll -s base -b "cn=Work Queue,cn=monitor" "(objectclass=*)"
Depending on your configuration, output will be similar to the following:
dn: cn=Work Queue,cn=monitor
currentRequestBacklog: 0
objectClass: extensibleObject
objectClass: top
objectClass: ds-monitor-entry
requestsSubmitted: 25
cn: Work Queue
maxRequestBacklog: 0
averageRequestBacklog: 0
requestsRejectedDueToQueueFull: 0
32.5.1.22 To Monitor JVM Stack Trace Information
You can access JVM Stack Trace information for your directory server instance. This resource monitor is implemented in the org.opends.server.monitors.StackTraceMonitorProvider class and requires no custom configuration.
Use the ldapsearch command with the base DN "cn=JVM Stack Trace,cn=monitor".
$ ldapsearch -h localhost -p 4444 -D "cn=directory manager" -j pwd-file --useSSL \
  --trustAll -s base -b "cn=JVM Stack Trace,cn=monitor" "(objectclass=*)"
Depending on your configuration, the beginning of the output will be similar to the following:
dn: cn=JVM Stack Trace,cn=monitor
cn: JVM Stack Trace
jvmThread: id=2 ---------- Reference Handler ----------
jvmThread: id=2 frame[0]=java.lang.Object.wait(Object.java:native)
jvmThread: id=2 frame[1]=java.lang.Object.wait(Object.java:485)
jvmThread: id=2 frame[2]=java.lang.ref.Reference$ReferenceHandler.run(Reference.
java:116)
jvmThread: id=3 ---------- Finalizer ----------
jvmThread: id=3 frame[0]=java.lang.Object.wait(Object.java:native)
jvmThread: id=3 frame[1]=java.lang.ref.ReferenceQueue.remove(ReferenceQueue.java
:116)
jvmThread: id=3 frame[2]=java.lang.ref.ReferenceQueue.remove(ReferenceQueue.java
:132)
jvmThread: id=3 frame[3]=java.lang.ref.Finalizer$FinalizerThread.run(Finalizer.j
ava:159)
jvmThread: id=4 ---------- Signal Dispatcher ----------
jvmThread: id=10 ---------- Time Thread ----------
jvmThread: id=10 frame[0]=sun.misc.Unsafe.park(Unsafe.java:native)
jvmThread: id=10 frame[1]=java.util.concurrent.locks.LockSupport.parkNanos(LockS
upport.java:198)
...(more output)...
32.5.1.23 To Monitor the JVM Memory Usage
Use the ldapsearch command with base DN "cn=JVM Memory Usage,cn=monitor".
$ ldapsearch -h localhost -p 4444 -D "cn=directory manager" -j pwd-file --useSSL \
  --trustAll -s base -b "cn=JVM Memory Usage,cn=monitor" "(objectclass=*)"
Depending on your configuration, output will be similar to the following:
dn: cn=JVM Memory Usage,cn=monitor
ps-eden-space-bytes-used-after-last-collection: 0
ps-mark-sweep-total-collection-count: 0
code-cache-bytes-used-after-last-collection: 0
ps-old-gen-current-bytes-used: 25260472
ps-perm-gen-bytes-used-after-last-collection: 0
ps-scavenge-recent-collection-duration: 3
ps-scavenge-total-collection-count: 17
ps-eden-space-current-bytes-used: 32001992
ps-perm-gen-current-bytes-used: 21179960
ps-old-gen-bytes-used-after-last-collection: 0
ps-mark-sweep-total-collection-duration: 0
ps-mark-sweep-average-collection-duration: 0
ps-scavenge-average-collection-duration: 26
ps-scavenge-total-collection-duration: 443
objectClass: extensibleObject
objectClass: top
objectClass: ds-monitor-entry
ps-mark-sweep-recent-collection-duration: 0
ps-survivor-space-bytes-used-after-last-collection: 622592
cn: JVM Memory Usage
code-cache-current-bytes-used: 2143680
ps-survivor-space-current-bytes-used: 622592
32.5.1.24 To Monitor the userRoot Database Environment
The userRoot database environment utilizes the Berkeley DB Java Edition back end. JE monitoring data (data under cn=*Database Environment,cn=monitor) is reliable only in the short term. During high server activity (for example, anywhere from an hour to several days depending on the counter), this data can overflow. In such cases, the JE monitoring data can reflect negative values or positive but incorrect values. This is a known issue and is expected to be fixed in the next major release of the Berkeley DB Java Edition. Oracle SR numbers 15979 and 15985 correspond to this issue.
Use the ldapsearch command with base DN "cn=userRoot Database Environment,cn=monitor".
$ ldapsearch -h localhost -p 4444 -D "cn=directory manager" -j pwd-file --useSSL \
  --trustAll -s base -b "cn=userRoot Database Environment,cn=monitor" \
  "(objectclass=*)"
dn: cn=userRoot Database Environment,cn=monitor
Depending on your configuration, output will be similar to the following:
EnvironmentNTempBufferWrites: 0
EnvironmentNNodesExplicitlyEvicted: 0
EnvironmentCleanerBacklog: 0
EnvironmentTotalLogSize: 5386067
EnvironmentLockBytes: 2000
EnvironmentNFullBINFlush: 2
EnvironmentNBINsStripped: 0
EnvironmentLastCheckpointEnd: 5385359
TransactionNCommits: 24
EnvironmentNCleanerEntriesRead: 0
EnvironmentNRepeatFaultReads: 2
TransactionNXACommits: 0
EnvironmentNClusterLNsProcessed: 0
TransactionNBegins: 24
LockNOwners: 25
...(more output)...
32.5.1.25 To Monitor the Database Cache
The database (DB) cache is used to store Java Edition nodes. The DB cache is the critical component of your directory server's overall performance. Ensure that you tune and monitor the DB cache carefully. The DB cache includes the following nodes:
-
Upper node
-
Inner node
-
Leaf node
The upper and inner nodes represents the internal B-tree structure and the leaf node represent the user entries. For best possible performance, it is recommended to have all the DB cache nodes in the DB cache. It is recommend to size the dbcache such that it contains at minimum the B-tree internal structure (the upper and inner nodes). If the dbcache is too short this can result in having lots of misses and frequent evictions which will badly affect directory server performance.
Tuning the size of the cache is done by:
-
Setting the
dbcache-percent -
Sizing appropriately the OUD JVM heap and especially the old generation.
You can monitor the DB cache by using the ldapsearch command with base DN cn=userRoot Database Environment,cn=monitor:
$ ldapsearch -h localhost -p 4444 -D "cn=directory manager" -j pwd-file --useSSL \
  --trustAll -s base -b "cn=userRoot Database Environment,cn=monitor" \
  "(objectclass=*)"
dn: cn=userRoot Database Environment,cn=monitor
Depending on your configuration, output will be similar to the following:
EnvironmentNTempBufferWrites: 0
EnvironmentNNodesExplicitlyEvicted: 0
EnvironmentCleanerBacklog: 0
EnvironmentTotalLogSize: 5386067
EnvironmentLockBytes: 2000
EnvironmentNFullBINFlush: 2
EnvironmentNBINsStripped: 0
EnvironmentLastCheckpointEnd: 5385359
TransactionNCommits: 24
EnvironmentNCleanerEntriesRead: 0
EnvironmentNRepeatFaultReads: 2
TransactionNXACommits: 0
EnvironmentNClusterLNsProcessed: 0
TransactionNBegins: 24
LockNOwners: 25
...(more output)...
The following DB cache hits and miss counters are described below:
| Counters | Description |
|---|---|
EnvironmentNUpperINsFetch |
Accumulated number of upper inner nodes fetched from the cache. |
EnvironmentNUpperINsFetchMiss |
Accumulated number of upper inner nodes miss. |
EnvironmentNBINsFetch |
Accumulated number of bottom inner nodes fetched from the cache. |
EnvironmentNBINsFetchMiss |
Accumulated number of upper inner nodes miss. |
EnvironmentNLNsFetch |
Accumulated number of leaf nodes fetched from the cache. |
EnvironmentNLNsFetchMiss |
Accumulated number of leaf nodes miss. |
For OUD to perform well it is recommended to have all the nodes in the dbcache or at least to have all the inner nodes in the dbcache.
As the values in cn=monitor are accumulations, it is important to compute deltas at regular interval (1mn for instance) and monitor the evolution of deltas over time. You must update the following:
DeltaNUpperINsMiss=EnvironmentNUpperINsFetchMiss - EnvironmentNUpperINsFetchMissPrev
DeltaNUpperINsFetch=EnvironmentNUpperINsFetch - EnvironmentNUpperINsFetchPrev
DeltaBINsMiss=EnvironmentNBINsFetchMiss - EnvironmentNBINsFetchMissPrev
DeltaBINsFetch=EnvironmentNBINsFetch - EnvironmentNBINsFetchPrev
DeltaNLNsMiss=EnvironmentNLNsFetchMiss - EnvironmentNLNsFetchMissPrev
DeltaNLNsFetch=EnvironmentNLNsFetch - EnvironmentNLNsFetchPrev
You can run the Oracle Unified Directory with a minimal level of performance. It is recommend to have the B-Tree structure in the dbcache, as described below:
((DeltaNUpperINsMiss/DeltaNUpperINsFetch)*100) as close to 0 as possible
((DeltaNBINsMiss/DeltaNBINsFetch)*100) as close to 0 as possible (< 5% remains acceptable)
To have the best possible performance, it is recommended for OUD to also have user entries in the dbcache, i-e:
((DeltaNLNsMiss/DeltaNLNsFetch)*100) as close to 0 as possible.
Start with Deltas ratio close to 0 after the import is complete (and data primed) and with time the Deltas ratio grows due to the database growth (bc of replication metadata, clean-min-utilizat° impact, growth of the entry (new apps) as well as the nb of entries). Due to this, it is recommended to monitor the dbcache (via custom scripts or UI) and take appropriate actions such as increase the dbcache-percent or the OUD JVM heap.
32.5.1.26 To Monitor the Entry Cache
You can access the aggregated state of all active entry caches for your directory server instance by accessing the cn=Entry Caches,cn=Monitor entry. The server can also request the "per cache" monitor data for a given instance if the entry cache instances are enabled in the directory server configuration:
-
cn=FIFO Entry Cache,cn=Monitor -
cn=Soft Reference Entry Cache,cn=Monitor -
cn=File System Entry Cache,cn=Monitor
Additionally, any arbitrarily named active entry cache instance should provide a monitor, which can be accessed by that instance name, for example cn=Any Arbitrary Name Entry Cache,cn=Monitor.
Use the ldapsearch command with base DN "cn=Entry Caches,cn=monitor".
$ ldapsearch -h localhost -p 4444 -D "cn=directory manager" -j pwd-file --useSSL \
  --trustAll -s base -b "cn=Entry Caches,cn=monitor" "(objectclass=*)"
Depending on your configuration, output will be similar to the following:
dn: cn=Entry Caches,cn=monitor
entryCacheHits: 0
entryCacheTries: 0
currentEntryCacheCount: 0
objectClass: extensibleObject
objectClass: top
objectClass: ds-monitor-entry
entryCacheHitRatio: 0
cn: Entry Caches
...
32.5.1.27 To Monitor Network Groups
Use the ldapsearch command with the base DN "cn=Network Groups,cn=monitor".
$ ldapsearch -h localhost -p 4444 -D "cn=directory manager" -j pwd-file \
--useSSL --trustAll -b "cn=Network Groups,cn=monitor" "(objectclass=*)"
Depending on your configuration, output will be similar to the following:
objectClass: top
objectClass: ds-monitor-entry
objectClass: ds-mon-branch
dn: cn=Network Groups,cn=monitor
dn: cn=admin,cn=Network Groups,cn=monitor
ds-mon-compare-operations-total-count: 0
ds-mon-failed-referrals-total-count: 15
ds-mon-unbind-operations-total-count: 13
ds-mon-followed-referrals-total-count: 34
ds-mon-violations-schema-total-count: Not implemented
ds-mon-bind-operations-total-count: 98
ds-mon-persistent-searchs-count: Not implemented
ds-mon-add-operations-total-count: 37
ds-mon-abandon-operations-total-count: 0
ds-mon-moddn-operations-total-count: 0
ds-mon-extended-operations-total-count: 0
ds-mon-searchsubtree-operations-total-count: 310
objectClass: top
objectClass: ds-monitor-entry
objectClass: extensibleObject
ds-mon-discarded-referrals-total-count: Not implemented
ds-mon-mod-operations-total-count: 1
ds-mon-forwarded-referrals-total-count: Not implemented
cn: admin
ds-mon-searchonelevel-operations-total-count: 92966
ds-mon-delete-operations-total-count: 0

dn: cn=default,cn=Network Groups,cn=monitor
...
32.5.1.28 To Monitor Distribution
Use the ldapsearch command with the base DN "cn=Distribution,cn=monitor".
$ ldapsearch -h localhost -p 4444 -D "cn=directory manager" -j pwd-file \
  --useSSL --trustAll -b "cn=Distribution,cn=monitor" "(objectclass=*)"
Depending on your configuration, output will be similar to the following:
objectClass: top
objectClass: ds-monitor-entry
objectClass: ds-mon-branch
dn: cn=distribution,cn=monitor

cn: distrib-we
ds-mon-searchonelevel-operations-total-count: 0
ds-mon-residenttime-bind-operations-max-time: 0
...

ds-mon-delete-operations-total-count: 0

dn: cn=algorithm,cn=distrib-we,cn=distribution,cn=monitor
ds-mon-residenttime-total-time: 0
ds-mon-residenttime-max-time: 0
cn: algorithm
ds-mon-runs-total-count: 0
ds-mon-residenttime-min-time: 0
objectClass: top
objectClass: ds-monitor-entry
objectClass: extensibleObject

dn: cn=partitions,cn=algorithm,cn=distrib-we,cn=distribution,cn=monitor
objectClass: top
objectClass: ds-monitor-entry
objectClass: ds-mon-branch

dn: cn=distrib-part1,cn=partitions,cn=algorithm,cn=distrib-we,cn=distribution,cn
 =monitor
...
objectClass: top
objectClass: ds-monitor-entry
objectClass: extensibleObject
ds-mon-modify-operations-total-count: 0
cn: distrib-part1
ds-mon-searchonelevel-operations-total-count: 0
ds-mon-delete-operations-total-count: 0

dn: cn=distrib-part2,cn=partitions,cn=algorithm,cn=distrib-we,cn=distribution,cn
 =monitor

...
32.5.1.29 To Monitor Load Balancing
Use the ldapsearch command with the base DN "cn=load balancing,cn=monitor".
$ ldapsearch -h localhost -p 4444 -D "cn=Directory Manager" -j pwd-file \
  --useSSL --trustAll -b "cn=load balancing,cn=monitor" "(objectclass=*)"
Depending on your configuration, output will be similar to the following:
objectClass: top
objectClass: ds-monitor-entry
objectClass: ds-mon-branch
dn: cn=load balancing,cn=monitor
dn: cn=load-bal-we1,cn=load balancing,cn=monitor
ds-mon-aborted-add-operations-total-count: 0
...
dn: cn=algorithm,cn=load-bal-we1,cn=load balancing,cn=monitor

dn: cn=routes,cn=algorithm,cn=load-bal-we1,cn=load balancing,cn=monitor
...
dn: cn=load-bal-route1,cn=routes,cn=algorithm,cn=load-bal-we1,cn=load balancing,cn=monitor
...
dn: cn=load-bal-we2,cn=load balancing,cn=monitor
...
dn: cn=algorithm,cn=load-bal-we2,cn=load balancing,cn=monitor
...
dn: cn=routes,cn=algorithm,cn=load-bal-we2,cn=load balancing,cn=monitor

dn: cn=load-bal-route1,cn=routes,cn=algorithm,cn=load-bal-we2,cn=load balancing,cn=monitor
...
cn: load-bal-route1

dn: cn=load-bal-route2,cn=routes,cn=algorithm,cn=load-bal-we1,cn=load balancing,cn=monitor
...
cn: load-bal-route2

dn: cn=load-bal-route2,cn=routes,cn=algorithm,cn=load-bal-we2,cn=load balancing,cn=monitor

cn: load-bal-route2
ds-mon-searchonelevel-operations-total-count: 9
ds-mon-delete-operations-total-count: 0
32.5.1.30 To Monitor Remote LDAP Servers
Use the ldapsearch command with the base DN "cn=LDAP Servers,cn=monitor".
$ ldapsearch -h localhost -p 4444 -D "cn=Directory Manager" -j pwd-file \
  --useSSL --trustAll -b "cn=LDAP Servers,cn=monitor" "(objectclass=*)"
Depending on your configuration, output will be similar to the following:
objectClass: top
objectClass: ds-monitor-entry
objectClass: ds-mon-branch
dn: cn=LDAP Servers,cn=monitor

dn: cn=proxy1,cn=LDAP Servers,cn=monitor
ds-mon-aborted-add-operations-total-count: 0
...
cn: proxy1
ds-mon-searchonelevel-operations-total-count: 0
...
objectClass: top
objectClass: ds-monitor-entry
objectClass: extensibleObject

dn: cn=proxy2,cn=LDAP Servers,cn=monitor
ds-mon-aborted-add-operations-total-count: 0
...
cn: proxy2
ds-mon-searchonelevel-operations-total-count: 0
...
objectClass: top
objectClass: ds-monitor-entry
objectClass: extensibleObject
...
dn: cn=proxy3,cn=LDAP Servers,cn=monitor
...
cn: proxy3
ds-mon-searchonelevel-operations-total-count: 0
...
objectClass: top
objectClass: ds-monitor-entry
objectClass: extensibleObject
...
dn: cn=proxy4,cn=LDAP Servers,cn=monitor
...
cn: proxy4
...
objectClass: top
objectClass: ds-monitor-entry
objectClass: extensibleObject
32.5.1.31 To Monitor a Global Index
Use the ldapsearch command with the base DN "cn=givenname,cn=gi-catalog,cn=Global Index Catalogs,cn=monitor".
Ensure that givenname corresponds to the name of the indexed attribute (for example cn, if you indexed cn), and that gi-catalog corresponds to the name of the global index catalog.
$ ldapsearch -h localhost -p 4444 -D "cn=Directory Manager" -j pwd-file --useSSL \
  --trustAll -b "cn=givenname,cn=gi-catalog,cn=Global Index Catalogs,cn=monitor"
  "(objectclass=*)"
Depending on your configuration, output will be similar to the following:
dn: cn=givenname,cn=gi-catalog,cn=Global Index Catalogs,cn=monitor
ds-mon-add-operations-min-time: 0
ds-mon-add-operations-aborted-count: 0
ds-mon-lookup-operations-min-time: 0
ds-mon-getpartitions-operations-total-count: 0
ds-mon-add-operations-max-time: 0
ds-mon-lookup-operations-total-count: 0
ds-mon-memorized-remove-operations-count: 0
ds-mon-remove-operations-aborted-count: 0
ds-mon-add-operations-total-time: 0
ds-mon-getpartitions-operations-aborted-count: 0
ds-mon-lookup-operations-total-time: 0
ds-mon-index-entries: 0
ds-mon-remove-operations-failed-count: 0
ds-mon-getpartitions-operations-min-time: 0
ds-mon-lookup-operations-max-time: 0
ds-mon-getpartitions-operations-average-time: 0
ds-mon-index-creation-date: 1252483187019
ds-mon-getpartitions-operations-last-access-date: 0
ds-mon-remove-operations-total-count: 0
ds-mon-lookup-operations-failed-count: 0
ds-mon-add-operations-failed-count: 0
ds-mon-remove-operations-min-time: 0
ds-mon-add-operations-average-time: 0
ds-mon-lookup-operations-aborted-count: 0
ds-mon-getpartitions-operations-total-time: 0
ds-mon-remove-operations-max-time: 0
ds-mon-getpartitions-operations-max-time: 0
ds-mon-lookup-operations-last-access-date: 0
ds-mon-add-operations-total-count: 0
ds-mon-remove-operations-total-time: 0
ds-mon-remove-operations-average-time: 0
ds-mon-getpartitions-operations-failed-count: 0
objectClass: ds-monitor-entry
objectClass: top
objectClass: extensibleObject
ds-mon-lookup-operations-average-time: 0
ds-mon-remove-operations-last-access-date: 0
cn: givenname
ds-mon-add-operations-last-access-date: 0
32.5.1.32 To Monitor a Global Index Catalog
Use the ldapsearch command with the base DN "cn=gi-catalog,cn=Global Index Catalogs,cn=monitor".
Ensure that givenname corresponds to the name of the indexed attribute (for example cn, if you indexed cn), and that gi-catalog corresponds to the name of the global index catalog.
$ ldapsearch -h localhost -p 4444 -D "cn=Directory Manager" -j pwd-file --useSSL \
  --trustAll -b "cn=gi-catalog,cn=Global Index Catalogs,cn=monitor" \
  "(objectclass=*)"
Depending on your configuration, output will be similar to the following:
dn: cn=gi-catalog,cn=Global Index Catalogs,cn=monitor
ds-mon-replication-received-update-message-errors: 0
ds-mon-configured-index-number: 1
ds-mon-replication-full-update-pending-attribute:
ds-mon-replication-full-update-status: NONE
ds-mon-state: RUNNING_STANDALONE
ds-mon-replication-published-update-message-number: 0
ds-mon-replication-active: false
ds-mon-replication-auto-sync-retries: 0
ds-mon-replication-published-update-message-errors: 0
ds-mon-replication-full-update-errors: 0
ds-mon-replication-received-update-message-number: 0
ds-mon-replication-auto-sync-is-running: false
objectClass: ds-monitor-entry
objectClass: top
objectClass: extensibleObject
ds-mon-replication-configured: false
cn: gi-catalog
32.5.2 Monitoring Using the manage-tasks Command
Oracle Unified Directory provides a tasks back end that provides a mechanism for scheduling and processing certain tasks, such as import-ldif, export-ldif, backup, and restore. You can schedule a task to run at specific times and at recurring periods. To monitor scheduled tasks, use the manage-tasks command. For more information, see Section 17.4, "Configuring Commands As Tasks".
32.5.3 Monitoring the Server With JConsole
The JConsole (jconsole) Java utility is a JMX-compliant, graphical tool that connects to a running Java Virtual Machine that has been started with the management agent. This generic tool can be used to access server monitoring information.
32.5.3.1 To Configure JMX on a Server Instance
-
Start the server.
-
Enable the JMX Connection Handler and set the port number to be used with JMX.
Choose a port that is not in use and to which the user that is running the server has access rights.
$ dsconfig -h localhost -p 4444 -D "cn=directory manager" -j pwd-file -X -n \
  set-connection-handler-prop --handler-name "JMX Connection Handler" \
  --set enabled:true --set listen-port:1689
-
Add the JMX read, write, and notify privileges to the root DN.
$ dsconfig -h localhost -p 4444 -D "cn=directory manager" -j pwd-file -X -n \
  set-root-dn-prop \
  --add default-root-privilege-name:jmx-read \
  --add default-root-privilege-name:jmx-write \
  --add default-root-privilege-name:jmx-notify
-
Restart the server.
32.5.3.2 Starting JConsole
Start the console by typing jconsole in a terminal window.
To run jconsole from the command line, you might have to add JAVA_HOME/bin to your path, where JAVA_HOME is the directory containing the JDK. Alternatively, you can enter the full path when you type the command.
For more information about using JConsole, see Using JConsole (https://download.oracle.com/docs/cd/E17409_01/javase/6/docs/technotes/guides/management/jconsole.html).
32.5.3.3 Accessing a Server Instance From JConsole
To connect JConsole to a server instance, use the Remote Process fields. The following fields are required:
-
JMX URL:
service:jmx:rmi:///jndi/rmi://''host'':''port''/org.opends.server.protocols.jmx.client-unknown-
host is a host name, an IPv4 numeric host address, or an IPv6 numeric address enclosed in square brackets.
-
port is the decimal port number of the JMX connector. (See Section 32.4, "Configuring Alerts and Account Status Notification Handlers").
The default JMX URL is:
service:jmx:rmi:///jndi/rmi://198.51.100.0:1689/org.opends.server.protocols.jmx.client-unknown -
-
User Name. A valid LDAP user name.
The default Directory Manager user name is
cn=Directory Manager. -
Password. The user's LDAP password.
32.5.3.4 Viewing Monitoring Information With JConsole
When JConsole is connected to a server instance, it displays management objects (MBeans). The tree on the left pane shows all MBeans currently available. You can access server monitoring information in the right hand pane by selecting the associated MBean.
The following figure shows the attribute list for a server cn=LDAP Connection Handler 0.0.0.0 port 1389 Statistics,cn=monitor.
Figure 32-1 Java Monitoring and Management Console
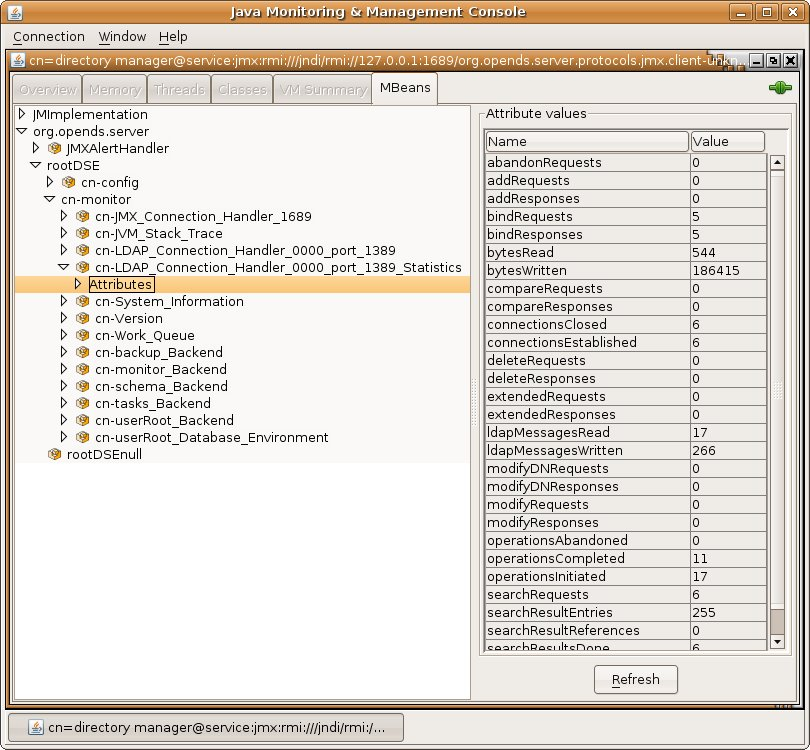
Description of ''Figure 32-1 Java Monitoring and Management Console''
32.5.4 Accessing Logs
The server provides logging mechanisms to record access, error, or debugging information for the server instance. Multiple loggers of a given type can be active at any time, which makes it possible to create logs for specific subtrees or different repositories. The server does not currently provide logging filters to restrict the type of information in the logs.
The following logs are provided:
-
Access logs. Access logs record information about the types of operations processed by the directory server. Access logs are provided by default.
-
Audit logs. Audit logs are a type of access log and record all activity on the directory server. Audit logs are not enabled by default.
-
Debug logs. Debug logs record information that can be used for troubleshooting directory server problems or for providing detailed information about the directory server's processing. Debug logs are not enabled by default.
-
Error logs. Error logs record all warnings, errors, or significant events that occur during directory server processing.
-
Replication repair logs. Replication repair logs record inconsistencies on a single directory server in a topology.
The replication repair log is read-only and its use is restricted to enabling replication conflict resolution.
-
oud-setup logs. The setup logs record the equivalent command line arguments executed during the installation of an Oracle Unified Directory proxy server instance or replication gateway instance. This enables you to perform a "silent install" of the proxy server or gateway server, based on a previous installation.
This file is not output for directory server instances.
-
server.out logs. The server.out logs record the bootstrapping configuration process, list extensions loaded from jar files, and indicate connection and alert notification activity.
32.5.4.1 To View the Access Logs
-
Change to the logs directory of the server instance.
$ cd INSTANCE_DIR/OUD/logs -
Open the
accessfile by using a text editor or the UNIXcatcommand.$ cat access | more [10/Jan/2012:12:02:11 +0100] CONNECT conn=0 from=198.51.100.0:55416 to=198.51.100.0:5444 protocol=LDAPS [10/Jan/2012:12:02:12 +0100] BIND REQ conn=0 op=0 msgID=1 type=SIMPLE dn="cn=Directory Manager" [10/Jan/2012:12:02:12 +0100] BIND RES conn=0 op=0 msgID=1 result=0 authDN="cn=Directory Manager,cn=Root DNs,cn=config" etime=36 [10/Jan/2012:12:02:12 +0100] UNBIND REQ conn=0 op=1 msgID=2 [10/Jan/2012:12:02:12 +0100] DISCONNECT conn=0 reason="Client Disconnect" ...(more output)...
32.5.4.2 To View the Audit Logs
-
If the audit log publisher is not already enabled, enable it as described in Section 32.3.1.1.2, "To Enable a Log Publisher".
-
Change to the logs directory of the server instance.
$ cd INSTANCE_DIR/OUD/logs -
Open the
auditfile by using a text editor or the UNIXcatcommand.$ cat audit | more # 11/Jan/2012:11:20:00 +0100; conn=10; op=18 dn: cn=File-Based Audit Logger,cn=Loggers,cn=config changetype: modify replace: ds-cfg-enabled ds-cfg-enabled: true - replace: modifiersName modifiersName: cn=directory manager - replace: modifyTimestamp modifyTimestamp: 20120111102000Z # 11/Jan/2012:11:20:20 +0100; conn=11; op=6 dn: cn=File-Based Debug Logger,cn=Loggers,cn=config changetype: modify replace: ds-cfg-enabled ds-cfg-enabled: true - replace: modifiersName modifiersName: cn=directory manager - replace: modifyTimestamp modifyTimestamp: 20120111102020Z ...(more output)...
32.5.4.3 To View the Debug Logs
-
If the debug log publisher is not already enabled, enable it as described in Section 32.3.1.1.2, "To Enable a Log Publisher".
-
Change to the logs directory of the server instance.
$ cd INSTANCE_DIR/OUD/logs -
Open the
debugfile by using a text editor or the UNIXcatcommand.$ cat debug | more [11/Jan/2012:11:39:48 +0100] 0 caught error thread={Worker Thread 43(118)} threadDetail={parentThread=main(1) isDaemon=false clientConnection=LDAP client connection from 198.51.100.0:56288 to 198.51.100.0:2389 operation=SearchOperation(connID=13, opID=1, baseDN=dc=example,dc=com, scope=wholeSubtree, filter=(objectclass=*)) } method={run(SearchOperationBas is.java:1513)} caught={org.opends.server.types.CanceledOperationException: Client Disconnect} ...(more output)...
32.5.4.4 To View the Error Logs
-
Change to the logs directory of the server instance.
$ cd INSTANCE_DIR/OUD/logs -
Open the
errorsfile by using a text editor or the UNIXcatcommand.$ cat errors | more [11/Jan/2012:15:14:13 +0100] category=RUNTIME_INFORMATION severity=NOTICE msgID=20381717 msg=Installation Directory: /local/OUD_BASE/Oracle_OUD1[11/Jan/2012:15:14:13 +0100] category=RUNTIME_INFORMATION severity=NOTICE msgID=20381719 msg=Instance Directory: /local/OUD_BASE/asinst_4/OUD[11/Jan/2012:15:14:13 +0100] category=RUNTIME_INFORMATION severity=NOTICE msgID=20381713 msg=JVM Information: 1.6.0_30-b12 by Sun Microsystems Inc., 32-bit architecture, 957743104 bytes heap size[11/Jan/2012:15:14:13 +0100] category=RUNTIME_INFORMATION severity=NOTICE msgID=20381714 msg=JVM Host: host1, running SunOS 5.10 sparc, 103079215104 bytes physical memory size, number of processors available 24[11/Jan/2012:15:14:13 +0100] category=RUNTIME_INFORMATION severity=NOTICE msgID=20381715 msg=JVM Arguments: "-Dorg.opends.server.scriptName=start-ds"[11/Jan/2012:15:14:16 +0100] category=PROTOCOL severity=NOTICE msgID=2556180 msg=Started listening for new connections on Administration Connector 0.0.0.0 port 7444[11/Jan/2012:15:14:16 +0100] category=PROTOCOL severity=NOTICE msgID=2556180 msg=Started listening for new connections on LDAP Connection Handler 0.0.0.0 port 4389[11/Jan/2012:15:14:16 +0100] category=CORE severity=NOTICE msgID=458887 msg=TheDirectory Server has started successfully...(more output)...
32.5.4.5 To View the Replication Repair Logs
-
Change to the logs directory of the server instance.
$ cd INSTANCE_DIR/OUD/logs -
Open the
replicationfile by using a text editor or the UNIXcatcommand.$ cat replication | more [13/Jan/2012:15:00:50 +0100] category=SYNC severity=NOTICE msgID=15139035 msg=The replication server database has version 2 format[13/Jan/2012:15:00:50 +0100] category=SYNC severity=NOTICE msgID=15138878 msg=Replication is up and running for domain cn=admin data with replication server id 18049 host1/198.51.100.0:8989 - local server id is 9338 - data generation is 93408[13/Jan/2012:15:00:52 +0100] category=SYNC severity=NOTICE msgID=15138878 msg=Replication is up and running for domain dc=example,dc=com with replication server id 18049 host1/198.51.100.0:8989 - local server id is 25340 - data generation is 19449577[13/Jan/2012:15:00:53 +0100] category=SYNC severity=NOTICE msgID=15138878 msg=Replication is up and running for domain cn=schema with replication server id 18049 host1/198.51.100.0:8989 - local server id is 13881 - data generation is 8408[13/Jan/2012:15:08:28 +0100] category=SYNC severity=NOTICE msgID=15138893 msg=On suffix cn=admin data, replication server 3844 presented generation ID=-1 when expected generation ID=93408[13/Jan/2012:15:08:28 +0100] category=SYNC severity=MILD_ERROR msgID=14876753 msg=In RS 18049 for dn cn=admin data, update 00000134d765d4b1247a00000001 will not be sent to RS 3844 with generation id -1 different from local generation id 93408[13/Jan/2012:15:08:28 +0100] category=SYNC severity=MILD_ERROR msgID=14876753 msg=In RS 18049 for dn cn=admin data, update 00000134d765d4b1247a00000002 will not be sent to RS 3844 with generation id -1 different from local generation id 93408...(more output)...
32.5.4.6 To View the server.out Logs
-
Change to the logs directory of the server instance.
$ cd INSTANCE_DIR/OUD/logs -
Open the
server.outfile by using a text editor or the UNIXcatcommand.$ cat server.out | more [23/May/2011:02:27:59 -0700] category=CORE severity=INFORMATION msgID=132 msg=The Directory Server is beginning the configuration bootstrapping process [23/May/2011:02:28:00 -0700] category=EXTENSIONS severity=INFORMATION msgID=1049147 msg=Loaded extension from file '/OUD_BASE/ORACLE_HOME/lib/extensions/globalindex.jar' (build 1.0.0) [23/May/2011:02:28:00 -0700] category=EXTENSIONS severity=INFORMATION msgID=1049147 msg=Loaded extension from file '/OUD_BASE/ORACLE_HOME/lib/extensions/replication-gateway.jar' (build 1.0.0) [23/May/2011:02:28:00 -0700] category=EXTENSIONS severity=INFORMATION msgID=1049147 msg=Loaded extension from file '/OUD_BASE/ORACLE_HOME/lib/extensions/snmp-mib2605.jar' (build 11.1.1.5.0) [23/May/2011:02:28:00 -0700] category=EXTENSIONS severity=INFORMATION msgID=1049147 msg=Loaded extension from file '/OUD_BASE/ORACLE_HOME/lib/extensions/loadbalancing.jar' (build 1.0.0) [23/May/2011:02:28:00 -0700] category=EXTENSIONS severity=INFORMATION msgID=1049147 msg=Loaded extension from file '/OUD_BASE/ORACLE_HOME/lib/extensions/virtualization.jar' (build 1.0.0) [23/May/2011:02:28:00 -0700] category=EXTENSIONS severity=INFORMATION msgID=1049147 msg=Loaded extension from file '/OUD_BASE/ORACLE_HOME/lib/extensions/distribution.jar' (build 1.0.0) ... more output ...
32.5.4.7 To View the Setup Logs
This log file is available for proxy server and replication gateway instances only.
-
Change to the logs directory of the server instance.
$ cd INSTANCE_DIR/OUD/logs -
Open the
oud-setupfile by using a text editor or the UNIXcatcommand.$ cat oud-setup | more May 19, 2011 2:24:36 AM com.sun.dps.ui.deploy.SetupLog initLogFileHandler INFO: oud-setup application launched May 19, 2011 2:24:36 AM PDT ...(more output)...
32.6 Monitoring the Server With SNMP
Oracle Unified Directory provides a Simple Network Management Protocol (SNMP) connection handler for Management Information Base (MIB) 2605 support. The MIB 2605 allows an SNMP manager to access the server monitoring information. The MIB contains the SNMP connection handler, the required classes to support MIB 2605 objects and SNMP requests, and the SNMP adapter that allows an SNMP manager to access the server monitoring information.
Before you start on the procedures in this section, ensure that you have set up an SNMP-managed network for your particular system.
32.6.1 Configuring the SNMP Connection Handler and Its Dependencies
Oracle Unified Directory provides an SNMP connection handler that you can enable and configure.
The SNMP MIB 2605 description is available in install-dir/lib/extensions/snmp-mib2605.jar. The SNMP MIB 2605 description is stored in a file located in install-dir/snmp/mib/rfc2605.txt.
32.6.1.1 To Configure SNMP in the Server
Oracle Unified Directory can be configured for monitoring through the Simple Network Management Protocol (SNMP). The server uses the Java Dynamic Management Kit (JDMK) to create smart agents for the SNMP connection handler.
-
Verify that the SNMP connection handler is displayed under the list of current connection handlers by using
dsconfigas follows.$ dsconfig -h localhost -p 4444 -D "cn=directory manager" -j pwd-file -n \ list-connection-handlers Connection Handler : Type : enabled : listen-port : use-ssl -------------------------:------:---------:-------------:-------- JMX Connection Handler : jmx : false : 1689 : false LDAP Connection Handler : ldap : true : 1389 : false LDAPS Connection Handler : ldap : false : 636 : true LDIF Connection Handler : ldif : true : - : - SNMP Connection Handler : snmp : false : 161 : -
-
Use the
dsconfigcommand to enable SNMP for the server and to set the listen port.$ dsconfig -h localhost -p 4444 -D "cn=Directory Manager" -j pwd-file -n -X \ set-connection-handler-prop --handler-name "SNMP Connection Handler" \ --set enabled:true --set listen-port:8085
32.6.1.2 To View the SNMP Connection Handler Properties
Run the following command to display the list of SNMP connection handler properties.
$ dsconfig -h localhost -p 4444 -D "cn=directory manager" -j pwd-file -n \
  get-connection-handler-prop --handler-name "SNMP Connection Handler"
The connection handler properties are listed with their values, as follows.
Property            : Value(s)
--------------------:------------------------------------------
allowed-client      : -
allowed-manager     : *
allowed-user        : *
community           : OUD
denied-client       : -
enabled             : false
listen-port         : 161
opendmk-jarfile     : -
registered-mbean    : false
security-agent-file : config/snmp/security/oud-snmp.security
security-level      : authnopriv
trap-port           : 162
traps-community     : OUD
traps-destination   : -
32.6.1.3 To Access SNMP on a Server Instance
-
Restart the server by using
stop-dsandstart-ds.If the server was started and no modifications were made to the configuration, the restart operation is not required.
-
Check that the SNMP Connection Handler is up and running.
$ snmpwalk -v 2c -c OUD@OUD localhost:161 mib-2.66
SNMPv2-SMI::mib-2.66.1.1.1.1 = STRING: "Oracle Unified Directory Server
11.1.2.2.0 - 20131010000044Z"
SNMPv2-SMI::mib-2.66.1.1.2.1 = STRING: "INSTANCE_DIR/bin"
SNMPv2-SMI::mib-2.66.1.1.3.1 = Gauge32: 35
SNMPv2-SMI::mib-2.66.1.1.4.1 = Gauge32: 1
SNMPv2-SMI::mib-2.66.1.1.5.1 = Gauge32: 0
SNMPv2-SMI::mib-2.66.1.1.6.1 = Counter32: 0
SNMPv2-SMI::mib-2.66.1.1.7.1 = Counter32: 1
SNMPv2-SMI::mib-2.66.2.1.1.1.1 = INTEGER: 1
SNMPv2-SMI::mib-2.66.2.1.1.1.2 = INTEGER: 2
SNMPv2-SMI::mib-2.66.2.1.1.1.3 = INTEGER: 3
SNMPv2-SMI::mib-2.66.2.1.2.1.1 = OID: SNMPv2-SMI::internet.27.3.8085
SNMPv2-SMI::mib-2.66.2.1.2.1.2 = OID: SNMPv2-SMI::internet.27.3.1389
SNMPv2-SMI::mib-2.66.2.1.2.1.3 = OID: SNMPv2-SMI::enterprises.42
SNMPv2-SMI::mib-2.66.2.1.3.1.1 = Counter32: 1
SNMPv2-SMI::mib-2.66.2.1.3.1.2 = Counter32: 1
SNMPv2-SMI::mib-2.66.2.1.3.1.3 = Counter32: 1
SNMPv2-SMI::mib-2.66.2.1.4.1.1 = Counter32: 1
SNMPv2-SMI::mib-2.66.2.1.4.1.2 = Counter32: 1
SNMPv2-SMI::mib-2.66.2.1.4.1.3 = Counter32: 1
SNMPv2-SMI::mib-2.66.2.1.5.1.1 = Counter32: 1
SNMPv2-SMI::mib-2.66.2.1.5.1.2 = Counter32: 1
...
The managed objects included in the MIB 2605 are divided into three tables:
dsTable,dsAppliIfOpsTable, anddsIntTable. Currently, thedsIntTabletable is not implemented.
32.6.1.4 SNMP Security Configuration
SNMP security configuration depends on the version of SNMP you are using. This topic discusses security configuration for SNMP V1 and V2c, and V3.
32.6.1.4.1 SNMP Security Configuration: V1 and V2c
Under SNMP v1 and SNMP v2c, agents act as information servers, and the IP-based access control protects this information from unauthorized access. By default, the MIB 2605 is accessible in v1 and v2c by using the community string OUD@OUD. All managers are allowed to read the monitoring information exposed by the MIB 2605.
Note:
Only read access is authorized on the MIB 2605.You can configure SNMP v1 and SNMP v2c by setting the SNMP connection handler properties with the dsconfig command. Properties related to the SNMP v1 and SNMP v2c security configuration include:
-
allowed-manager -
community
SNMP v1 traps are sent on server startup and server shutdown. By default, these traps are sent to localhost and use the trap community string "OUD".
Note:
The default trap port might have to be changed to a value that is allowed by the system.SNMP traps are also configured by setting the SNMP connection properties with the dsconfig command. Properties related to SNMP traps include:
-
trap-port -
traps-community -
traps-destination
The ACL file that corresponds to the default values of the SNMP connection handler would be represented as follows:
acl = {
{
communities = OUD
access = read-only
managers = all
}
}
trap = {
{
traps-community = OUD
hosts = localhost
}
}
32.6.1.4.2 SNMP Security Configuration: V3
The SNMP v3 protocol provides more sophisticated security mechanisms than SNMP v1 and SNMP v2c. SNMP v3 implements a user-based security model (USM) that authenticates and encrypts the requests sent between agents and their managers, and provides user-based access control. A defaultUser template is provided for adding authorized users in the agent engine using the SNMP cloning mechanism.
Under SNMP v3, the community string described in the previous section is used as the "context" from which the MIB 2605 is registered. By default, the MIB2605 is accessible in v3 by using the context "OUD". All users have access to it.
The SNMP v3 UACL is configured by setting the SNMP connection handler properties with the dsconfig command-line utility. The properties related to SNMP v3 UACL configuration include:
-
community -
allowed-user -
security-level
The UACL file corresponding to the default values of the SNMP connection handler would be represented as follows:
uacl = {
{
context-names = OUD
access = read-only
security-level = authNoPriv
users = *
}
}
32.6.1.4.3 SNMP USM Configuration: V3
The USM MIB (that is, the MIB that defines allowed users) is registered in the null context and only a snmpAdmin user with a security level authNoPriv has read-write access to it. This snmpAdmin user can add additional users who can access the MIB 2605 information.
The SNMP v3 USM configuration is read from a template file that is located at INSTANCE_DIR/OUD/config/snmp/security/oud-snmp.security. The template file is not encrypted.
To access the MIB 2605 in the server agent, use the SNMP clone mechanism to add a user in the security file. Use snmpAdmin to send the SNMP request for the clone mechanism as shown here. The user to clone is defaultUser. The snmpAdmin and defaultUser users cannot access the MIB 2605 information.
-
Admin User to add and configure other users.
userEntry=localEngineID,snmpAdmin,null,usmHMACMD5AuthProtocol,passadmin
-
Template user to be cloned with no read or write access.
userEntry=localEngineID,defaultUser,,usmHMACMD5AuthProtocol,password,,,3,true
Note:
The security file is also used to make the users persistent.32.7 Monitoring a Replicated Topology
When directory server replication is enabled, changes made on one directory server are immediately propagated, or replicated, to multiple different directories in the topology.
You can monitor OUD replication status by using the dsreplication status command to obtain replication status information. If you enable a replication gateway server, you can monitor replication status for both OUD and ODSEE directory servers in the topology.
This section contains the following subsections:
-
Section 32.7.1, "Monitoring Basic OUD Replication Status Using
dsreplication" -
Section 32.7.2, "Monitoring Advanced OUD Replication Status Using
dsreplication"
For general information about how directory server replication works, see Chapter 7, "Understanding the Oracle Unified Directory Replication Model." For general information about using a replication gateway, see Section 1.4, "Overview of the Replication Gateway."
32.7.1 Monitoring Basic OUD Replication Status Using dsreplication
The simplest way to monitor replication on OUD is to use the dsreplication status command. This command provides a tabular view of the replication status, including the following information:
-
The topology and its connections
-
The latency between replicated servers
-
The data consistency across replicated servers
-
The security configuration between replicated servers
-
The replication protocol peer to peer
The examples in the remainder of this section assume the following simple replication topology.
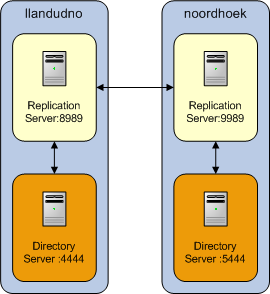
The following subsections describe how to retrieve basic replication status information:
-
Section 32.7.1.1, "To Return Minimal Basic Replication Status Information"
-
Section 32.7.1.2, "To Return Additional Basic Replication Status Information"
For information about more retrieving more in-depth information, see Section 32.7.2, "Monitoring Advanced OUD Replication Status Using dsreplication".
32.7.1.1 To Return Minimal Basic Replication Status Information
Run the following command:
$ dsreplication status --adminUID admin --adminPasswordFile pwd.txt -X \
 --hostname host1 --port 4444
The following information is displayed:
-
Server. Lists the LDAP servers in the topology and the port on which they are listening for LDAP connections.
-
Entries. Indicates the number of entries on each server for the specified base DN. If the information in this column is not the same across all the servers, the replication topology is not synchronized.
-
M.C. Indicates the number of updates already pushed by the other LDAP servers in the topology, but not yet replayed on the specified LDAP server. If this number is high on a particular server, investigate the latency of that server.
-
A.O.M.C. Specifies the approximate date of the oldest update pushed by the other directory servers in the topology, but not yet processed on the specified LDAP server.
-
Port. Indicates the port of the replication server (if any) that is configured in the instance. Usually the LDAP servers in the instance are connected to it.
-
Status. Indicates the status of the replication domain on this directory server.
For directory servers that contain data (replication domains), the status can be one of the following:
-
Normal. The connection to a replication server is established with the correct data set. Replication is working. If assured mode is used, then acknowledgements from this directory server are sent.
-
Late. The connection to a replication server is established with the correct data set. Replication is marked Late when the directory server has a number of missing changes above the threshold defined in the replication server configuration. When the number of changes goes below this threshold, the status will go back to Normal.
-
Full Update. The connection to a replication server is established and a new data set is received from this connection (online import), to initialize the local back end.
-
Bad Data Set. The connection to a replication server is established with a data set that is different from the rest of the topology. Replication is not working. Either the other directory servers of the topology should be initialized with a compatible data set, or this server should be initialized with another data set that is compatible with the other servers.
-
Not Connected. The directory server is not connected to any replication server.
-
Unknown. The status cannot be determined. This occurs mainly when the server is down or unreachable but it is referenced in the monitoring of another server.
-
Invalid. This is for internal use. If the directory server changes its state and the transition is impossible according to state machine, the INVALID_STATUS is returned.
When a directory server such as a replication server does not contain replicated data, or when you specify the
--expanded option, the replication server status can have the following values:-
Up. The replication server is up and running and is connected properly to the other servers.
-
Down. The replication server is not connected to other servers and is not running properly.
-
Unknown. The status cannot be determined. This occurs mainly when the OUD instance where the replication server is down or unreachable but the replication server is referenced in the configuration of another server.
-
32.7.1.2 To Return Additional Basic Replication Status Information
Run the following command:
$ dsreplication status --adminUID admin --adminPasswordFile pwd.txt -X \
 --hostname host1 --port 4444 --dataToDisplay compat-view
The resulting compat-view is the same view that was displayed in previous versions of OUD. In addition to the information described in Section 32.7.1.1, "To Return Minimal Basic Replication Status Information," the following information is also displayed:
-
Encryption. Indicates whether SSL encryption is enabled between the LDAP server and its replication server.
-
Trust. Indicates whether this server is configured as a trusted or untrusted server. For more information, see Section 29.12, "Using Isolated Replicas".
-
U.C. Specifies the number of changes that have been made on an untrusted server, and not yet replicated to the topology. For more information, see Section 29.12, "Using Isolated Replicas".
-
Change Log. Indicates whether the external change log is enabled for the base DN on this server. For more information, see Section 29.7, "Using the External Change Log".
-
Group ID. The ID of the replication group to which the server belongs. For more information, see Section 7.6, "Replication Groups".
-
Connected To. Displays the name, IP address and replication port of the replication server to which this directory server is connected.
32.7.2 Monitoring Advanced OUD Replication Status Using dsreplication
You can use the dsreplication enable command and its dataToDisplay option to track specific monitoring attributes. This provides you a more in-depth and comprehensive view of the replication status than the basic replication status information. Monitoring information is consolidated by replication servers. Therefore, monitoring information can only be retrieved by searching a directory server that hosts a running replication server.
The examples in the remainder of this section assume the following simple replication topology.
This section covers the following monitoring topics:
-
Section 32.7.2.1, "To Return a Comprehensive List of Available Replication Status Information"
-
Section 32.7.2.2, "To Monitor the Topology and Its Connections"
32.7.2.1 To Return a Comprehensive List of Available Replication Status Information
To return a list of all replication status attributes that can be displayed, including a short description for attribute, run the following command:
dsreplication status --advanced --listDataToDisplay
32.7.2.2 To Monitor the Topology and Its Connections
Each directory server contains a list of candidate replication servers for each replicated base DN. However, a directory server is connected to only one replication server at a time.
To obtain an overview of the replication topology and its connections, run the following command on any directory server in the topology that hosts a replication server:
bin/dsreplication status -X -p 4444 --adminPasswordFile /tmp/password.txt -n --dataToDisplay connected-to --dataToDisplay lost-connections
Establishing connections ...... Done.

dc=example,dc=com - Replication Enabled
=======================================
Server             : Port [1] : Connected To [2]   : L.C. [3]
-------------------:----------:--------------------:---------
host1:4444         : 8989     : host1:8989 (GID=1) : 0
host2:5444         : 9989     : host2:9989 (GID=1) : 0

[1] The replication port used to communicate between the servers whose contents are being replicated.
[2] The replication server this element is connected to with its group ID between brackets.
[3] Lost Connections.
The Connected To column indicates the replication server to which each directory server is currently connected for a particular base DN. Because all replication servers are permanently connected to all other replication servers, the Connected To column does not list replication servers.
The Lost Connections (L.C.) column indicates the number of connection breaks between directory servers and replication servers. The value indicated for each directory server should be close to the number of times that replication has been stopped on that server. If the value of this attribute is much higher, there are unexpected connection losses that must be investigated.
32.7.2.3 To Monitor Replication Latency
Monitoring replication latency enables you to establish whether a specific replication server is lagging behind other servers in the topology. This provides a complete view of any replication delays and the current quality of service.
To monitor replication latency, run the following search on any server in the topology that hosts a replication server:
bin/dsreplication status -X -p 4444 --adminPasswordFile /tmp/password.txt -n --dataToDisplay missing-changes --dataToDisplay aoomc
Establishing connections ..... Done.

dc=example,dc=com - Replication Enabled
=======================================
Server             : M.C. [1] : A.O.M.C. [2] : Port [3]
-------------------:----------:--------------:---------
host1:4444         : 0        : N/A          : 8989
host2:5444         : 0        : N/A          : 9989

[1] The number of changes that are still missing on this element (and that have been applied to at least one other server).
[2] Age of oldest missing change: the age (in seconds) of the oldest change that has not yet arrived on this element.
[3] The replication port used to communicate between the servers whose contents are being replicated.
In this example, the age of oldest missing change (A.O.M.C.) is expressed as the number of seconds since the command was run and the oldest update was pushed by the other directory servers in the topology. The oldest update may not yet be processed on the specified directory server.
The Missing Changes (M.C.) column specifies the number of updates already pushed by the other directory servers in the topology, but not yet replayed on the specified directory server.
Note:
If the replication latency, as defined by these attributes, is high, look at the number of updates sent and received to identify the servers in the topology that are causing the latency. These attributes are described later in this document.32.7.2.4 To Monitor Data Consistency
Monitoring data consistency enables you to establish whether each replication server in the topology is synchronized and up-to-date with the latest changes that have occurred in the topology.
If data is not consistent, Bad Data Set is indicated in the Status column. To see the generation IDs, run the following command:
bin/dsreplication status -X -p 4444 --adminPasswordFile /tmp/password.txt -n --dataToDisplay status --dataToDisplay generation-id
Establishing connections ......... Done.

dc=example,dc=com - Replication Enabled
=======================================
Server             : Port [1] : Status [2]   : Gen. ID [3]
-------------------:----------:--------------:------------
host1:4444         : 8989     : Bad Data Set : 19399981
host2:5444         : 9989     : Normal       : 19399981

[1] The replication port used to communicate between the servers whose contents are being replicated.
[2] The status of the replication on this element.
[3] The generation ID: the version of the data in each replicated base DN, for each directory server.
The Generation ID (Gen. ID) column indicates the version of the data in each replicated base DN, for each directory server. Note that the generation ID on all servers for the base DN dc=example,dc=com is 19399981. The consistency of the Generation IDs means that the data on those servers is the same for that base DN.
Each directory server is also aware of the Generation ID of the replication server to which it is connected. The Generation ID of a replication server relates to the updates that are stored in its change log database for that base DN.
Replication is considered to be working correctly between two directory servers, for a specified base DN, when those servers and their replication server all have the same generation ID.
32.7.2.5 To Monitor Replication Security
A secure replication topology has SSL encryption enabled between servers, for a particular base DN.
To monitor replication security, run the following command on any server in the topology that hosts a replication server:
bin/dsreplication status -X -p 4444 --adminPasswordFile /tmp/password.txt -n --dataToDisplay secure-conf
Establishing connections ......... Done.

dc=example,dc=com - Replication Enabled
=======================================
Server             : Port [1] : Encryption [2]
-------------------:----------:---------------
host1:4444         : 8989     : Disabled
host2:5444         : 9989     : Disabled

[1] The replication port used to communicate between the servers whose contents are being replicated.
[2] Whether the replication communication initiated by this element is encrypted or not.
The Encryption column indicates whether the SSL protocol is enabled or disabled between two servers for a specified base DN. This information is available for each directory server or replication server. Authentication of replication sessions is not monitored.
You can configure the servers to use an encrypted communication using dsreplication enable interactively, or using the following two arguments:
--secureReplication1-
Specifies whether or not the replication communication established from the first server is encrypted or not. This option will only be taken into account the first time replication is configured on the first server
--secureReplication2-
Specifies whether or not the replication communication established from the second server is encrypted or not. This option will only be taken into account the first time replication is configured on the second server.
32.7.2.6 To Monitor Replicated Updates
Monitoring the number of updates that have been sent and received by the servers in a topology provides an indication of how well replication is working.
To monitor sent and received updates, run the following command:
bin/dsreplication status -X -p 4444 --adminPasswordFile /tmp/password.txt -n --dataToDisplay sent-updates --dataToDisplay received-updates --dataToDisplay send-window
Establishing connections ......... Done.

dc=example,dc=com - Replication Enabled
=======================================
Server             : Port [1] : R.U. [2] : S.U. [3] : S.W. [4]
-------------------:----------:----------:----------:---------
host1:4444         : 8989     : 0        : 0        : 100
host2:5444         : 9989     : 0        : 0        : 100

[1] The replication port used to communicate between the servers whose contents are being replicated.
[2] Received updates.
[3] Sent updates.
[4] Send window between this element and the replication server it is connected to.
The Send Updated (S.U.) column indicates the number of updates that have been sent by this directory server or replication server.
The Received Updates (R.U.) column indicates the number of updates that have been received by this directory server or replication server.
The values of these attributes assist in determining the flow of updates within a topology. When replication appears to be very slow, it is helpful to monitor these attributes. If the number of updates sent by one server is consistently much higher than the number of updates received by another server, it is likely that the second server is a bottleneck in the topology.
The replication protocol controls the flow of updates between two servers. This ensures that when a high number of updates is exchanged between two servers, the servers are not prevented from processing operations with a higher priority. This functionality relies on a window mechanism where the recipient server periodically provides the sending server with the number of updates that the sending server can send.
You can specify the size of the send and receive windows, by setting the max-send-window and max-rcv-window configuration attributes. For more information, see Section 29.5, "Modifying the Replication Configuration With dsconfig".
32.7.2.7 To Monitor Replication Conflicts
When multiple operations are performed on the same entry at the same time, replication conflicts can occur. In some cases, the replication mechanism is able to resolve these conflicts. In other cases, manual conflict resolution is required.
Three types of conflict attributes can be monitored:
-
unresolved-naming-conflicts. Indicates the number of naming conflicts that could not be resolved by the replication mechanism. -
resolved-naming-conflicts. Indicates the number of naming conflicts that have been resolved. -
resolved-modify-conflicts. Indicates the number of modify conflicts that have been resolved.
To monitor resolved and unresolved replication conflicts, run the following command:
bin/dsreplication status -X -p 4444 --adminPasswordFile /tmp/password.txt -n --dataToDisplay resolved-naming-conflicts --dataToDisplay unresolved-naming-conflicts --dataToDisplay resolved-modify-conflicts
Establishing connections ...... Done.

dc=example,dc=com - Replication Enabled
=======================================
Server             : Port [1] : R.N.C. [2] : U.N.C. [3] : R.M.C. [4]
-------------------:----------:------------:------------:-----------
host1:4444         : 8989     : 0          : 0          : 0
host2:5444         : 9989     : 0          : 0          : 0

[1] The replication port used to communicate between the servers whose contents are being replicated.
[2] Resolved Naming Conflicts.
[3] Unresolved Naming Conflicts.
[4] Resolved Modify Conflicts.
32.7.3 Monitoring OUD and ODSEE Replication Status in Deployments Using Replication Gateways
A replication gateway is a server that translates and propagates replication information among Oracle Directory Server Enterprise Edition servers and Oracle Unified Directory servers in a replicated topology. Translations are managed "on the fly" without storing any data on disk. When a replication gateway is deployed, you can use the OUD dsreplication command or the ODSEE console to monitor replication status information.
For general information about using a replication gateway, see Section 1.4, "Overview of the Replication Gateway."
32.7.3.1 Using dsreplication to Monitor Changes Made on the OUD Topology
You can use dsreplication to monitor how changes made on the OUD topology are propagated through the replication gateway to the ODSEE topology.
The following example illustrates how to monitor sent and received updates on the OUD topology. Figure 32-4 shows the results returned when the following command is run:
# dsreplication status -d compat-view
Figure 32-4 Results for dsreplication status with a Replication Gateway Deployed
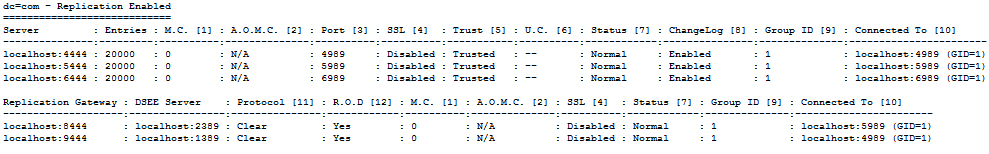
Description of ''Figure 32-4 Results for
dsreplication status with a Replication Gateway Deployed''These results are explained in the additional information also returned by the command:
[1] The number of changes that are still missing on this element (and that have been applied to at least one other server).
[2] Age of oldest missing change: the age (in seconds) of the oldest change that has not yet arrived on this element.
[3] The replication port used to communicate between the servers whose contents are being replicated.
[4] Whether the replication communication initiated by this element is encrypted or not.
[5] Whether the directory server is trusted or not. Updates coming from an untrusted server are discarded and not propagated.
[6] The number of untrusted changes. These are changes generated on this server while it is untrusted.
    Those changes are not propagated to the rest of the topology but are effective on the untrusted server.
[7] The status of the replication on this element.
[8] Whether the external change log is enabled for the base DN on this server or not.
[9] The ID of the replication group to which the server belongs.
[10] The replication server this element is connected to with its group ID between brackets.
[11] The protocol used by the replication gateway to connect to the DSEE server.
[12] Replicate OUD Changes to DSEE
32.7.3.2 Using the DSCC to Monitor a Replication Gateway
DSEE 6.x and ODSEE 11g directory servers provide a monitoring tool within Directory Service Control Center (DSCC). You can configure an OUD replication gateway server to work with the DSCC and its related tool dsccmon. This enables you to monitor changes that have been made on the ODSEE servers and replicated to the OUD topology.
Once you have installed and configured the replication gateway, the DSCC displays the following information in the Directory Servers panel:
-
In the Servers tab, the replication gateway is displayed as an ODSEE server. The Description field indicates that the ODSEE server is the OUD replication gateway, and provides the real version of the replication gateway server. The port number, the instance path, and status of the server are also displayed.
-
In the Suffixes tab, the replication gateway is displayed with no entries and no replication agreement. This indicates the OUD topology access point. Here you can monitor the state of the OUD topology and the changes done on the ODSEE servers.
-
In the Replication Agreements tab, the replication gateway is one of the destination servers. After the replication gateway has been set up, replication monitoring begins when at least one change has been done on the ODSEE topology.
-
The replication gateway is also displayed in the View Topology drawing.
Important: While DSCC enables you to view the OUD replication gateway, it does not enable you to perform administrative operations such as starting stopping, or configuring the OUD replicating gateway server.
For information about setting up the Replication Gateway, see the Installation Guide.
32.8 General Purpose Enterprise Monitoring Solutions
You can use a variety of general UNIX tools to monitor your server environment. For information about these tools, see the man pages on your UNIX system.
32.8.1 General UNIX Monitoring Tools
The following general purpose UNIX monitoring tools can be used with Oracle Unified Directory.
| Tool | Description |
|---|---|
iostat |
Provides information about disk I/O and CPU usage. |
lsof |
Provides information about open file descriptors. |
lslk |
Provides information about file system locks. |
netstat |
Provides statistics about network functions. |
nslookup |
Allows you to query DNS servers for information about hosts and domains. |
ping |
Allows you to query the status of a remote host or network gateway. |
sar |
UNIX System V performance monitoring tool. |
tcpdump |
Allows you to debug and monitor network traffic. |
top |
Provides quick, easy monitoring of processes and CPU activities. |
trace |
Provides information about which system calls a process makes. |
traceroute |
Provides the path a packet takes throughout the Internet to reach its final destination. |
vmstat |
Provides statistics about process, virtual memory, disk, trap, and CPU activity. |
32.8.2 Solaris Monitoring Tools
The following Solaris monitoring tools can be used with Oracle Unified Directory.
| Tool | Description |
|---|---|
lockstat |
Provides information about OS and application locking. Requires DTrace privileges. |
mpstat |
Provides statistics about each processor on the system. |
pmap |
Provides a breakdown of how much memory a process is using. |
proctool |
Monitors processes and threads. |
snoop |
Monitors network traffic. Indispensable when debugging low-level packets. |
SymbEL/Virtual\\Adrian |
Provides functionality of the above listed tools and more. |
truss |
Provides information about which system calls a process makes. |
32.8.3 HP-UX Monitoring Tools
The following HP-UX monitoring tools can be used with Oracle Unified Directory.
| Tool | Description |
|---|---|
glance |
Provides detailed system information about open file descriptors, locks, and threads. |
gpm |
GlancePlus is a graphical real-time performance diagnostic tool. Glance is the character-based component. |
tusc |
Provides a system call trapper. |
sysdef |
Provides information about kernel parameters. |
landiag |
Monitors network statistics. |
sam |
Provides a general system administration tool. |