| Oracle® Pulse for the Managed Cloud User's Guide Release 4.0 for all platforms E27009-01 |
|
|
PDF · Mobi · ePub |
| Oracle® Pulse for the Managed Cloud User's Guide Release 4.0 for all platforms E27009-01 |
|
|
PDF · Mobi · ePub |
The Customer Dashboard shows key information across all your organization's Managed Cloud Services and associated environments.
Oracle Pulse opens on the Customer Dashboard, which shows overall service health for your organization's Oracle Managed Cloud Services. Service health is measured through the availability of services and environments and the response times for critical business transactions.
The Customer Dashboard Overview summarizes availability by service and by environment, historical storage usage, and (where business transaction monitoring (BTM) has been set up) a performance summary for critical business transactions.
Track storage usage compared to your entitlement, as well the amount of database and non-database storage all services have used, under the Storage option in the navigation bar. The Recommendations option shows all pending, implemented, or rejected recommendations that have been made for any environment associated with your organization's Managed Cloud Services, based on regular assessments. It also indicates why pending recommendations are necessary and the possible consequences if they are not implemented.
If BTM has been set up, the Transactions option is displayed. You can see the average transaction performance over the last 24 hours, and compare this performance to the 30 day average and to the lower threshold value. You can also compare this value with the transaction performance 7 days ago. You can also view service requests (SRs) reports under Incidents and requests for change (RFCs) reports under Changes.
Note:
As SRs are often logged without reference to the service or environment, these customer level reports provide the most complete picture of SRs for your organization.Associating all SRs logged for your organization with the correct service and environment will result in more complete SR reports at the service and environment levels.
Additionally, three global options have been moved to the Customer Dashboard. Contacts displays all contacts in your organization and in Oracle that are associated with your organization's Managed Cloud Services. You can filter the list displayed to show different groups or search for individual contacts. All active and historical notifications for your organization's Managed Cloud Services can be viewed on the Notifications screen, including those that were dismissed at sign in. Finally, the Catalog option provides a list of all Oracle Managed Cloud Services current service offerings, with released versions and modules.
Viewing Customer Recommendations
View any of these widgets on the Customer Dashboard Overview:
All widgets are displayed in full screen mode.
Production Availability by Service
This widget shows the percentage availability of all your organization's live, production Managed Cloud Services, over the selected time interval. Availability is calculated based on complete outages and does not include service interruptions. Toggle between the chart view and the data view using the symbol in the bottom right corner.
Chart View: The chart view, showing the percentage availability of all services, is calculated from the sum of availability percentages for all production environments in that service. Availability of services in implementation phase is not included. If a service is not displayed in this chart, you can check the service phase and Go Live dates in the table at the bottom of the home screen.
Data View: The data view shows all outages for a given service, including the environment, service request (SR) number, and outage type and category. It also lists the outage start and end times and the time to restore the outage. The problem summary, which the SDM has reviewed, describes the reasons for the outage and any other relevant information.
Production Availability by Environment
This widget shows the percentage availability of every production environment associated with all of your organization's Managed Cloud Services. Availability is calculated based on complete outages and does not include service interruptions.
Chart View: The chart view shows the downtime and percentage availability for every production environment from all your organization's Managed Cloud Services over the selected time interval.
Data View: The data view shows production outages for all environments from your organization's Managed Cloud Services. It shows all environments for each service, the service request (SR) number associated with the outage, and the outage type and category. It also lists the outage start and end times and the time to restore the outage. The problem summary describes the impact and root cause of the outage and any other relevant information.
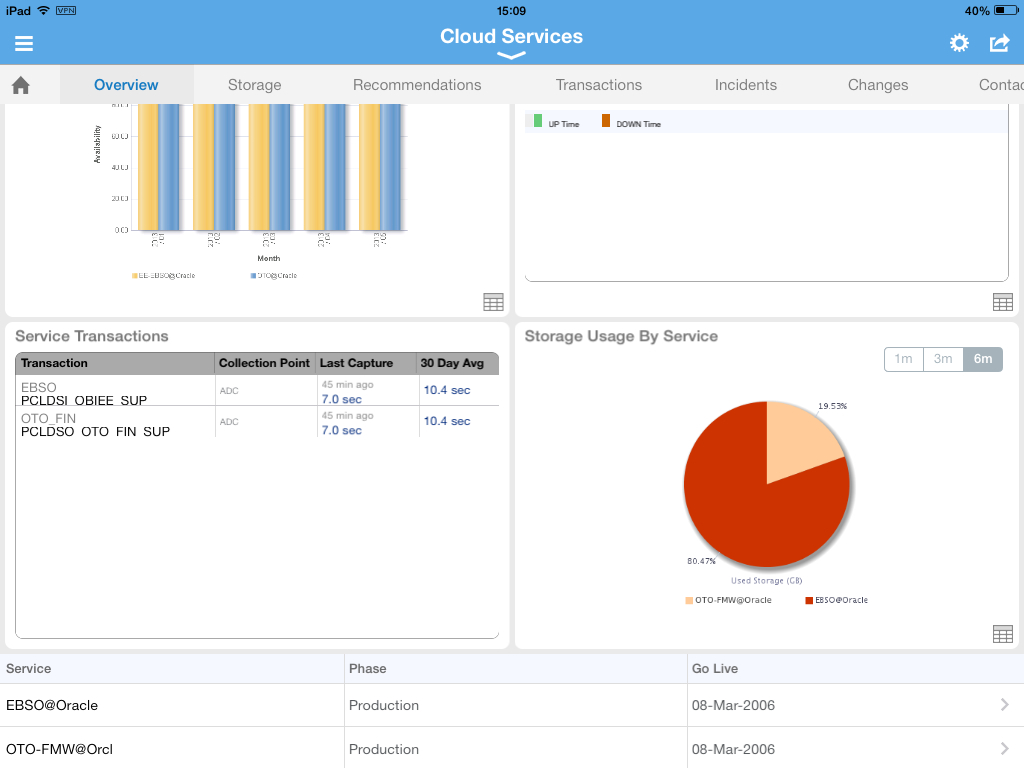
This widget shows a summary of all monitored transactions for all your organization's Managed Cloud Services, grouped by service. Tap the Transactions option on the navigation bar to see the full transactions table.
Transaction response times give a sense of the performance of your services and environments and can indicate potential or actual issues. Your Oracle Service Delivery Manager (SDM) can work with you to identify these transactions and set up monitoring.
Note:
Where Business Transaction Monitoring (BTM) has been implemented, the Service Transactions widget displays populated transactions reports.If BTM has not been implemented, the Transactions option is hidden.
You cannot flip the Service Transactions widget.
One or more beacons measure the response time of each monitored transaction. You can view the last time data was collected from the beacon(s) and compare the current value with the 30 day average.
Each transaction record shows:
| Field | Description |
|---|---|
| Transaction Name | Name of the transaction being monitored |
| Collection Point | Name of the beacon(s) from which data is collected as part of monitoring |
| Last Collection | Time of the last data collection from the beacon(s) |
| 30 Day Average | Average transaction time over the last 30 days |
This widget shows the percentage of storage used by each of your organization's Managed Cloud Services. Your storage entitlement is usually allocated as needed across all services. The Storage Usage chart can be useful in identifying services that are consuming a disproportionate amount of storage.
Chart View: The chart view shows a breakdown of storage usage by service, as a percentage of total storage usage, for all your organization's Managed Cloud Services.
Data View: The data view lists all your organization's Managed Cloud Services. It displays the number of environments for each service, the total storage used by the environment, and the percentage of total storage that the service uses.
Viewing Customer Recommendations
Tap the Storage option on the navigation bar to see storage usage across all your organization's Managed Cloud Services and associated environments.
View any of these widgets on the Customer Dashboard Storage screen:
Double tap any of the widgets to expand to full screen mode. Toggle between the chart view and the data view using the chart and table symbols respectively in the bottom right corner of the widget.
Scroll up to view hidden widgets and the record table at the bottom of the screen. The table contains service records showing phases and go live dates for all your organization's Managed Cloud Services. Tap any service record to open the Service Dashboard.
This widget shows the percentage of storage used by each of your organization's Managed Cloud Services. Your storage entitlement is usually allocated as needed across all services. The Storage Usage chart can be useful in identifying services that are consuming a disproportionate amount of storage.
Chart View: The chart view shows a breakdown of storage usage by service, as a percentage of total storage usage, for all your organization's Managed Cloud Services.
Data View: The data view lists all your organization's Managed Cloud Services. It displays the number of environments for each service, the total storage used by the environment, and the percentage of total storage that the service uses.
Storage Usage versus Entitlement
This widget shows overall storage usage for all your organization's Managed Cloud Services compared with your current entitlement, over the selected time interval.
Chart View: The chart view shows overall storage usage for all your organization's Managed Cloud Services compared with your current entitlement, over the selected time interval.
Data View: The data view provides detailed information about the total storage usage for each service, showing storage used per associated environment, category, and subcategory, for all your organization's Managed Cloud Services.
This widget shows the storage used by databases for all your organization's Managed Cloud Services.
Chart View: The chart view shows the storage consumed by databases for all your organization's Managed Cloud Services.
Data View: The data view provides detailed information about the storage used by databases for all your organization's Managed Cloud Services, per associated environment, category, and subcategory.
This widget shows the storage consumed by the application and database code trees and log files for all your organization's Managed Cloud Services.
Chart View: The chart view shows the storage consumed the storage consumed by the application and database code trees and by log files for all your organization's Managed Cloud Services.
Data View: The data view provides detailed information about the storage consumed by the application and database code trees and by log files for all your organization's Managed Cloud Services, per associated environment, category, and subcategory.
Requesting Additional Storage (iPad Only)
(on iPad, you have the option to request additional storage by e-mail.
From the Other Actions in the top right select Request Additional Storage then submit your request.
Note:
This option is available only on iPad.If you require additional storage but this option is not available, log an SR. Your SDM can provide more information about the process.
Tap the Recommendations option on the navigation bar to see recommended changes across all services and environments for all your organization's Managed Cloud Services.
Recommendations are actions that you can choose to take to improve performance, security, or other aspects of a service or environment. Drawn directly from a Managed Cloud Services repository of optimal configurations, recommendations are generated as part of periodic maintenance on environments.
You can filter the recommendations listed by time interval and by type. Tap the time interval, such as year to date (YTD), then select the recommendation type from the list:
Current - These recommendations have been approved by a planner and presented to you in an RFC. If approved, the RFC will be applied to the named environment.
Implemented - These recommendations have been applied to the named environment.
Rejected - These recommendations have been presented in RFCs but have been rejected and therefore were not applied to the named environment.
The following information is displayed for each recommendation:
| Name | Description |
|---|---|
| Recommended On | The date on which the recommendation was presented to you. |
| Category | One of the following recommendation categories:
|
| Environment | The named environment to which this recommendation applies |
| RFC | The request for change (RFC) related to this recommendation, if any. |
Tap the Transactions option on the navigation bar to see the full transactions table for your Managed Cloud Services.
Transaction response times give a sense of the performance of your services and environments and can indicate potential or actual issues. Your Oracle Service Delivery Manager (SDM) can work with you to identify these transactions and set up monitoring.
Note:
The Transactions option is displayed on the navigation bar only for services where business transaction monitoring (BTM) has been implemented.If BTM has not been implemented, the Transactions screen is hidden.
Your Oracle Service Delivery Manager (SDM) can work with you to identify these transactions and set up monitoring.
Each transaction record shows the last data collection date and the data collection point(s). You can compare the current value with the 30 day average and with the lower threshold value for this transaction.
Each record displays:
| Field | Description |
|---|---|
| Transaction Name | Name of the transaction being monitored |
| Collection Point | Name of the beacon(s) from which data is collected as part of monitoring |
| Last Collection | Time of the last data collection from the beacon(s) |
| 30 Day Average | Average transaction time over the last 30 days |
| Threshold | Lowest acceptable performance threshold for this transaction |
To understand the historical performance of any transaction, tap the transaction record listed under the Transaction option on the Customer Dashboard. You can select the date from which transaction performance will be measured and choose a measurement interval.
Select the start date using the date picker. (This date must be at least 24 hours earlier than the current date.)
Then select one of the following time intervals:
24 hours: Shows the average of all data collections over the past 24 hours, compared to the historical median and lower threshold of acceptable performance.
7 days: Shows the average of all hourly collections over the past 7 days, compared to the historical median and lower threshold of acceptable performance.
30 days: Shows the average of all daily collections over the past 30 days, compared to the historical median and lower threshold of acceptable performance.
In the chart view, tap the table symbol in the bottom right corner of the widget to flip to the data view. In this view, you can also select the date from which transaction performance will be measured and choose a measurement interval.
Select the start date using the date picker. (This date must be at least 24 hours earlier than the current date.)
Then select one of the following time intervals:
24 hours: Shows the values for all data collections over the past 24 hours, compared to the historical median and lower threshold of acceptable performance.
7 days: Shows the values of all hourly collections over the past 7 days, compared to the historical median and lower threshold of acceptable performance.
30 days: Shows the values of all daily collections over the past 30 days, compared to the historical median and lower threshold of acceptable performance.
Tap the Incidents option on the navigation bar to see service request (SR) reports for all your organization's Managed Cloud Services.
Note:
To view Incidents, your My Oracle Support (MOS) account must have view SR privileges.SRs are created and maintained in My Oracle Support (MOS). All SR information in Oracle Pulse is drawn from the MOS database. Customer level incident reports provide the most complete picture of your organization's SRs because many SRs are logged without reference to a service or environment. You can improve the accuracy of service level and environment level reports by ensuring that you associate each SR with a service or environment as appropriate.
View any of these widgets on the Customer Dashboard Incidents screen:
Double tap any of the widgets to expand to full screen mode. Toggle between the chart view and the data view using the chart and table symbols respectively in the bottom right corner of the widget. You can also see individual incident records listed at the bottom of the screen.
Scroll up to view hidden widgets and the record table at the bottom of the screen. The table contains incident records summarizing SRs for all your organization's Managed Cloud Services. Tap any record to open the change/RFC summary.
Created versus Closed Incidents
This widget shows the rate of SR closure for all your organization's Managed Cloud Services.
Chart View: The chart view compares the number of SRs created with the number of SRs closed for each month over the selected time interval, indicating the rate of SR closure for all your organization's Managed Cloud Services.
Data View: The data view shows detailed records for all SRs, open and closed, for all your organization's Managed Cloud Services.
This widget shows the number of SRs created for all your organization's Managed Cloud Services over the selected time interval, grouped by time elapsed since they were raised.
Chart View: The chart view shows the number of SRs created for all your organization's Managed Cloud Services in each month over the selected time interval. SR counts are presented in color coded bands that indicate the time elapsed since SR creation:
7 days or less
8 to 30 days
31 to 60 days
61 to 90 days
91 days or more
SRs that were open during the month, but have been closed since then, are included in the monthly count.
Data View: The data view shows detailed records for all SRs, open and closed, for all your organization's Managed Cloud Services.
This widget shows the number of incidents created for all your organization's Managed Cloud Services.
Chart View: The chart view shows the number of incidents created for each product associated with your organization's Managed Cloud Services, in each month of the selected time interval. Color coding indicates the SR priority, which is determined in MOS as critical, significant or standard.
Data View: The data view shows detailed records for all SRs, open and closed, for all your organization's Managed Cloud Services.
In the lower part of the screen, each incident record displays the name, status, and associated product for the SR. Tap any incident record at the bottom of the screen to see the full incident record.
Each record shows the following information, which is drawn from the MOS database:
| Field | Description |
|---|---|
Name, including
|
Identifying information about this SR, including:
|
| Status | Status of this SR from MOS:
|
| Product | Name of the product associated with this SR in MOS. |
| Updates | All the latest actions related to this SR. |
| Summary | MOS summary information for this SR, such as the status and the severity. |
To filter the incidents, select a filter from the list:
All Incidents lists all incident records for all your Managed Cloud Services
All Open Incidents lists all open SRs for all your Managed Cloud Services
Closed Requests lists all SRs for all your Managed Cloud Services
To search for an incident, enter the search criteria in the Search field, located in the toolbar of the incident record table. Partial strings are auto-completed. Tap the search icon to see all incident records containing the string.
Tap any incident name to see the detailed record, showing the incident summary and any updates. Tap the arrow in the top left to return to the Incidents screen.
Tap the Changes option on the navigation bar to see reports of requests for change (RFCs) across all services and environments for all your Managed Cloud Services.
Note:
To view Changes, your My Oracle Support (MOS) account must have view RFC privileges.View any of these widgets on the Customer Dashboard Changes screen:
Double tap any of the widgets to expand to full screen mode. Toggle between the chart view and the data view using the chart and table symbols respectively in the bottom right corner of the widget.
Scroll up to view hidden widgets and the record table at the bottom of the screen. The table contains changes records summarizing RFCs for all your organization's Managed Cloud Services. Tap any record to open the change/RFC summary.
Created versus Applied Changes
This widget shows the number of RFCs created for, and the number applied to all your organization's Managed Cloud Services, indicating the rate of change.
Chart View: The chart view shows the number of RFCs created for, and the number applied to, environments and services for all your organization's Managed Cloud Services during the selected time interval. If no RFCs were created for or applied to, the chart is empty.
Data View: The data view lists all RFCs that have been created for or applied to all your organization's Managed Cloud Services.
This widget shows all RFCs, listed by RFC type, that have been applied to environments and services for all your organization's Managed Cloud Services.
Chart View: The chart view shows all RFCs, listed by RFC type, that have been applied to all your organization's Managed Cloud Services. RFC types are defined in My Oracle Support (MOS).
Data View: The data view lists all RFCs that have been applied to all your organization's Managed Cloud Services.
Applied Changes: Production versus Non-Production
This widget compares rates of change in production and non-production environments for all your organization's Managed Cloud Services.
Chart View: The chart view shows the number of RFCs applied to production environments, to non-production environments, and to all environments associated with all your organization's Managed Cloud Services, for each month in the selected time interval.
Data View: The data view lists all RFCs that have been created for or applied to all your organization's Managed Cloud Services.
Applied Changes by Environment
This widget shows the RFC count for each environment.
Chart View: The chart view shows the RFC count for every environment associated with all your organization's Managed Cloud Services, for the selected time interval.
Data View: The data view lists all RFCs that have been created for or applied to all your organization's Managed Cloud Services.
Records for all RFCs created for your organization's Managed Cloud Services are listed at the bottom of the screen. Each record displays the following information.
| Field | Description |
|---|---|
Name, including
|
Identifying information about this RFC, including:
|
| Environment | Environment associated with this RFC. |
| Status | Status of this RFC from MOS:
|
| Schedule | Time and date for which this RFC is scheduled, in the format YYYY-MM-DD HH:MiMi where YYYY is the year, MM is the month, DD is the day, HH is the hour, and MiMi is the minute. |
| Activities | All the latest activities related to this RFC. |
| Summary | MOS summary information for this RFC, such as the status and the severity. |
Tap any record at the bottom of the screen to see the full RFC summary.
To filter the change records displayed, select a filter from the list:
All Changes lists all change records for all your organization's Managed Cloud Services
All Open lists all open RFCs for all your organization's Managed Cloud Services
Ready for Scheduling/Approval lists all RFCs for all your organization's Managed Cloud Services that are ready for scheduling or awaiting your approval.
Recently Updated lists all RFCs for tall your organization's Managed Cloud Servicesthat have been updated recently.
To search for a change record, enter the search criteria in the Search field, located in the toolbar of the change record table. Partial strings are auto-completed. Tap the search icon to see all change records containing the string.
Tap Contacts to see all contacts associated with your organization's Managed Cloud Services.
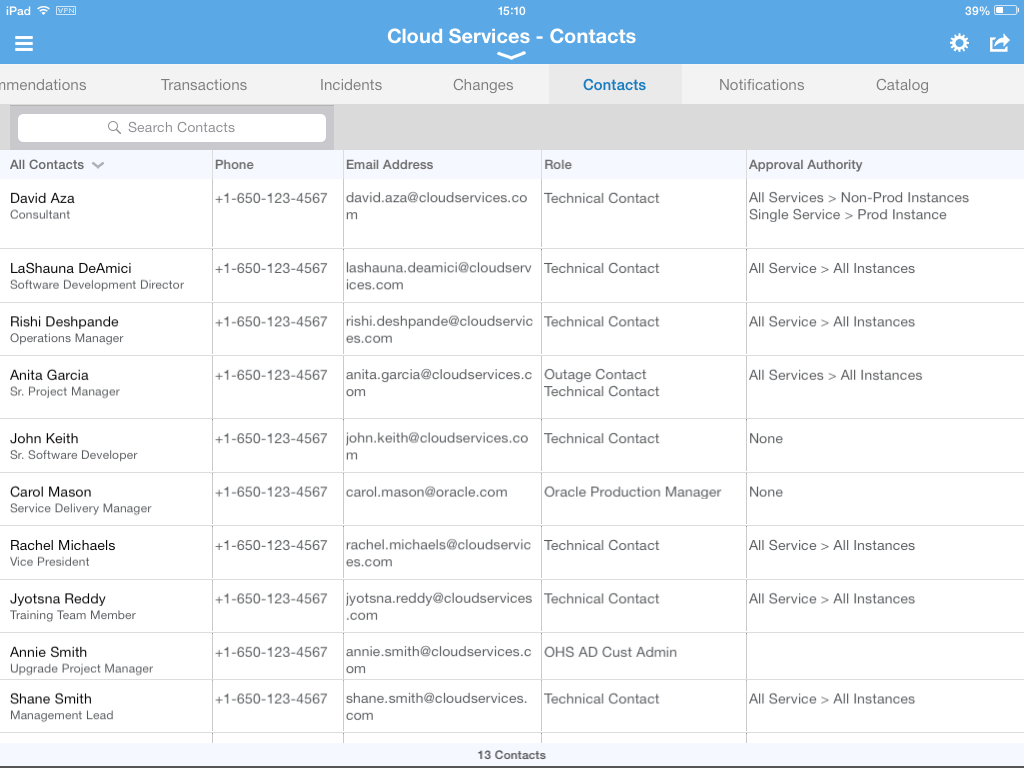
Contacts include users from your organization and all Oracle personnel associated with your organization's Managed Cloud Services. Your customer user administrator authorizes approvers and defines the scope of approval authority. Your SDM and your customer user administrator maintain these records.
The following information is displayed for each contact record:
| Field | Description |
|---|---|
| Contact Name | Full name of this contact. |
| Phone | Phone number for this contact |
| E-mail Address | E-mail address for this contact. |
| Role | Role for this contact. |
| Authority | Approval authority assigned to the contact by your Oracle SDM or service delivery team. |
To search for a contact, enter the search criteria in the Search field, located in the top left of the Contacts screen. Partial strings are auto-completed. Tap the search icon to see all incident records containing the string.
You can filter the displayed records using the following options on the navigation bar:
All Contacts displays all contacts associated with your organization's Managed Cloud Services, from both Oracle and your organization.
Approvers displays contacts who have the authority to approve requests for change (RFC). The customer user administrator defines the scope of this approval authority.
My Organization displays all contacts from your organization associated with your organization's Managed Cloud Services.
Service Delivery Team displays all Oracle personnel associated with your organization's Managed Cloud Services.
Notifications inform you about newly available software versions, any upcoming maintenance and outages, and any service interruptions that occurred in your Oracle Managed Cloud Services.
Active notifications have not yet reached their expiry dates.
Historical notifications have passed their expiry date or have been dismissed.
Your Oracle SDM manages all your notifications, creating the necessary messages and setting an expiry date for each notification.
Once you sign in to Oracle Pulse, all active notifications for your Oracle Managed Cloud Services are displayed, ordered by notification creation date.
Note:
Each notification displays the date on which the notification was created. The event date is listed in the description.At sign in, all active notifications for your Oracle Managed Cloud Services are displayed by default. Notifications are ordered by creation date, which is listed in the top right corner. You can also scroll down to see earlier active notifications.
By checking Do not show again for one or more notifications you can ensure they are not displayed the next time you sign in.
You can see all active and historical notifications for your Oracle Managed Cloud Services by tapping the Notifications option on the Customer Dashboard:
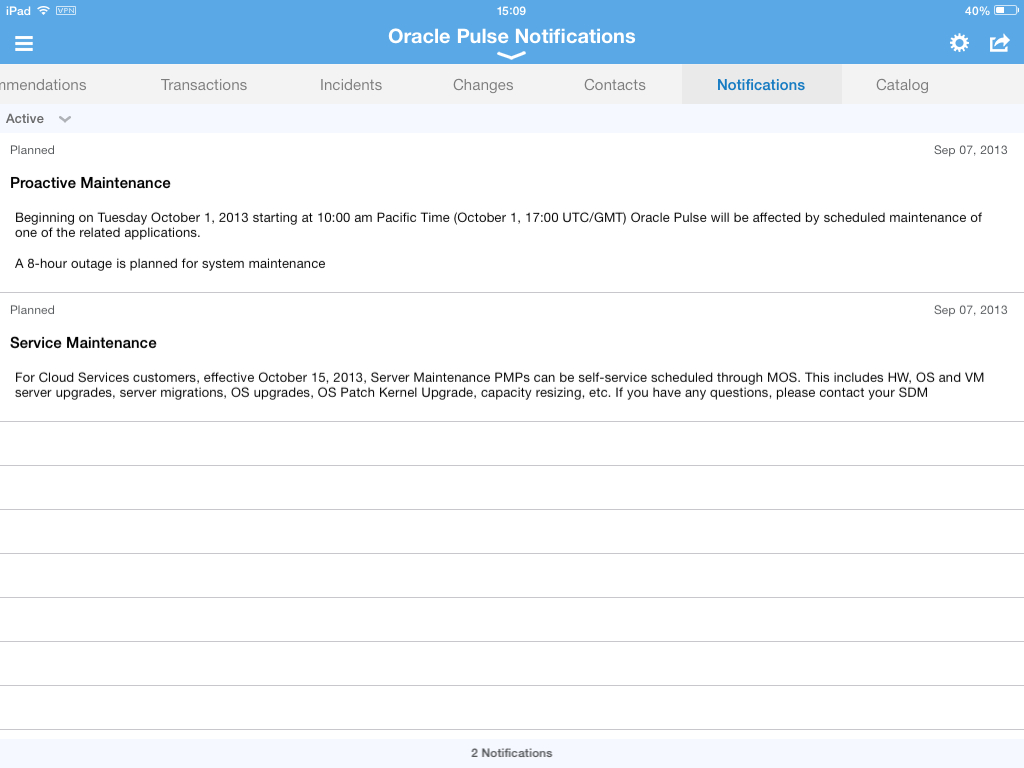
Each notification record provides the following information:
Planned/Unplanned indicates whether this event is planned or unplanned. For example, a scheduled outage for maintenance or a new software release are planned events. An unexpected outage is an unplanned event.
Event Type indicates the type of event in question. Examples include:
New Software Release, announcing a new release of Oracle Pulse software.
Proactive Maintenance, announcing a scheduled maintenance outage to proactively address issues.
Description provides a full description of the event in question, typically including the event date, the start and end times, the systems or areas affected, the reasons for the event, and any other relevant details.
Date shows the date on which this notification was created. The event date is listed in the description.
Tap the Catalog option on the Customer Dashboard to see the full Oracle Managed Cloud Services catalog. The catalog lists all service offerings by Oracle product, outlining the supported product release or service revision and associated modules.
You can also see service offerings that are not yet on general availability using the PreGeneral Availability option at the bottom of the product list. Additionally you can browse the various options available for each service, such as load testing and regression testing.
|
Copyright © 2013, Oracle and/or its affiliates. All rights reserved. Legal Notices |
|