How to Install the Preflight Checker
-
Create a directory for the Preflight Checker.
# mkdir /export/home/preflightcheck/app1
-
Download the Oracle Solaris Preflight Checker installable zip file from
the Oracle Solaris Preflight Applications Checker
download page.
- For SPARC systems, download PreflightCheckerTool-v11-2-0-SPARC.zip.
- For x86 systems, download PreflightCheckerTool-v11-2-0-X86.zip.
-
Unzip the downloaded file in the new directory.
For example:
# unzip PreflightCheckerTool-v11-2-0-SPARC.zip
-
Run the setup script to install the application and provide the location
where you want to save the final report.
# cd /export/home/preflightcheck/app1/scripts
# chmod +x setup.sh
# ./setup.sh
If you do not indicate a location where you want to save the final report, during the installation, the final report is saved in the default directory, /export/home/preflightcheck/app1/reports.
The script unpacks and installs the tool.
- Read the documentation that is downloaded with the application in the Docs subdirectory.
Using the Preflight Checker
You run the Binary Analyzer, Source Code Analyzer, or Runtime Analyzer modules by indicating the directories containing the binaries, source code, or processes running on the Oracle Solaris 10 system that you want to check.
The Preflight Checker can analyze running application processes, application binaries, and application source code on Oracle Solaris 10 and report known potential issues with running the application on Oracle Solaris 11.
Detailed instructions for installing and running the Preflight Checker are available in the README file in the docs subdirectory of the tools installation directory.
Running the Preflight Checker Application at the Command Line
Once the Preflight Checker is installed, you can start it by using the following command:
$ preflightchecker.sh [options] file-or-directory
To list the options available for executing the Preflight Checker at the command line (preflightchecker.sh), use the –h option.
$ preflightchecker.sh -h
During the static binary analysis, the Preflight Checker locates the object files in the source and checks for the use of deprecated, unsupported, and unstable APIs that might not work on Oracle Solaris 11.
Running Preflight Checker Modules From the GUI
This section provides information about how to use the different modules available in the Preflight Checker from the graphical user interface (GUI).
How to Use the Binary Scanner From the GUI
-
Launch the Preflight Checker GUI.
# tool-install-dir/bin/preflightcheckerGUI.sh
Provide the application information such as application name and version.
You can also click the More Details button to add more details about the application such as database version. Click the Next button to go to the next window.
- Select the Application Checker.
- Select the Binary Scanner option.
- In the Summary screen, provide the application details such as the application name, version, path, and LD_LIBRARY_PATH.
- Click the Add a Directory button to add the location of the application to be scanned.
- Click the Specify Directory button to choose the folder where you want to save the scan report.
-
Click the Start Analysis button to start the binary scan.
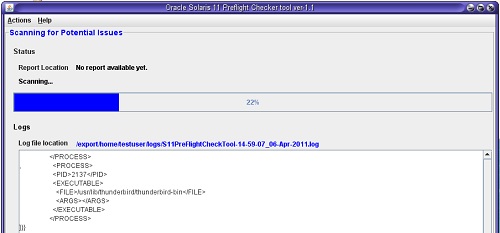
On the completion of binary scanning, the scanner generates a report.
- (Optional)
To run the test again, click the Re-run S11preflightcheck
button.
The current values are used unless you change them.
-
Click the report location to open the report.
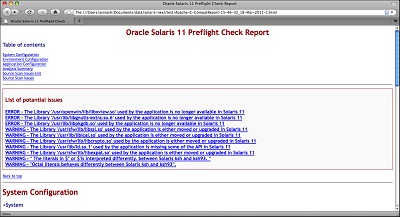
-
Click the Analysis Summary link in the Table of contents to display an
analysis of the scan.
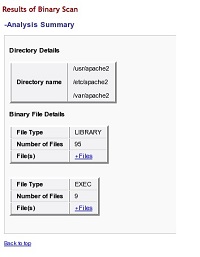
-
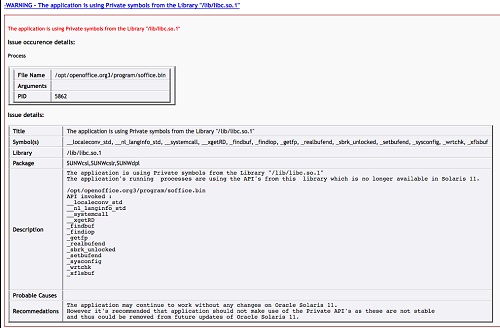
To display the details of an error or warning, click its link.
The following example shows a sample issue description.
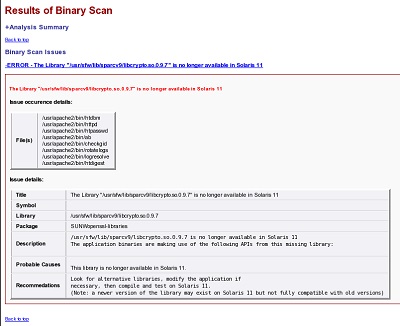
How to Use the Source Code Scanner From the GUI
-
Launch the Preflight Checker GUI.
# tool-install-dir/bin/preflightcheckerGUI.sh
- Select the Application Checker.
- Select the Source Code Scanner option.
-
Click the Add a Directory button to add the location of the
application to be scanned.
The PATH field indicates where to find system executables and user-created executables. As shown in the figure, /usr/sbin, /usr/bin, and /bin are already entered. You can append more locations to the PATH value with a colon (:) separator.
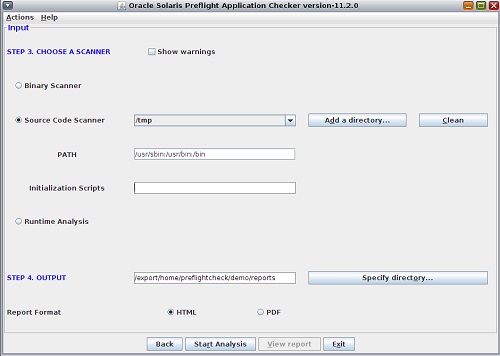
- Click the Specify Directory button to choose the folder where you want to save the scan report.
-
Click the Start Analysis button to start the scan.
On the completion of source code scanning, the scanner generates a report.
- (Optional)
To run the test again, click the Re-run S11preflightcheck
button.
The current values are used unless you change them.
- Click the report location to open the report.
- Click the Analysis Summary link in the Table of contents to display an analysis of the scan.
-
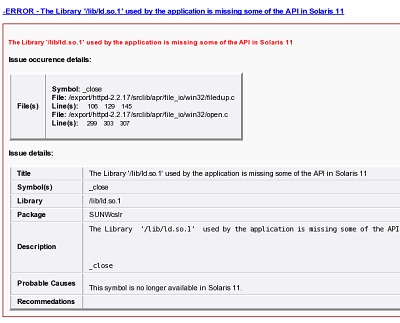
To display the details of an error or warning, click its link.
The following example shows a sample issue description.
Using the Runtime Analyzer From the GUI
This section provides information about the prerequisites for using the Runtime Analyzer and how to launch it from the GUI.
How to Set Parameters for the Runtime Analyzer
Before You Begin
You must have the following Oracle Solaris privileges:
-
basic
-
dtrace_user
-
dtrace_proc
-
dtrace_kernel
 | Caution - Do not give the proc_owner privilege to the user. Adding this privilege to the user, enables the user to collect the information from processes owned by all other users on the system. |
-
As root, run the script to set the
parameters.
# /export/home/preflightcheck/app1/scripts/setPriv.sh username
-
Set the DTrace value by adding the following line in the
/etc/system file.
set dtrace:dtrace_dof_maxsize=0x800000
-
Set the fasttrap value by adding the following
line in the /kernel/drv/fasttrap.conf
file.
fasttrap-max-probes=2500000;
fasttrap-hash-size=65535;
- Reboot the system after setting the kernel parameters.
How to Run the Runtime Analyzer From the GUI
-
Launch the Preflight Checker GUI.
# tool-install-dir/bin/preflightcheckerGUI.sh
- Select the Application Checker.
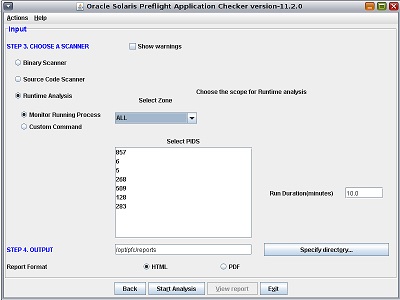
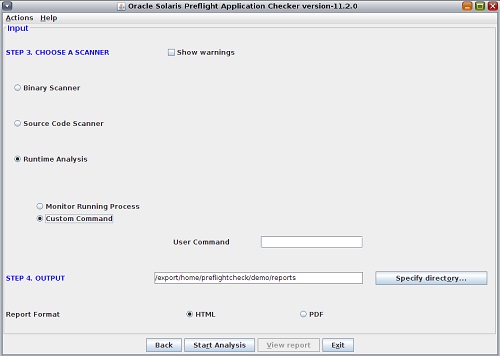
- Select the Runtime Analysis option.
-
Set the scope for the analysis.
-
To monitor a specific running process, select the Monitor
Running Process option and select the target
PID from the list.
-
To analyze a user command, select the Custom Command
option and type the complete command for starting the
application to monitor the process.
-
To monitor a specific running process, select the Monitor
Running Process option and select the target
PID from the list.
- (Optional)
Set the time for Preflight Checker to scan the application by
using the Run Duration field.
The Preflight Checker will run for the given time and generate a report based on the scan.
- Click the Specify Directory button to choose the folder where you want to save the scan report.
- Click the Start Analysis button to start the scan.
- (Optional)
To run the test again, click the Re-run S11preflightcheck
button.
The current values are used unless you change them.
- Click the report location to open the report.
- Click the Analysis Summary link in the Table of contents to display an analysis of the scan.
-
To display the details of an error or warning, click its
link.
The following example shows a sample issue description.
Kernel Checker
The Kernel Checker analyzes kernel modules or device driver binaries and their source code, and reports known potential compliance issues with Oracle Solaris 11.
When running the Binary Analyzer or Source Code Analyzer, you indicate the directories containing the binaries and source code on the Oracle Solaris 10 system that you want to check.
Running the Preflight Kernel Checker at the Command Line
To launch the Kernel Checker, issue the following command:
$ ./preflightchecker.sh -kernelchecker [options] file-or-directory
To list the options available for executing the Preflight Kernel Checker (kernelchecker.sh), use the –h option.
$ ./preflightchecker.sh -kernelchecker -h
During static binary analysis the Kernel Checker recursively searches the directories to locate the object files, and checks for the use of deprecated, unsupported, and unstable APIs which that might not work on Oracle Solaris 11.
How to Run the Kernel Checker From the GUI
-
Launch the Kernel Checker GUI.
# tool-install-dir/bin/preflightcheckerGUI.sh -kernelchecker
- Select the Kernel Checker option.
- In the Summary screen, provide the application details such as the application name, version, path, and macro definitions.
-
Choose whether you want to check the kernel modules or device
drivers.
- To check whether the kernel modules will run on Oracle Solaris 11 without any issues, select the Check for Compatibility option.
- To check the device drivers for compliance, select the Check for DDI/DKI Compliance option.
- Click the Specify Directory button to choose the folder where you want to save the scan report.
-
Click the Start Analysis button to start the scan.
On the completion of kernel scanning, the scanner generates a report.
- (Optional)
To run the test again, click the Re-run S11preflightcheck
button.
The current values are used unless you change them.
- To open the report, click the View Report button.
Application Analyzer
The Application Analyzer checks the application for suboptimal coding or implementation practices and the use of specific Oracle Solaris features to get the most out of the Oracle Solaris 11 platform.
Application Analyzer also scans the application to check whether any code change could lead to an immediate performance benefit. This tool analyzes the application's processes and source code and generates a recommendation report. Possible recommendations include migrating from the gcc compiler to Oracle Developer Studio, using correct compiler flags to optimize applications, using the Oracle Developer Studio high-performance library, and increasing the performance of servers by using on-chip hardware cryptography.
The Application Analyzer analyzes the application for the following categories of issues:
-
Crypto – The Crypto module of the Application Analyzer detects the use of crypto features on the running application processes. For Java applications, the analyzer performs a check for the use of the Java JCE APIs. For native applications, the analyzer checks for use of known list of crypto libraries. In both cases, the analyzer provides recommendations to leverage the hardware crypto feature available in SPARC systems.
-
Makefile – The Makefile source code scanner scans the application source code and generates a recommendation report in HTML.
The report contains the following information:
-
If the application is currently using gcc compilers for compilation, the report indicates the flag that must be changed for successful compilation using Oracle Developer Studio compilers.
-
If the application is using an older version of Oracle Developer Studio compilers such as forte 6.x or Studio 10, the report indicates the new flag that must be used with latest Oracle Developer Studio compilers for better performance on Oracle Solaris 11. This tool also reports the use of deprecated or unsupported flags from older compilers.
-
Recommendations for compiler optimization flags suitable for better performance of the application on Oracle Solaris 11 based on make files and source code.
-
-
High-Performance Libraries – This module scans the running application processes and generates a recommendation report on the suitability of using specific Oracle Solaris 11 libraries. For example, Sun Performance Library is a set of optimized, high-speed mathematical subroutines for solving linear algebra and other numerically intensive problems. This tool detects the use of such public domain subroutines by running application processes and suggests a corresponding Sun Performance Library.
Running the Application Analyzer at the Command Line
To launch the Application Analyzer, issue the following command:
$ appAnalyser.sh [options] file-or-directory
To list the options available for executing the Preflight Application Analyzer (appanalyser.sh), use the –h option:
$ appAnalyser.sh -h
How to Run the Application Analyzer From the GUI
-
Launch the Application Analyzer GUI.
$ tool-install-dir/bin/appAnalyzerGUI.sh
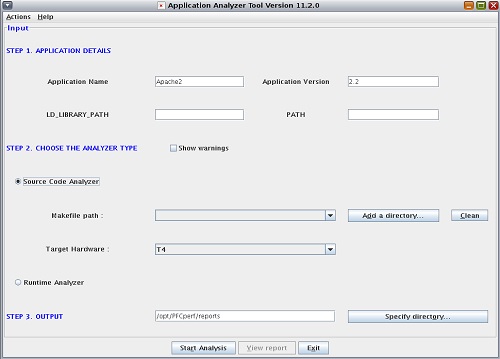
- Provide the application details such as the application name, version, and path.
-
Choose the type of analyzer.
- To check the use of removed, renamed, or modified library functions, select the Source Code Analyzer option.
-
To analyze the source code within a scope, such as a zone, or
a specific process for a given executable name, select the
Runtime Analyzer option.
- Click the Specify Directory button to choose the folder where you want to save the scan report.
-
Click the Start Analysis button to start the scan.
On the completion of application scanning, the scanner generates a report.
- (Optional)
To run the test again, click the Re-run S11preflightcheck
button.
The current values are used unless you change them.
- To open the report, click the View Report button.
Help and Support for Preflight Applications Checker
For more information about updates and the latest version of the Oracle Solaris Preflight Applications Checker, see the Oracle Solaris Preflight Applications Checker 11.3 product page.
Independent Software Vendors (ISV) can get help or support for this tool by contacting isvsupport_ww@oracle.com.