2 Using the Landing Pad
Use the Oracle Pulse Landing Pad to quickly check the performance of all your Oracle Managed Cloud Services in five key areas then, with a tap, review the supporting data in any area requiring attention.
From Oracle Pulse Release 5.0, you can move directly from any row in the supporting data to see the selected metrics in their overall context on the Customer, Service, or Environment Dashboard.
About the Landing Pad
The Landing Pad displays the recent performance of all your organization's Oracle Managed Cloud Services in the areas of service and environment availability, storage usage, service requests and changes logged, and (if enabled) business transactions. The Landing Pad also serves as a home page for Oracle Pulse and is easily accessible from anywhere in the app by tapping the home icon in the top left corner.
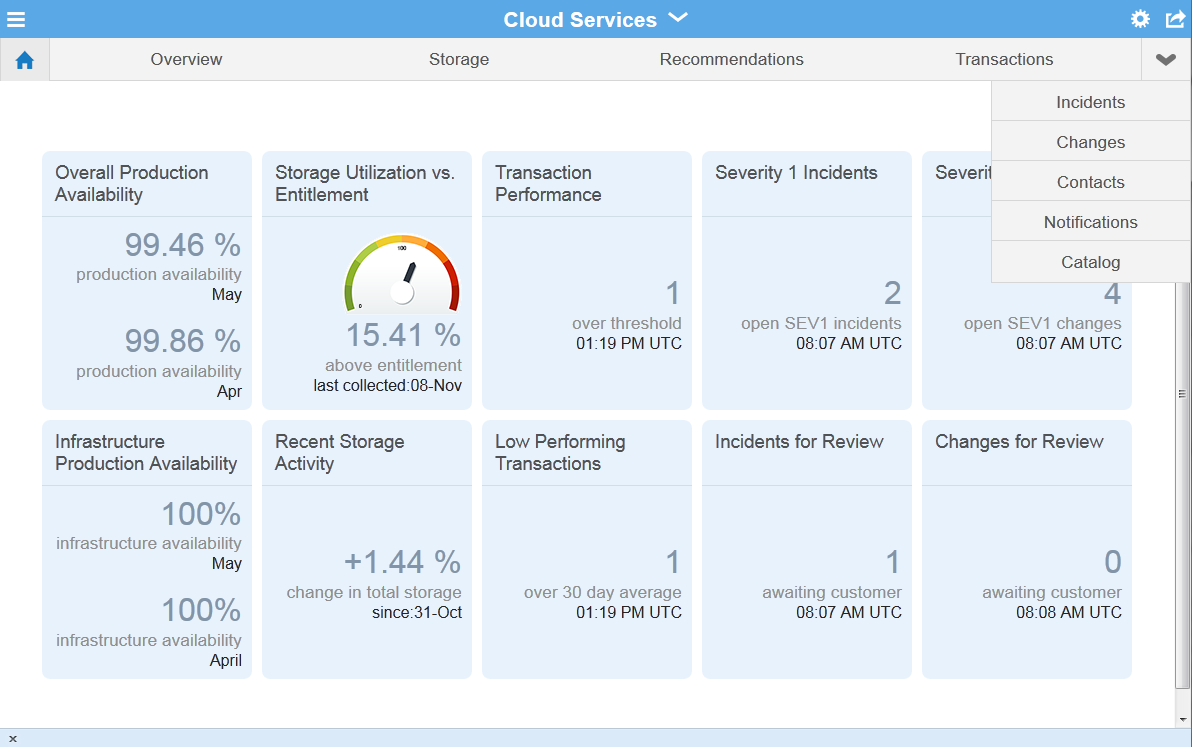
The Landing Pad consists five pairs of tiles, corresponding to these key areas:
The Overall Production Availability tile shows the percentage of time that all your organization's live, production Oracle Managed Cloud Services were operating as expected and accessible by end users for the last two months. Availability is calculated based on complete unplanned outages and does not include service interruptions or planned maintenance. To understand more about how availability is calculated, see the Availability Metrics section in Chapter 1, "Introduction".
Tap the tile to open the Overall Production Availability table, showing the percentage availability and complete outage time (if any) of each environment for all services over the previous and current month to date.
Select any environment/row to open the Environment Dashboard populated with metrics for that environment.
Note:
If the overall production availability is between 0% and 100%, tap this tile to open the data view.If the overall production availability is 0%, 100%, or N/A (not available), tapping the tile does not open the data view.
Environments are labeled 'instances' in this view and are listed along with their environment alias, 'instance ID'.
The Infrastructure Production Availability tile displays the percentage of time that the underlying facility, network, and hardware components associated with production Managed Cloud Services environments were operating as expected. Availability is calculated based on complete unplanned outages where the root cause is identified in the security, network, OS, or hardware category. To understand more about how availability is calculated, see the Availability Metrics section in Chapter 1, "Introduction".
Tap the tile to open the Infrastructure Production Availability table, showing the percentage of time that the underlying facility, network, and hardware components of each service were operating as expected over the previous and current month to date. You can also view the complete outage time, if any, for these components in the previous and current month.
Select any environment/row to open the Environment Dashboard populated with metrics for that environment.
The Storage Utilization versus Entitlement tile compares the amount of storage used by all your Managed Cloud Services with your purchased entitlement, on the last collection date. Your storage entitlement is usually allocated as needed across all services. This tile can be useful in identifying services that are consuming a disproportionate amount of storage.
The Recent Storage Activity tile shows the percentage change in storage activity since the date displayed. An increase of 5% or more in storage usage over one week is considered significant. If your storage usage increases by more than 5% in one week, Oracle recommends that you contact your Oracle service delivery manager (SDM) to discuss the increase.
Tap the tile to see the data view, listing by service the amount of storage used, in Gigabytes, and percentage of total storage used.
Select any service/row in the data view to open the Service Dashboard populate with metrics for that service. You can also tap Grand Total to open the Storage option for all services on the Customer Dashboard.
The Transaction Performance tile shows the number of transactions exceeding the threshold at the latest collection date and time. A transaction is a sequence of operations that you want to monitor as a single unit. Comparing transaction response times with the threshold value gives a sense of the performance of your services. If one or more transactions exceeds the threshold, this can indicate potential or actual issues with the associated service.
The Low Performing Transactions tile displays the number of transactions that have exceeded the 30 day average since the last collection date and time. A transaction is a sequence of operations that is monitored as a single unit. Comparing transaction response times with the threshold value gives a sense of your services' performance. A significant number of transactions exceeding the 30 day average can indicate potential or actual issues with the associated service(s).
Tap either tile to open the Transactions screen on the Customer Dashboard displaying data for all transactions.
Note:
Where business transaction monitoring (BTM) has not been implemented, these tiles are hidden.The Sev 1 Incidents tile displays all open Severity 1 incidents - that is, service requests (SRs) - created on production instances up to the date and time listed. Severity 1 indicates a complete loss of service for mission critical operations where work cannot reasonably continue.
This Incidents for Review tile displays all Severity 1 incidents - that is, service requests (SRs) - created on production instances up to the date and time listed that are awaiting your input or approval.
Tap either tile to see the following figures for each environment and associated environment alias:
-
Sev 1 Incidents - The number of open Severity 1 SRs for the instance.
-
EM Generated - The number of SRs automatically generated by Oracle Enterprise Manager (EM).
-
BTM Failures - Where business transaction monitoring (BTM) has been implemented, the number of monitored transactions that have exceeded the performance threshold.
-
Awaiting Customer - The number of open SRs awaiting your input or approval to progress.
Select any incident/row in the data view to open the Incidents screen on the Environment Dashboard populated with metrics for the environment associated with the incident.
Note:
If your My Oracle Support (MOS) user account does not have privileges to view SRs, these tiles are hidden.Environments are labeled 'instances' in this view and are listed along with their environment alias, 'instance ID'.
The Sev 1 Changes tile displays all open Severity 1 changes - that is, requests for change (RFCs) - created on production instances up to the date and time listed. Severity 1 indicates a complete loss of service for mission critical operations where work cannot reasonably continue.
The Changes for Review tile displays all open Severity 1 changes - that is, requests for change (RFCs) - created on production instances up to the date and time listed that are awaiting your input or approval.
Tap the tile to see the following figures for each environment and associated environment alias:
-
Sev 1 RFCs - The number of Severity 1 RFCs for the instance.
-
RFCs Awaiting Customer - The number of RFCs awaiting your input or approval to progress.
Select any change/row in the data view to open the Changes screen on the related Environment Dashboard populated with metrics for the environment associated with the change.
Note:
If your My Oracle Support (MOS) user account does not have privileges to view RFCs, this tile is hidden.Environments are labeled 'instances' in this view and are listed along with their environment alias, 'instance ID'.