Common Elements on Targets Homepages
This section describes the following common elements that appear on PeopleSoft target home pages:
Monitoring
Control
Job Activity
Information Publisher Reports
Performance
Configuration Management
Domain Management
Log Management
Configuration
Compliance
Target Setup
Target Information
Note: Not all elements will appear on every target homepage. For example, some elements appear only for database targets, while others appear only for Process Scheduler targets.
This table lists the common elements that are available for monitoring targets.
|
Field or Control |
Definition |
|---|---|
| All Metrics |
Click this to display all of the metrics defined for the target. |
| Metrics and Collections Settings |
Click this to display the metric thresholds and collection interval for the target. |
| Metrics Collection Errors |
Click this to view the details about the errors encountered while obtaining target metrics. This helps to get the detail of the metric that do not represent the performance of the target accurately. |
| Status History |
Click this to get information about target outages. This information is essential for troubleshooting target related incidents. For more information about status history, see Oracle® Enterprise Manager Cloud Control Getting Started with Oracle Fusion Middleware Management Plug-in Release 12.1.0.5, “Discovering and Monitoring Oracle Business Intelligence Instance and Oracle Essbase”, Viewing Target Status and Availability History. |
| Incident Manager |
Click this to get details about the various events, related to the PeopleSoft target, that negatively impact any hardware or software component. These events require user action. The details provided by this section, such as the incident summary, severity, target, target type, and so on, are essential for troubleshooting. |
| Alert History |
Click this to displays a complete alert history of the target. |
| Blackouts |
Click this to displays the blackouts that have been defined for the target history. You can also set up a blackout from this page. |
Click this to create or end blackouts.
Blackouts allow Enterprise Manager users to suspend management data collection activity on one or more managed targets. For example, administrators use blackouts to prevent data collection during scheduled maintenance or emergency operations. By blacking out the server, alert notifications are not sent.
Access this to search for a particular job and retrieve job details such as the owner, status, scheduled start time, and so on. From this page, you can perform target job administration tasks, such as creating, editing, suspending, and resuming a job.
Access this page to get the summary of the Service Level Agreement Compliance, Actual Service Level Achieved, Key Performance and Usage Metrics, and Status of Key Components.
Access the Performance page from the PeopleSoft application domain list.
The Performance page gives you a snapshot of the performance of the domain by displaying a graphical view of the domain's:
Note: This is an example from PS Application Server Domain Target.
Host CPU usage.
Host memory usage.
Disk input/output utilization.
Average number of queued processes per domain server process.
PSAPPSRV handler counts.
Total number of Tuxedo connections.
Use the View Data dropdown list to modify the time frame of the display. For example, you can view the last 24 hours, last week, last month, and so on.
If the PUBSUB (Integration Broker server processes) feature is not active, the graphs for Broker, Subscriber, and Publisher are blank.
The CPU and memory utilization shown on the PS Application Server Domain Performance page includes more detailed information than that on the homepage.
The frequency of the disk I/O (read/write frequency) indicates how much the application server is caching—this value may reflect the performance of the application. It also includes writing to log files.
The amount of queuing on the main processes of a PS Application Server Domain indicates if the defined handlers are sufficient for the domain. Larger queues cause a slow response on application functions, and this could indicate that more handlers or domains are required to handle user requests.
Note: A statement of no data found may appear in the graphic region. This occurs because there is no target data available in Enterprise Manager when this graph is rendered.
For more information about changing the view of performance data, see Enterprise Manager documentation.
This table lists the common elements that are available for managing configuration of targets.
|
Field or Control |
Definition |
|---|---|
| Configure Domain |
Click this to access the Configure Domain page to edit domain configurations. See the product documentation for PeopleTools: System and Server Administration, "Working With Domain Configurations"
|
| Create Like Domain |
Click this to import a domain from another PS Application Server Domain or PS Process Scheduler Domain. You can create a like domain only within the same host referencing the same PS_HOME. |
| Copy Configuration |
Click this to copy configuration files from an existing domain to another domain within the same host. This overwrites the configuration files on the managed host. Note: This feature does not work on domains that are currently running. |
| Discover Database |
Click this to discover the Database associated with this target. This menu provides an alternate way to discover the database target, if they did not get discovered in the main discovery workflow. |
This table lists the common elements that are available for domain management of targets.
|
Field or Control |
Definition |
|---|---|
| Start Domain |
Click this to start an individual target. A serial boot starts server processes in a sequential order, with one process beginning to start after the previous process has completely started. |
| Start Domain (Parallel) |
Click this to start server processes parallelly this ensures shorter boot duration. |
| Stop Domain |
Click this to shut down the domain and is equivalent to the normal shutdown option in PSADMIN. |
| Stop Domain (Forced) |
Click this to stop an individual target. A forced shutdown is a non-quiescent shutdown that immediately terminates all of the processes in the domain. Use forced shutdown only when a Bulletin Board Liaison (BBL) process encounter errors and cannot be shut down normally. |
| Delete Domain |
Click this to delete the domain on the host and remove it from Enterprise Manager. Note: The domain must be down before you can delete. |
Access the Log Management Page to:
View log files.
Search for strings in a log file.
Add and remove log patterns.
Viewing Log File
Image: View Log File page
This example illustrates the fields and controls on the View Log File page. You can find definitions for the fields and controls later on this page.
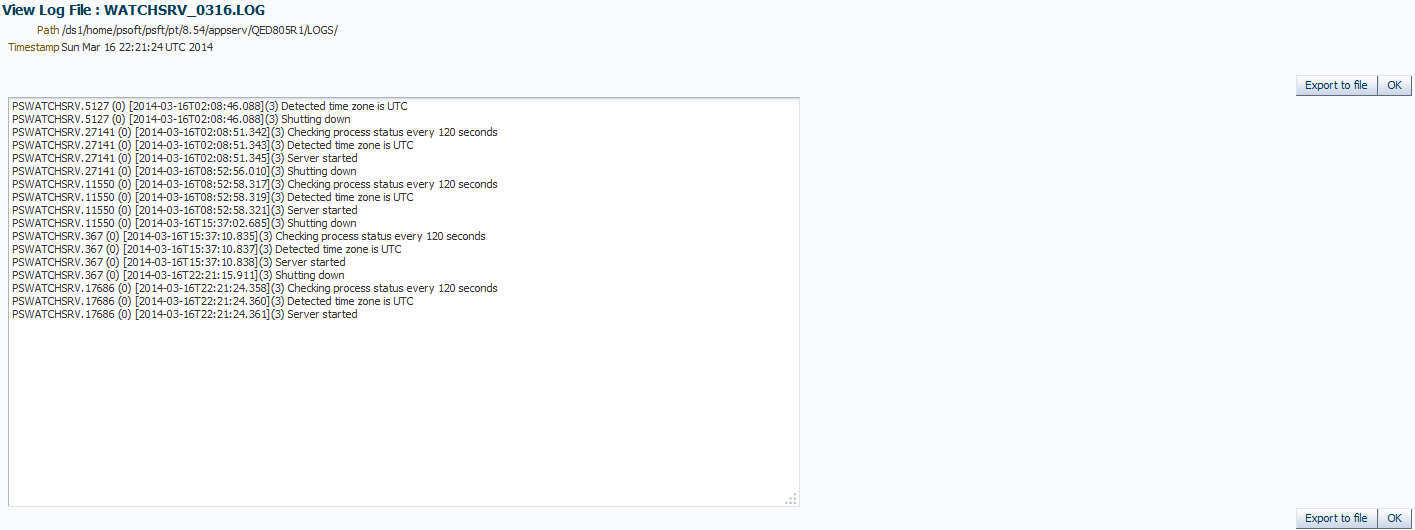
If you have searched for a string, you can also click the link by the line number or the string (in the results area) to display the View Log File page.
The initial view contains 500 lines and the string is the last one shown. Click Previous, Next, Top, or Bottom to navigate through the file.
The log filename is also available within the search results area.
|
Field or Control |
Definition |
|---|---|
| Refresh |
Click Refresh to refresh the screen. |
| Export to file |
Click Export to File to export the log file. You can open the file in the Notepad or save the file to your workstation. |
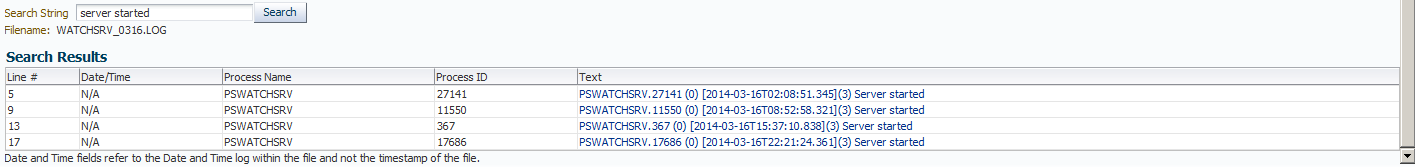
Searching for Strings in a Log File
To search for a string in a log file:
Click the file you want to search, using the radio button in the Select column.
Scroll to the bottom of the Logs page.
Enter the desired search string in the Search String edit box.
Click Search.
In the Search Results Cloud, review the instances of the search string found in the log file.
Instances of the search string appear by line in the Search Results Cloud. The log information displayed includes the line number in the log file in which the string is found, the date and time, the server process involved, and the phrase or sentence containing the string.
Image: Logs page: Searching Log Files
This example illustrates the fields and controls on the Logs page: searching log files.
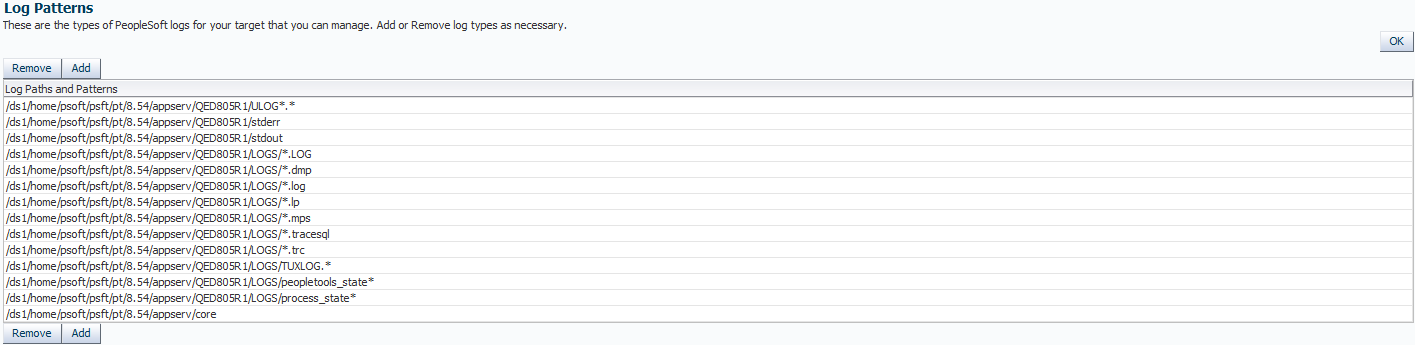
Setting up Log Management
On the Logs page, click the Log Management Setup link to display the Log Management Setup page where you can define the log file types to manage for each target. You can add and remove log file types as needed. From this page you can also schedule purge and archive jobs.
Image: Log Patterns page
This example illustrates the fields and controls on the Log Patterns page.
This table lists the common elements that are available for configuration targets.
|
Field or Control |
Definition |
|---|---|
| Last Collected |
Click this to display the latest configuration data. The Last Collected Configuration link enables you to view from a central location key configuration metric and parameters for the target. |
| Compare |
Click this to compare configurations of multiple nodes. This helps to identify performance bottlenecks caused by configuration changes. |
| Comparison Job Activity |
Click this to monitor comparison job status. |
| Search |
Click this to define the search criteria for configuration details across targets. |
| History |
Click this to display the preserved configurations. |
| Save |
Click this to save the configuration for a given target. |
| Saved |
Click this to display the list of saved configurations for a given target. |
| Topology |
Click this to display the topology configuration of the target type. |
This table lists the common elements that are available for viewing compliance of targets.
|
Field or Control |
Definition |
|---|---|
| Results |
Click this to evaluate the compliance of PeopleSoft targets and systems for configuration, security, and storage. In addition, compliance results provide advice on how to change configuration to bring the PeopleSoft targets and systems into compliance. |
| Standard Associations |
Click this to associate the compliance standard for a target. |
| Real-time Observations |
Click this to define a search criteria to query the compliance observations in the real time. |
This table lists the common elements that are available for setting up targets.
|
Field or Control |
Definition |
|---|---|
| Monitoring Configuration |
Click this to display target properties such as domain name, PS_HOME, and PeopleTools version. |
| Administrator Access |
Click this to display access type and the privilege associated with the target. You can add an administrator to a target. |
| Remove Target |
Click this to remove the current target from the system. |
| Add to Group |
Click this to add a target to a group. |
| Properties |
Click this to view and edit target properties. |