7 Setting Up Performance Monitoring
This chapter describes how to define the KPIs and SLAs used to monitor your network's performance, and which you can review via dashboards and reports. The management of the alerts used to notify staff members about incidents that impact service levels, such as who should be notified and when, is also described. You must have Full access level permission to define and modify KPIs and SLAs (as described in Section 14.2, "Understanding User Account Roles and Permissions").
7.1 Introduction
A Service Level Agreement (SLA) is an agreement between a provider and a customer that specifies the terms of the provider's responsibility to the customer, and the level of service that the customer can expect. Typically, this agreement is expressed in terms of a number of Key Performance Indicators (KPIs). These are a way of measuring and benchmarking specific aspects of an organization's performance.
For example, an SLA for a given service might promise that it will be up and running 99.999 percent of the time. Because this is a commitment given to customers, the organization could make this a KPI. As such, service availability would be monitored, and whenever it fell below this level, the appropriate staff would be notified, and corrective action taken.
It is important to understand that an organization may also set KPIs for its own performance monitoring, independently of an SLA. Because KPIs provide insight into an organization's performance, they may also be tracked as part of a management dashboard.
7.2 Defining KPIs and SLAs
To create a KPI and, optionally, use it as the basis for alerts and service levels, do the following:
-
Select Configuration, then Service level management, then select KPIs, and click the New KPI button. The dialog shown in Figure 7-1 appears.
-
Specify a Name and Category for the monitored KPI. If you specify a new category name, this category is automatically created.
-
Use Metric, Entity, Calculation and Unit fields to define the KPI, noting the following:
-
Depending on what you choose as the metric, you may not be required to specify values for the other fields.
-
Calculations might require multiple inputs. For example, if you selected the Page load time (sec) metric, you need to specify the user flow to which it refers. If the required option is not in the displayed list, you can click the Search icon to locate it.
-
See Section E.2, "KPI Metrics" for more information on metrics.
-
After saving the KPI definition, you cannot edit these fields at a later time.
-
-
Specify the Calculation time period (min) for the KPI. This can be a value between 1 and 15 minutes and can be edited later.
Note:
All KPI values are calculated every minute. This setting determines a time window for calculating a KPI value, for example if you choose average page load-time as the KPI and set the calculation time period to 5 minutes, the KPI is updated every minute using an average load-time for the previous 5 minutes. -
Enter a short description of the KPI into the field on the Description tab. The other tabs are described in the following sections:
-
Section 7.2.1, "Applying a Condition to a KPI" allows you to add filters to the KPI.
-
Section 7.2.2, "Applying Target Values to a KPI" allows you to define a minimum and maximum range for the KPI, and how the target should be calculated.
-
Section 7.2.3, "Applying a Prerequisite to a KPI" allows you to add additional requirements for the selected metric. Using this facility, you can build compound KPIs
-
Section 7.2.4, "Applying a Service Level Agreement to a KPI" allows you associate a KPI with an SLA. If so, you can configure the level of your committed agreement (in percentage terms) for specific time periods.
-
Section 7.2.5, "Applying an Alert Schedule to a KPI" allows you associate an alert with a KPI. If so, you need to define the length of time that the KPI is non compliant before an alert is issued.
-
-
Click Save.

7.2.1 Applying a Condition to a KPI
The Conditions tab on the KPI screen allows you to filter the data for the KPI to values that match conditions for either a metric or dimension level. If you require metric filtering based on an aggregate function, for example the average load-time for all pageviews being less than 5ms rather than an individual measurement of load-time being less than 5ms, consider using the Prerequisites tab to create that prerequisite.
-
Select the KPI you want to edit from Configuration > Service level management > KPIs. A screen similar to the one shown in Figure 7-1 appears.
-
Select the Conditions tab and click Add to insert a new condition. The Add condition screen appears.
-
Select the Condition type, the choices are Dimension level or metric. For information about the metrics and dimensions listed as options, see Appendix E, "Summary of Data Items".
-
Select the Dimension level or Metric depending on your choice in step 3. The resulting fields are determined by this choice, allowing you to create a precise condition.
-
Enter the details of the condition, for example, Database Process Time between 50 and 500 milliseconds.
For most dimension levels (except application name or client location), one or more wildcard (*) characters can be specified. Note that filters on different dimensions will be considered to be part of a logical 'AND' clause, while multiple filters on the same dimension are considered to be part of a logical 'OR' clause. For example, if you create two client browser conditions, one for 'firefox', and one for 'chrome', the KPI applies to requests by both Firefox and Chrome browsers.
-
When you have created all the conditions you require, click Save.
7.2.2 Applying Target Values to a KPI
The Target tab on the KPI screen allows you to associate a range of values with a KPI. For example, if the KPI measures the Error Level as a percentage, you can create a target range of 0% to 5%.
-
Select the KPI you want to edit from Configuration > Service level management > KPIs. A screen similar to the one shown in Figure 7-1 appears.
-
Select the Target tab.
-
Select the Target type, the choices are Fixed values or Automatic. .
-
If you choose Fixed values in step 3 enter the Minimum and Maximum values for the KPI.
-
If you choose Automatic in step 3, you can choose whether to use small, medium, or large deviations for the auto-learnt target. For more information on the use of this facility, see Section 7.3.3, "Automatic and Fixed Targets".
-
Click Save.
7.2.3 Applying a Prerequisite to a KPI
The Prerequisites tab on the KPI screen allows you to filter the data for the KPI. Whereas the Conditions tab allows you to filter using metrics and simple operators, a prerequisite allows you to filter using the same calculation options as when defining a KPI. In this way, you can build compound metric conditions. For example, the monitored service should provide an end-to-end page time of between 3 and 5 seconds for 98% of requested pages, but this requirement should only apply when page views per minute are between 5 and 10.
-
Select the KPI you want to edit from Configuration > Service level management > KPIs. A screen similar to the one shown in Figure 7-1 appears.
-
Select the Prerequisites tab and click Add to insert a new prerequisite. The Add prerequisite screen appears.
-
Select the Metric that you want to use for the prerequisite. See Section E.2, "KPI Metrics" for more information on metrics.
-
Use Metric, Entity, Calculation and Unit fields to define the prerequisite, noting the following:
-
Depending on what you choose as the metric, you may not be required to specify values for the other fields.
-
You do not enter a period or conditions for a prerequisite, these are determined by the KPI.
-
-
Enter the prerequisite conditions, eg set Operator to 'between' and enter values for Minimum value and Maximum value.
-
Click Save.
7.2.4 Applying a Service Level Agreement to a KPI
The Service Level Agreement tab on the KPI screen allows you to set levels for target achievement. You can configure the level of your committed agreement (in percentage terms) for specific time periods.
-
Select the KPI you want to edit from Configuration > Service level management > KPIs. A screen similar to the one shown in Figure 7-1 appears.
-
Select the Service Level Agreement tab.
-
Check the Enabled option.
-
Enter percentage values for target achievement. For example, you undertake that the service will meet its specified objectives throughout 98% of the year. However, on an hourly basis, the commitment is 80%, and on a daily basis, 90%. All the period fields are mandatory.
-
Click Save.
7.2.5 Applying an Alert Schedule to a KPI
The Alerting tab on the KPI screen allows you to associate the KPI with an alert schedule.
-
Select the KPI you want to edit from Configuration > Service level management > KPIs. A screen similar to the one shown in Figure 7-1 appears.
-
Select the Alerting tab.
-
Select one or more Alert schedules. Defining alert schedules is described in Section 7.5, "Defining Alert Schedules."
-
Enter the number of minutes that the KPI is non compliant before a 'down' alert is triggered in the Trigger when down (min) field.
-
Enter the number of minutes that the KPI is non compliant before an 'up' alert is triggered in the Trigger when up (min) field.
-
Select a Severity option to suit the KPI, for example 'Warning'.
-
Enable the Notification on up option if you want an alert when a KPI returns to compliance (after the number of minutes specified in the Trigger when up (min) field.
-
Click Save.
7.3 Modifying Existing KPIs
You can review and modify the definitions of existing KPIs by selecting Configuration, then Service level management, then KPIs, and selecting the required KPI from the displayed listing. A screen similar to the one shown in Figure 7-1 appears.
You can use the tabs to locate particular aspects to the selected KPI, and review and modify their definition. Their associated settings are equivalent to those described in Section 7.2, "Defining KPIs and SLAs".
You can modify, rename, copy, or delete KPIs by right clicking them and selecting the Rename, Copy or Remove options from the menu. Select the Edit option to modify the KPI. The procedure to do this is described in Section 7.2, "Defining KPIs and SLAs".
You can add a KPI to a dashboard by right clicking on the KPI and selecting Add to dashboard, see Chapter 5, "Working With Dashboards" for more information on dashboards.
7.3.1 Copying Existing KPIs
In addition to creating new KPIs from scratch, as explained in Section 7.2, "Defining KPIs and SLAs", you can also create a copy of an existing KPI, and use it as the basis for your new KPI. This is particularly useful when the new KPI is very similar to an existing one. For example, you already have an existing KPI that monitors user flow availability in the USA, but now want to create a new one for Canada. To use an existing KPI as the basis for a new one, do the following:
-
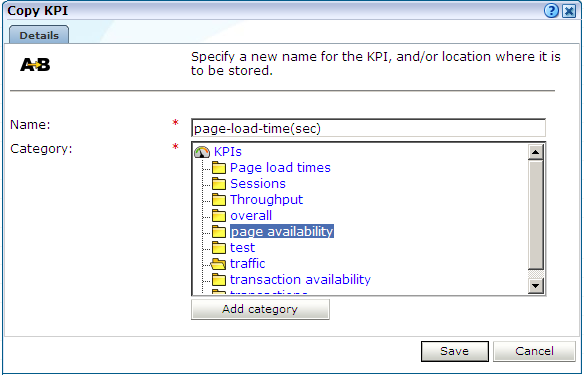
Select Configuration, then Service level management, then KPIs, and right click on the required KPI from the displayed listing. Select Copy from the menu. The dialog shown in Figure 7-2 appears.
-
Specify a new name and location for the new KPI. Optionally, click Add category to create a new category. When ready, click Save.
-
Use the procedure described in Section 7.3, "Modifying Existing KPIs" to modify the new KPI to meet your requirements.
7.3.2 Understanding KPI Calculation Ranges
All KPI values are calculated every minute. This setting determines a time window for calculating a KPI value, for example if you choose average page load-time as the KPI and set the calculation time period to 5 minutes, the KPI is updated every minute using an average load-time for the previous 5 minutes.
By default, the KPI calculation time period is one minute. However, it can be useful to specify a longer calculation range if you want extreme values to be averaged out over a longer period. To edit the calculation time period, select Configuration, then Service level management, then select KPIs, right click on the KPI you want to edit and choose Edit from the menu.You can then edit the Calculation time period for the KPI.
Reporting KPI Values for Calculation Periods Longer Than 1 Minute
KPI values are calculated at the end of each 1-minute period. When a KPI has a calculation time period of longer than 1 minute, and the KPI calculation is a percentage of some factor that is calculated on a different time scale, for example average page load-time per hour, then the KPI value is calculated as an average of the values that are reported for each minute, averaged over the calculation time period. It is recommended that you bear this in mind when interpreting reported values for concurrent sessions and percentile KPIs.
7.3.3 Automatic and Fixed Targets
As mentioned earlier, you can specify a KPI should use automatic (or auto-learnt) targets (see Section 7.2.2, "Applying Target Values to a KPI"). Typically, visitor traffic and usage patterns can differ widely during the course of a day, for example, the number of visitors might be lower during the night than during the afternoon, or on certain days compared to others.
To accurately reflect this in the automatic target calculation, RUEI uses an evaluation algorithm that works as follows:
First, the minimum and maximum targets for a given 1-minute period are always computed from data within a sampling window around that period. This ensures that any generic trend in the value fluctuation around that specific period is taken into consideration.
Next, RUEI also looks at the data from the same sampling period over a number of previous days. This ensures that a daily trend in the value fluctuation around that specific period is also considered, for example, if the overall number of visitors at 11am each day increases as the week progresses.
The size of the sampling window, and the number of previous days to use are specified by the KPI threshold profile that has been assigned to the KPIs. Defining a threshold profile is described in Section 12.13, "Defining KPI Threshold Profiles", and assigning a threshold profile to a KPI is described in Section 7.2.2, "Applying Target Values to a KPI".
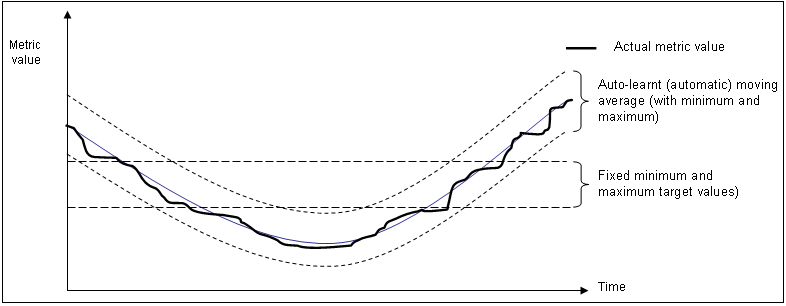
In contrast, a fixed KPI target essentially represents, either minimum or maximum, a straight line. This is shown in Figure 7-3.
Figure 7-3 Automatic and Fixed KPI Targets Contrasted
Description of "Figure 7-3 Automatic and Fixed KPI Targets Contrasted"
When using auto-learnt targets, be aware of the following points:
-
It requires a full day before the auto-learnt targets become available. Clearly, the more days of historical data that are available, the more reliable the calculated automatic targets. During the first day that a KPI is created with auto-learnt targets, these targets are automatically set to slightly above and below the actual recorded values in order to prevent the generation of alerts.
-
Although auto-learnt targets can signal a problem if the metric value is too high or too low, if the problem persists over a long period, these abnormal values will become part of the auto-learnt targets and will, eventually, be assumed to be normal behavior.
-
Auto-learnt targets can drop dramatically if the KPI value is unavailable every day at about the same time. For example, in the case of no network traffic after 18:00.
If you define a KPI to use automatic targets, and later modify the KPI to use fixed targets, the previously calculated targets (derived by monitoring the KPI over time) are set as the new fixed targets. If you are in doubt about the fixed targets that should be set for a KPI, you can use this facility to obtain realistic initial values. Of course, you are free to modify these at any time.
7.4 Defining Service Level Schedules
In addition to defining the KPIs that will be used to track the service levels achieved by your organization, you also need to specify when these service levels should apply. Typically, an organization has a core time (for example, 9 am - 5 pm, Monday - Friday) when the committed service level should be achieved. However, you may need to define exceptions to this, such as for public holidays. For example, a limited service between 10 am and 4 pm may be required on Easter Monday. Finally, you will also need to take account of planned maintenance periods.
The scheduling of planned service levels is maintained through the Service level schedule (shown in Figure 7-4). To open it, select Configuration, then Service level management, and then select Service level schedule.
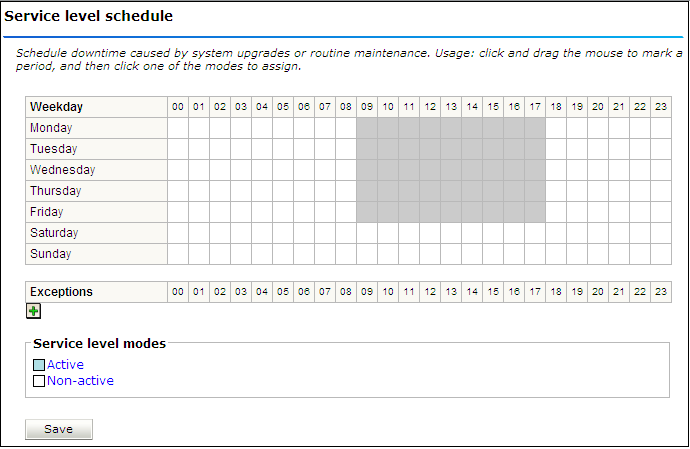
You can mark a period within the Service level schedule by clicking and dragging over the required period of the week. Assign the selected period a status by clicking the Active or Non-active modes.
You can define exceptions by clicking the Plus (+) icon, and selecting the day, month, and year from the Exceptions list. You can remove exceptions by clicking the Minus (-) icon to the right of an exception.
Note that any changes you make are not put into effect until you click Save. On exit, any unsaved changes you made are discarded.
7.5 Defining Alert Schedules
If your organization uses alerts to notify staff members about incidents that impact service levels, you will need to specify who should be notified and when. This is done through the creation of an alert schedule. You can define as many schedules as you wish to meet your operational requirements.
When you define a KPI, you specify the alert schedule(s) that the KPI should use (see Section 7.2.5, "Applying an Alert Schedule to a KPI"). Each alert schedule consists of a group of users, notification details, and the operative time frame. Exceptions to standard operating times can also be defined. To define the alert schedules that should be used by your KPIs, do the following:
-
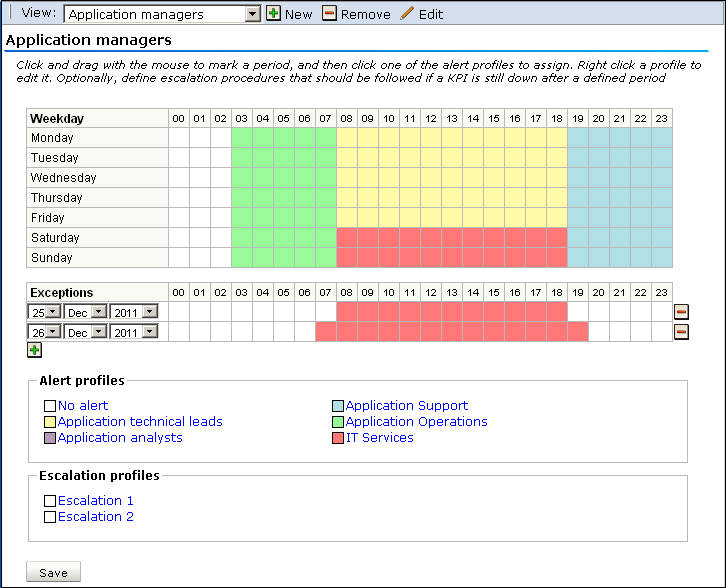
Select Configuration, then Service level management, then select Alert schedule. The window shown in Figure 7-5 appears.
-
Use the View menu to review the currently available alert schedules.
You can define exceptions by clicking the Plus (+) icon, and selecting the day, month, and year from the Exceptions list. You can remove exceptions by clicking the Minus (-) icon to the right of an exception. You can mark a period within a schedule by clicking and dragging over the required period of the week. Assign the selected period by clicking one of the alert profiles.
Note that any changes you make are not put into effect until you click Save. On exit, any unsaved changes you made are discarded.
-
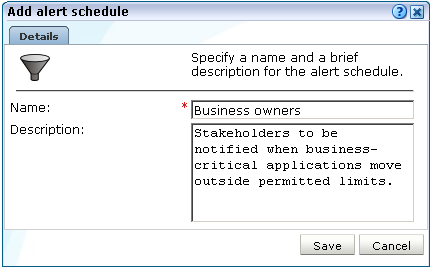
Click New within the toolbar to define a new alert schedule. The dialog shown in Figure 7-6 appears.
-
Specify a unique name for the alert schedule and, optionally, a brief description. It is recommended that it includes an indication of its scope and purpose. When ready, click Save.
-
Specify the users to be notified, as described in the following section.
7.5.1 Alert Profiles
These define the users who will be notified if a KPI has been down for the specified duration required to generate an alert. Depending on how the KPI has been defined, these users will also be notified when the KPI returns to within its set target range.
For example, you might have defined a KPI for the Completed user flows metric, and have specified that a success rate of least 70% is required for normal operation. If the KPI falls below this level within core business hours (9 am - 5 pm, Monday - Friday), all web application Business Managers should be notified. If the failure occurs outside these hours, the Helpdesk should be notified.
Each profile can be customized by right clicking it, and selecting Edit from the context menu. This is shown in Figure 7-7.
The dialog shown in Figure 7-8 appears.
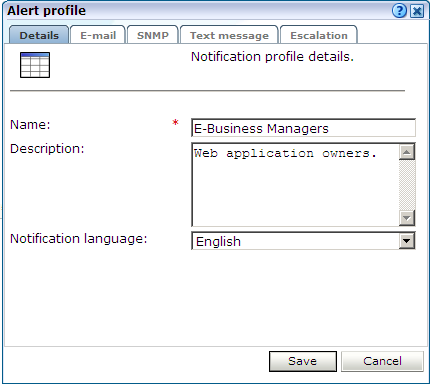
Use this dialog to specify the name and a brief description of the users to be notified. Use the other tabs in this dialog to specify the recipients of E-mail, SNMP, and text message notification. Use the Enabled check box for each method to activate notification.
Note:
When receiving text message-based alerts, the timestamp of the message shown within your mobile telephone may not match that recorded within your RUEI installation. This is due to time zone differences on your mobile telephone.7.5.2 Escalation Procedures
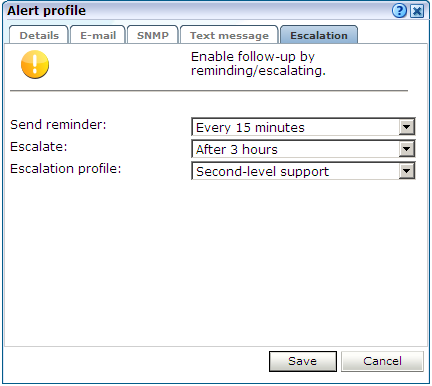
Within the Escalation tab, shown in Figure 7-9, you can set reminders to be sent to the alert's recipients if the KPI remains down. In addition, you can define an escalation procedure if the KPI is still down after a defined period. For example, if the KPI is still down after three hours, notify another group. This escalation group can be customized by right clicking it, and selecting Edit from the context menu.
7.5.3 Measuring and Notification Intervals
It is important to understand that there are two states associated with a KPI: the KPI state, and the alert state. The KPI state can change at each measuring interval. The alert state is controlled by the properties you define for the alert. For example, consider the case in which a KPI starts to fail, and you have defined a calculation range of 5 minutes (the default), and a DOWN duration of 15 minutes. Although after 5 minutes the KPI is considered to be failing, you will not be notified about it unless it has been continually down for 15 minutes.
Similarly, the reminder and escalation durations you specify in Figure 7-9 refer to the alert. Hence, specifying a reminder duration of every hour would generate a reminder notification every 60 minutes after the original alert was sent while the KPI is still failing. It is recommended that you carefully review the values you specify for these settings to meet your operational requirements.
7.5.4 Testing Alert Messages
If you have enabled E-mail, SNMP, or text message notification, you can use the Test profile option in the context menu shown in Figure 7-7 to send a test alert to all specified recipients in an alert or escalation profile. This is useful for testing that the contact information has been entered correctly. You are prompted to confirm the test notification.
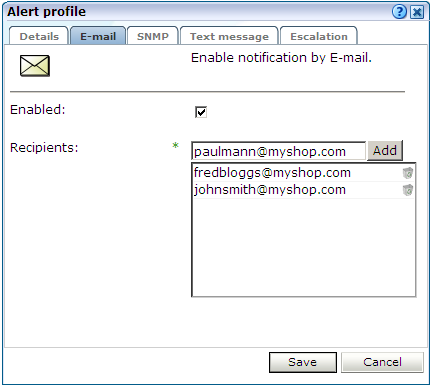
7.5.5 Using Mail Notifications
To define E-mail alert recipients, click the E-mail tab to open the dialog shown in Figure 7-10, and do the following:
-
Use the Recipients fields to specify the E-mail addresses of the users to be notified. Click Add to include a user in the notification list. Note that you can remove a user from the list by clicking the Remove icon to the right of the user.
-
Check the Enable check box to activate E-mail notification. When ready, click Save.
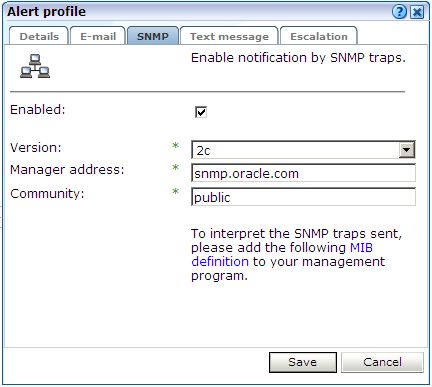
7.5.6 Using SNMP Notifications
To define SNMP alert recipients, click the SNMP tab to open the dialog shown in Figure 7-11, and do the following:
-
Ensure that the Enabled check box is checked. Note that if not checked, no SNMP traps will be generated.
-
Use the Version list to specify which version of the SNMP protocol is being used. The default is version 2c.
-
Use the Manager address field to specify the client software address. This must be a valid network address, and can either be an IP address or a host name.
-
Use the Community field to specify the group to which information is sent. This string acts as a password to control the clients' access to the server.
-
Check the Enable check box to activate SNMP notification.
-
Download the Management Information Base (MIB) definition and incorporate it into your address book of managed objects. It contains necessary information about how the received SNMP messages should be interpreted. Note that the file (
oracle-ruei.mib) is also available within the RUEI installation zip file in theRUEI/extradirectory. The structure of the MIB file is shown in Figure 7-12Foot 1 .
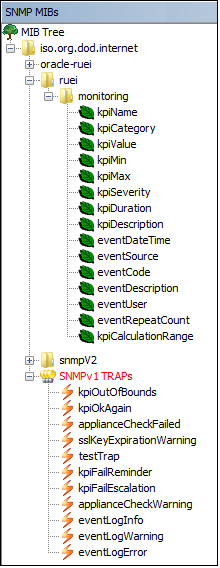
The available KPI information and metrics in the MIB represent the most important properties of every KPI configured within the system, and can be used as the basis for filtering and alerting. They are explained in Table 7-1.
Table 7-1 KPI Information and Metrics Structure
| Object | Type |
|---|---|
|
|
Text |
|
|
Text |
|
|
Value |
|
|
Value |
|
|
Value |
|
|
Text |
|
|
Value |
|
|
Text |
|
|
Value (format: YYYYMMDDHHMMSS). |
|
|
Text |
|
|
Integer |
|
|
Text |
|
|
Value |
|
|
Integer |
|
|
Integer |
Note that KPI names in SNMP alerts are sent in UTF-8 format. Any characters in the KPI name not in ISO-Latin-1 format will be replaced by a question mark (?) character. Also, be aware that not all SNMP managers fully support UTF-8. For further information, refer to your SNMP manager product documentation.
Changing the Default SNMP Port
By default, SNMP alerts are sent to port 162. If you want to change this, you should specify the required port as part of the Manager address (Figure 7-11). For example:
194.158.1.23:10162
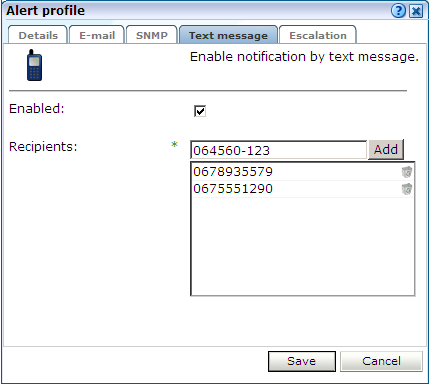
7.5.7 Using Text Message Notifications
To define text message notifications, click the Text message tab to open the dialog shown in Figure 7-13, and do the following:
-
Use the Recipients field to specify the telephone numbers of the users to be notified. Click Add to include a user in the notification list. Note that you can remove a user from the list by clicking the Remove icon to the right of the user.
-
Check the Enable check box to activate text message notification. When ready, click Save.
-
If you have not already done so, you will need to configure an text message provider. If you are warned that one has not already been configured, click the warning link, and follow the instructions described in Section 15.8, "Configuring Text Message Providers".
Footnote Legend
Footnote 1: This screen features the iReasoning MIB Browser (http://www.ireasoning.com). This utility is not distributed as part of RUEI, and requires a separate license. It is intended only to illustrate the structure of the provided MIB file.