Understanding Hardware Counter Instruction Profiling Metrics
This section shows how to use general hardware counters to see how many instructions are executed for functions.
-
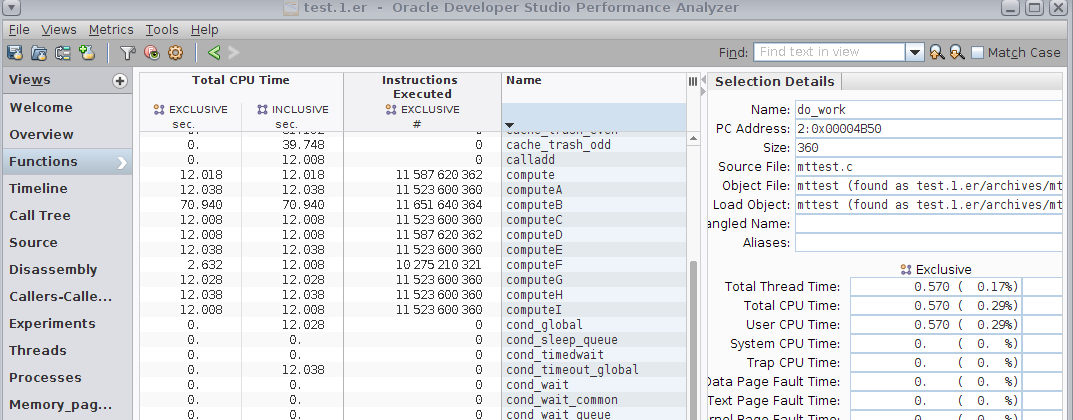
Select the Overview page and enable the HW Counter Profiling metric named Instructions Executed, which is under General Hardware Counters.
-
Return to the Functions view, and click on the Name column header to sort alphabetically.
-
Scroll down to find the functions compute(), computeA(), computeB(), etc.

Note that all of the functions except computeB() and computeF() have approximately the same amount of Exclusive Total CPU time and of Exclusive Instructions Executed.
-
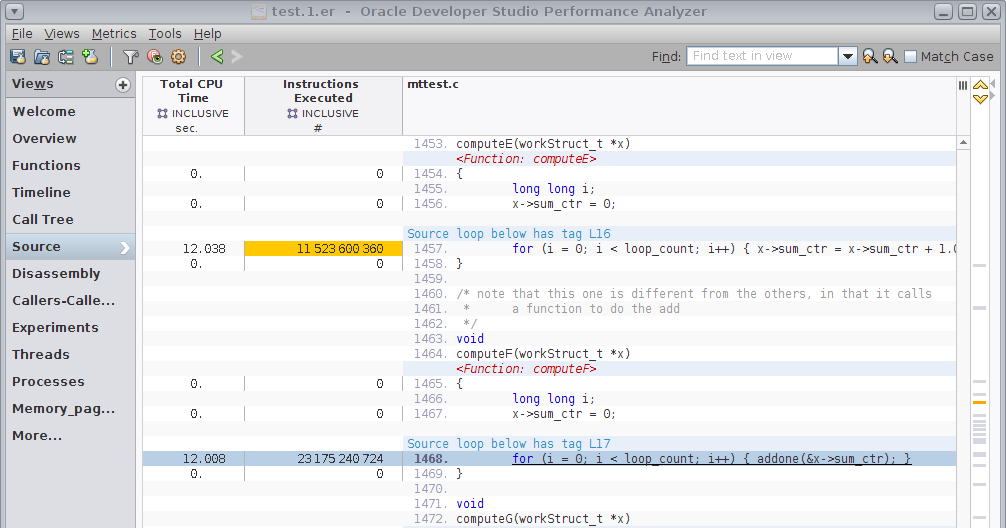
Select computeF() and switch to the Source view. You can do this in one step by double-clicking computeF().

The computation kernel in computeF() is different because it calls a function addone() to add one, while the other compute*() functions do the addition directly. This explains why its performance is different from the others.
-
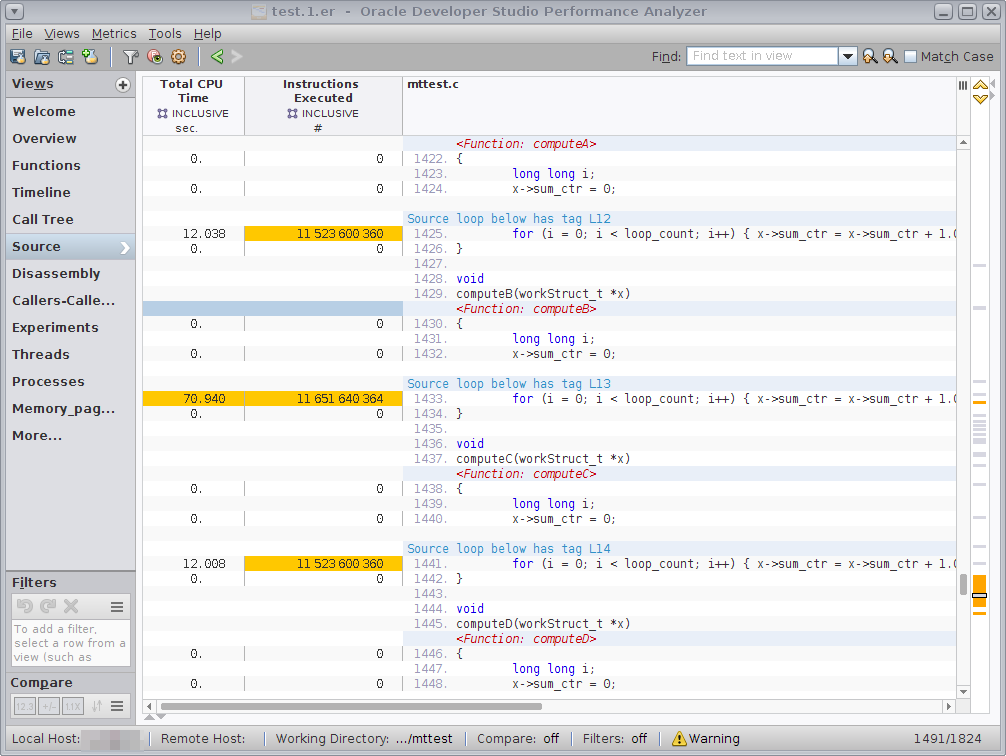
Scroll up and down in the Source view to look at all the compute*() functions.
Note that all of the compute*() functions, including computeB(), show approximately the same number of instructions executed. Yet computeB() shows a very different CPU Time cost.

The next section helps show why the Total CPU time is so much higher for computeB().