5 Oracle Exadata Database Machine Administration
This chapter provides the information needed to administer your Oracle Exadata Database Machine through Oracle Enterprise Manager Cloud Control 13c. The following topics are discussed:
Creating Roles to Manage the Plug-in
To manage the plug-in, you need to create roles and administrators, and then assign roles to administrators. This restricts the privileges that each user has, for example in deleting the plug-in or accessing reports.
Note:
For security reasons, Oracle recommends that theSYSMAN account be used only as a template to create other accounts, and not used directly.To create roles to provide management rights to users:
-
Log in to the Enterprise Manager Cloud Control as the super administrator user.
-
Click Setup, then Security.
-
Select Roles.
On the Security page, a list of predefined roles is provided. These roles can serve as basis to define custom roles to suite specific site level requirements.
Note:
The predefined roles provided cannot be edited or deleted. -
Select a role that closely matches the role you wish to create. Click Create Like.
-
On the Properties page, enter a name for the role you wish to create. You can optionally add a description.
Click Next.
-
On the Roles page, select the roles from the list of Available Roles. Click Move to add the role to Selected Roles.
Click Next.
-
On the Target Privileges page, select the privilege you want to grant to the new role.
Click Next.
-
On the Resource Privileges page, you can edit specific privileges to be explicitly granted. Click the Manage Privilege Grant edit icon to make the changes.
Click Next.
-
On the Administrators page, select the administrators from the list of Available Administrators that you want to grant the new role to. Click Move to add the administrator to Selected Administrators.
Click Next.
-
On the Review page, a complete summary of the new role you have created is displayed. Click Back to go to previous screens to make changes. Click Finish to complete the role creation.
When the newly created administrator logs in, unlike SYSMAN, the administrator is restricted by the privileges set.
Note:
For more information and details, see the Working with Systems Infrastructure Targets chapter of the Oracle® Enterprise Manager Cloud Control Administrator's Guide.View Exadata Database Machine Topology
Database Machine management simplifies monitoring and managing tasks by integrating all hardware and software components into one entity. You do not need to monitor each target individually, but instead you can view the whole Exadata Database Machine as a single target. You can view all critical issues in the system, monitor performance, and drill down to individual targets from the Database Machine target home page.
The following topology topics are presented in this section:
Use the Topology page of Database Machine to view the topology of the system by Cluster or by Database. Clusters are a complete software system starting with a RAC database, the underlying ASM, and CRS. Clusters define one logical entity that is interconnected. The Database Machine could include several clusters, one cluster, or could just be a number of individual databases. While cabinets define the hardware topology of the Database Machine, clusters define the logical or system topology of the Database Machine.
You can view the Topology by Cluster or Database. Click an element in the Topology and view alert data associated with the element.
You can monitor all components of the Database Machine. Database Machine monitors all subcomponent targets, whether hardware or software. This includes the database, ASM, CRS, hosts, Exadata and the InfiniBand network.
To view the topology of an existing Database Machine target:
-
From the Targets menu, select Exadata.
Enterprise Manager displays the Oracle Exadata Database Machines page showing all the available Database Machine targets. From this page, you can add hardware components (such as Oracle Exadata Storage Servers, InfiniBand switches, Ethernet Switches, KVM switches, PDU, and compute node ILOM) in the Oracle Database Machine as managed targets.
-
From the Oracle Exadata Database Machines page, select the Oracle Database Machine target whose topology you want to view.
-
From the Oracle Database Machine Home page, click the Database Machine menu, then select Members Topology from the drop-down menu.
Enterprise Manager Cloud Control displays the Configuration Topology page.
Drilling Down to Individual Targets
You can drill down immediately to a subcomponent target of the Database Machine (such as RAC, a database instance, or an Exadata cell).
To drill down to individual targets:
-
From the Targets menu, select Exadata.
Enterprise Manager displays the Oracle Exadata Database Machines page showing all the available Database Machine targets.
-
From the Oracle Exadata Database Machines page, select the Oracle Database Machine target whose components you want to view.
Enterprise Manager displays the Oracle Database Machine Home page showing an Overview, Schematic, and Incident section for the selected Database Machine.
-
From the Oracle Database Machine Home page, use the left navigation panel to expand the list of available targets that comprise the Database Machine.
-
Click the target to which you want to drill down.
Viewing Critical Hardware Information for the Database Machine
You can view critical metrics for all the hardware subcomponents of the Database Machine such as DB hosts, Exadata Storage Servers, InfiniBand switches and so on. These metrics vary for different component targets. For example, database server nodes and Exadata servers include the CPU, I/O, and storage metrics.
To view critical hardware-centric information for the entire Database machine:
-
From the Targets menu, select Exadata.
Enterprise Manager displays the Oracle Exadata Database Machines page showing all the available DB Machine targets.
-
From the Oracle Exadata Database Machines page, select the Oracle Database Machine target whose hardware information you want to view.
-
From the Oracle Database Machine Home page, view the hardware schematic of the Database Machine.
Viewing DB Machine Alerts
You can view alerts on the Database Machine and drill down to details about each alert. These alerts may be performance/configuration metrics or hardware faults.
To view Database Machine alerts:
-
From the Targets menu, select Exadata.
Enterprise Manager displays the Oracle Exadata Database Machines page showing all the available DB Machine targets.
-
From the Oracle Exadata Database Machines page, select the Oracle Database Machine target whose machine configuration information you want to view.
Enterprise Manager displays the Oracle Database Machine home page on which you can see all alerts associated with the current DB Machine.
Viewing Metrics
To view the Exadata metrics:
-
Navigate to the Exadata Cell home page by choosing the Exadata target from the All Targets page of Enterprise Manager.
Enterprise Manager displays the Exadata Cell Home page for the target you selected.
-
From the Exadata Storage Server drop-down menu, choose Monitoring and then All Metrics.
The All Metrics page appears where you can a wide variety of Exadata metrics. For a complete description of the Exadata metrics available, see the "Oracle Exadata" chapter of the Oracle® Enterprise Manager Oracle Database and Database-Related Metric Reference Manual:
http://docs.oracle.com/cd/E24628_01/em.121/e25160/oracle_exadata.htm
Adding Exadata Components Manually
You can add Exadata components manually using the following steps:
-
From the Setup menu, select Add Target, then select Add Targets Manually.
Enterprise Manager displays the Add Targets Manually page where you can choose the type of target you want to add.
-
From the Add Targets Manually section, choose Add Non-Host Targets by Specifying Target Monitoring Properties.
-
In the Target Type combo box, choose the appropriate target type, for example, KVM for kvm, PDU for pdu, Cisco switch for Cisco, and Oracle ILOM Server for ilom plug-in).
-
Choose the monitoring agent using the search option.
-
Click Add Manually and provide the required properties
Removing an Exadata Database Machine Target
To delete and Exadata Database Machine target, you have the choice to:
-
Remove all members of the Oracle Exadata Database Machine. If the member target is shared with another Database Machine target, then the member target will not be deleted and will continue to be monitored. In other words, the member targets will be deleted if they are associated with only this Database Machine target.
-
Remove only system members of the Oracle Exadata Database Machine. The other member targets will not be deleted and will continue to be monitored. They can be associated to another Oracle Exadata Database Machine, if required.
To remove an Exadata Database Machine target:
-
From the Database Machine target menu, select Target Setup, then select Remove Target.
-
On the Remove page, select whether to remove all members or to remove only the system members.
If you choose to remove all members, then you also have an additional option to unsubscribe SNMP subscriptions for member Exadata Storage Servers and Infiniband Switches. Specify the appropriate user credentials to unsubscribe the SNMP subscriptions.
-
Click Yes to initiate the remove job.
Note:
Host targets for the compute nodes and any targets that are also member targets of another Oracle Exadata Database Machine target will not be removed. System and non-system targets include:System Targets:
-
Oracle Exadata Database Machine
-
Oracle Infiniband Network (Enterprise Manager 12c target)
-
Oracle Exadata Storage Server Grid
Non-System Targets:
-
Oracle Exadata Storage Server
-
Oracle Exadata KVM
-
Systems Infrastructure Switch
-
Systems Infrastructure PDU
-
Systems Infrastructure Rack
-
Oracle Infiniband Switch (Enterprise Manager 12c target)
-
Oracle Engineered System Cisco Switch (Enterprise Manager 12c target)
-
Oracle Engineered System PDU (Enterprise Manager 12c target)
-
Oracle Engineered System ILOM Server (Enterprise Manager 12c target)
Deleting a Component of a Database Machine Target
If you need to remove a component of an Exadata Database Machine target, you can perform this task within Enterprise Manager Cloud Control 13c:
-
From the DB Machine home page's Target Navigation pane, right-click on the target item you wish to remove. You may need to expand the Exadata Grid item to view all of the available cells.
-
Select Target Setup, then Remove Target.
-
A warning page will display to confirm the target deletion. Click Yes to continue.
Updating the Exadata Database Machine Schematic Diagram
In some cases, the Exadata Database Machine schematic diagram is not displaying the components correctly. For example:
-
You may have successfully discovered the Exadata Database Machine, but some components are not displaying correctly in the Exadata schematic diagram. Instead, an empty slot is shown in place of the component.
-
The Exadata Database Machine schematic diagram shows shows the status of the component as "red/down" where as individual components would really show that they are up and running fine.
-
You want to re-locate or rearrange the order of the components in the slots of Exadata Database Machine schematic diagram.
To accomplish these tasks, you will need to drop a component from the schematic diagram and add the correct one:
-
Drop a Component from the Exadata Database Machine Schematic Diagram
-
Add Components to the Exadata Database Machine Schematic Diagram
Drop a Component from the Exadata Database Machine Schematic Diagram
To drop a component from the Exadata Database Machine schematic diagram:
-
From the Targets menu, select Exadata.
-
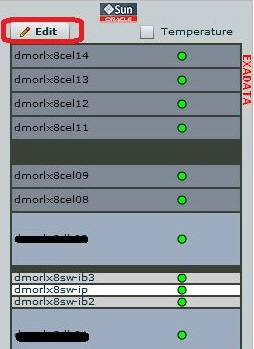
On the Exadata Database Machine schematic diagram, click Edit as shown in Figure 5-1:
-
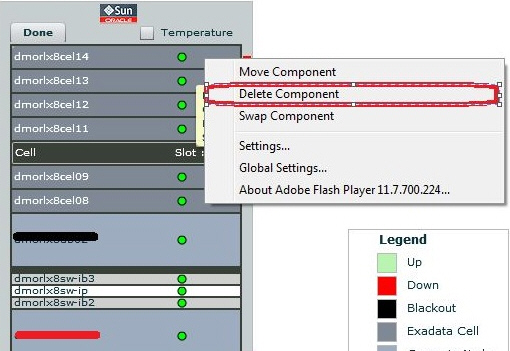
Right-click on the component you want to drop. In the pop-up window, select Delete Component as shown in Figure 5-2:
-
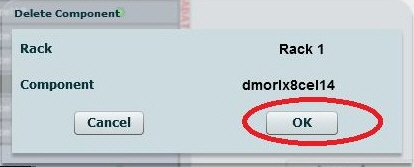
Ensure you have selected the correct component in pop-up shown and click OK as shown in Figure 5-3:
-
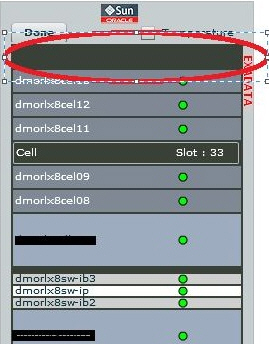
The Exadata Database Machine schematic diagram will refresh to show the empty slot, as shown in Figure 5-4:
-
Once you see the component deleted in the slot you specify, click Done on the Exadata Database Machine schematic diagram.
Add Components to the Exadata Database Machine Schematic Diagram
To add a component from the Exadata Database Machine schematic diagram:
-
From the Targets menu, select Exadata.
-
On the Exadata Database Machine schematic diagram, click Edit.
-
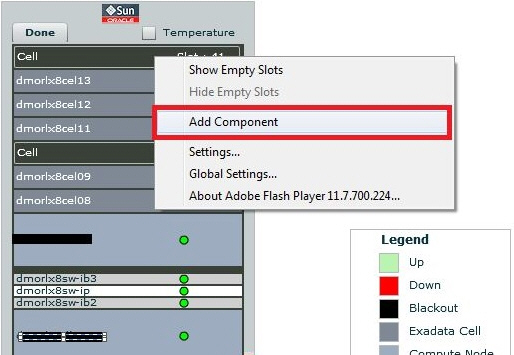
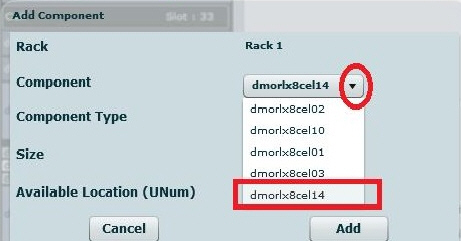
Right-click on the empty slot for the component you want to add. In the pop-up window, select Add Component as shown in Figure 5-5:
-
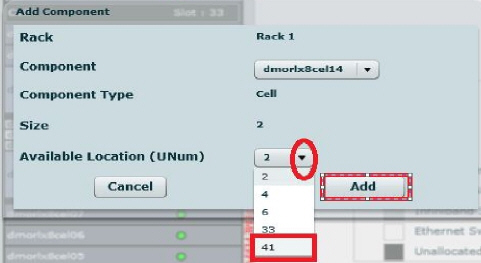
If there are multiple components to be added to schematic diagram, select the correct component from the Component drop-down menu, as shown in Figure 5-6:
Also select the correct slot number in Available Location (Unum) drop-down menu, as shown in Figure 5-7:
Click Add.
-
Once you see the component added in the slot you specify, click Done on the Exadata Database Machine schematic diagram.
Exadata Cell Metrics and Alert Settings
To access the settings for Exadata Cell metrics/alert:
-
From the Enterprise Manager home page, select Targets, then Exadata. Select an Exadata Storage Server from the list.
-
From the Exadata Storage Server menu, click Monitoring, then All Metrics to display all editable metric alert setting.
-
To change a setting, click Monitoring, then Metric and Collection Settings from the Exadata Storage Server menu. The default View option "Metrics with thresholds" is displayed. You can modify the following parameters:
-
Warning Threshold
-
Collection Schedule - click the link to set a collection schedule.
-
Click the Edit icon
 for advanced settings.
-
-
Click OK to save any changes.
Exadata Storage Server Management
This section provides introductory instructions for managing Exadata Storage Servers. The following topics are presented:
About Exadata Storage Server
An Exadata Storage Server is a network-accessible storage array with Exadata software installed on it. Use the Exadata Home page to manage and monitor the Oracle Exadata Storage Server (also known as Exadata cell) by managing it as an Enterprise Manager Cloud Control target. You can discover and consolidate management, monitoring and administration of a single or a group of Oracle Exadata Storage Servers in a datacenter using Enterprise Manager.
Exadata Storage Servers can be discovered automatically or manually. Once discovered, you can add them as Enterprise Manager targets. The individual Exadata Storage Server is monitored and managed as an Enterprise Manager target and provides the exception, configuration and performance information.
Grouping of Exadata Storage Servers is used for easy management and monitoring of the set of Storage Servers. You can group them both manually and automatically. The grouping function provides an aggregation of exceptions, configuration and performance information of the group of cells.
You can view performance analysis by linking Exadata performance both at a cell level and group level to ASM and database performance. You can drill down to Exadata configuration and performance issues from both the database and ASM targets.
Storage Grid (for example, multiple database/ASM instances sharing the same Exadata Storage Server) is supported to the same extent as dedicated storage.
Using Exadata As a Cloud Control Target
Use Oracle Exadata to manage and monitor the Oracle Exadata Storage Server (also known as Exadata cell) by managing the Exadata cells as Enterprise Manager Cloud Control targets. You can discover and consolidate management, monitoring and administration of a single or a group of Oracle Exadata Storage Servers in a datacenter using Enterprise Manager.
Exadata cells can be discovered automatically or manually. Once discovered, you can add the Exadata cells as Enterprise Manager targets.
The individual Exadata cell is monitored and managed as an Enterprise Manager target and provides the exception, configuration and performance information.
Grouping of Exadata cells is used for easy management and monitoring of the set of Exadata cells. You can group Exadata cells both manually and automatically. The grouping function provides an aggregation of exceptions, configuration and performance information of the group of cells.
You can view performance analysis by linking Exadata performance both at a cell level and group level to ASM and database performance. You can drill down to Exadata configuration and performance issues from both the database and ASM targets.
Viewing an Exadata Storage Server Configuration
You can view the configuration of an Oracle Exadata Storage Server target by following the steps below:
-
Navigate to the Exadata Storage Server home page by choosing the Exadata target for which you want to view the IORM Performance page from the All Targets page.
Enterprise Manager displays the Exadata Storage Server Home page for the target you selected.
-
From the Target menu, choose Configuration and then Topology.
Enterprise Manager displays the Configuration Topology page for the selected Exadata Storage Server. The topology page provides a visual layout of a the target's relationships with other targets. From this page you can:
-
Do a target search filtered by target status/events/target type)
-
Select from a set of relationships to represent in the graph
-
Select annotations to display in the graph, such as alerts and link labels
-
Select from a set of options: view navigator, expand or collapse all, toggle graph layout, reload topology
-
Print
-
Zoom via the slide control
-
Pan via the navigator control
-
Toggle the presentation from graph to table
When you hover over a node or group member, a popup displays detailed information about the entity. A link can appear in the popup to more detailed information such as customer documentation.
-
Performing Administration Tasks on Exadata Storage Servers
To perform an administration operation on an Exadata Storage Server, such as executing a cell command, follow these steps:
-
Navigate to the Exadata Storage Server home page by choosing the Exadata target for which you want to perform an administrative task from the All Targets page.
Enterprise Manager displays the Exadata Storage Server Home page for the target you selected.
-
Click Target, then select Administration.
From this menu you can choose either Execute Cell Command, Support Workbench, or Manage IO Resource.
-
Click Execute Cell Command.
The Command page of the Exadata Storage Server Administration wizard appears. Enter a CELLCLI command as the administrative command to be executed on the cell. You must read the Command Instructions before you enter a command. Only a single CELLCLI command is allowed to execute. You must enter the command without the
cellcli -eprefix, which is automatically appended when you submit the command. Finally, you cannot use the following characters: ; / ' < > / |. -
Click Next to continue.
Enterprise Manager displays the Admin Credentials page. Select or enter the Administration credentials to execute the command. The credentials you enter are used when submitting the operation. You can choose between Preferred Credentials, Named Credentials, and New Credentials. You can also click More Details to view information about Credential Type, Last modified, Credential Name, Credential Owner, Last Modified Date, Last Modified By, and Preferred Credentials Set At.
-
Click Next.
Enterprise Manager displays the Schedule page. Use the Schedule page to schedule the administration task. Enter the Job Name and the Job Description, then provide the job information in the Schedule the Administration Job section. You can choose to begin the job immediately or enter the time you want the job to begin.
-
Click Next to continue.
The Summary page displays. Use the Summary page to ensure you have entered the correct values and then submit the command. The Summary page lists the Job Name, Description, Command to Execute, when the job is Scheduled, and the Selected Cell.
-
Click Submit Command to submit the job.
The Job Status page displays. Use the Job Status page to link to the Job Detail page of the administration task.
Managing the IO Resource
Oracle Exadata Database Machine Cells are added as targets during the database machine discovery workflow (see Chapter 3, "Exadata Database Machine Discovery") and are grouped automatically under the group Exadata Storage Server Grid.
To access the IORM Performance page:
-
Select an Exadata Storage Server cell. One way to select the cell:
-
From the Targets menu, select Exadata.
-
Select a DB Machine from the list of Target Names.
-
In the Target Navigation pane, expand the Exadata Grid item and click one of the cells.
-
-
Once you have selected an Exadata Storage Server cell, click the Exadata Storage Server menu, select Administration, then Manage IO Resource.
Once you have accessed the IORM page, you can make the following modifications:
The IORM Monitoring section of the page provides a view of the performance statistics of Disk IO (Wait, IOPS, MBPS, Utilization, Latency, and Objective charts). These statistics help to identify which databases and consumer groups are using the available resources. They also help to adjust the IORM configuration (using IORM Settings section on the same page) as needed.
For further details on managing I/O resources, refer to the Managing I/O Resources chapter in the Oracle® Exadata Storage Server Software User's Guide.
Add/Update IORM Configuration
To update the I/O Resource Manager (IORM) settings (for Exadata Storage Server software release 12.1.2.1.0 and later):
-
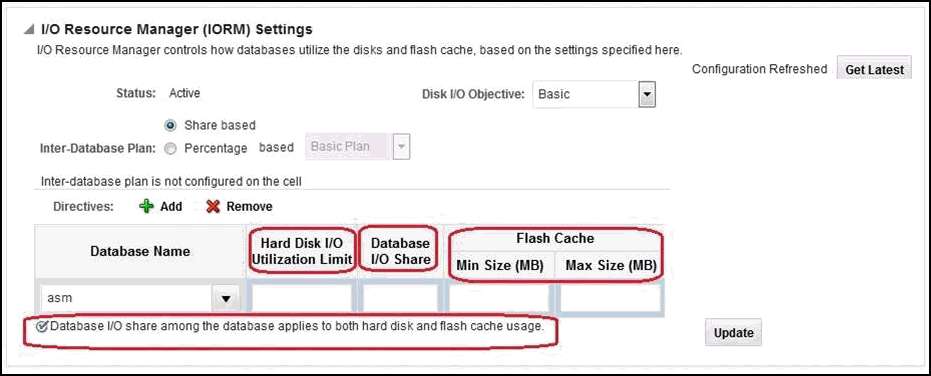
Navigate to the IORM Performance page as described above. Figure 5-8 shows the I/O Resource Manager (IORM) Settings pane.
Note:
You can also update a single cell. Expand the Exadata Grid group to view all cells associated with the group. Click the cell you want to update.The steps to update the IORM settings is the same for a single cell or group of cells.
-
From the Database Name column, select a database from the drop-down menu.
-
Enter a value for the Hard Disk I/O Utilization Limit column.
-
Enter a value for the Database I/O Share column.
-
Enter minimum and maximum values (in MB) for the Flash Cache column.
-
In the Disk I/O Objective drop-down menu, select an objective from the list (Auto is the default):
-
Low Latency - Use this setting for critical OLTP workloads that require extremely good disk latency. This setting provides the lowest possible latency by significantly limiting disk utilization.
-
Balanced - Use this setting for critical OLTP and DSS workloads. This setting balances low disk latency and high throughput. This setting limits disk utilization of large I/Os to a lesser extent than Low Latency to achieve a balance between good latency and good throughput.
-
High Throughput - Use this setting for critical DSS workloads that require high throughput.
-
Auto - Use this setting to have IORM determine the optimization objective. IORM continuously and dynamically determines the optimization objective, based on the workloads observed, and resource plans enabled.
-
Basic - Use this setting to disable I/O prioritization and limit the maximum small I/O latency.
Click Update. The Exadata Cell Administration Wizard will appear prompting you for the information necessary to complete the Disk I/O Objective configuration:
-
On the Command page, the Cell Control Command-Line Interface (CellCLI) value should be:
# alter iormplan objective = 'auto'
Click Next.
-
On the Admin Credentials page, enter the username and password for the selected cells.
Click Next.
-
On the Schedule page, enter a job name (required) and job description (optional). Select an option to start Immediately or Later. If you select the Later option, enter the time you want the job to run.
Click Next.
-
On the Review page, verify the settings are correct. If there are no changes, click Submit Command.
-
Once the job is successfully submitted, the Job Status page will display.
Click Return to return to the I/O Resource Manager (IORM) Settings pane.
-
-
Click Get Latest to refresh the page, which will include your Disk I/O Objective selection.
-
Confirm the IORM objective settings. From the command line, run the following command:
# dcli -g cell_group cellcli -e "list iormplan attributes objective"
Output should show a value of auto:
cell01: auto
cell02: auto
cell03: auto
.
.
.
cell14: auto
The Inter-Database Plan
An inter-database plan specifies how resources are allocated by percentage or share among multiple databases for each cell. The directives in an inter-database plan specify allocations to databases, rather than consumer groups. The inter-database plan is configured and enabled with the CellCLI utility at each cell.
The inter-database plan is similar to a database resource plan, in that each directive consists of an allocation amount and a level from 1 to 8. For a given plan, the total allocations at any level must be less than or equal to 100 percent. An inter-database plan differs from a database resource plan in that it cannot contain subplans and only contains I/O resource directives. Only one inter-database plan can be active on a cell at any given time.
You can view the current configured inter-database plan and update an existing Percentage/Share based inter-database plan and a new Percentage/Share based plan can be configured using the Add/Remove options.
You can also view Share, Percentage Radio buttons and a drop down with Basic, Advance options.
Note:
If the Exadata plug-in version is 12.1.0.3.0 and earlier or if the Exadata Storage Server version is 11.2.3.1.0 or earlier, the Share, Percentage based inter-database plan radio buttons are not available. You can view only Percentage-based options (that is, the drop-down only displays the Basic, Advance options).When considering an inter-database plan:
-
If Oracle Exadata Storage Server is only hosting one database, then an inter-database plan is not needed.
-
If an inter-database plan is not specified, then all databases receive an equal allocation.
For further details on the inter-database plan, refer to the About Interdatabase Resource Management section in the Oracle® Exadata Storage Server Software User's Guide.
Diagnosing Exadata Cell Alerts
Enterprise Manager listens for Exadata Cell alerts sent from the Exadata Cell Management Server; so, any hardware failure or cell error will be reported in Enterprise Manager. For detailed cell error code and its interpretation, refer to the Hardware Alert Messages section in Appendix B, "Alerts and Error Messages" of the Oracle® Exadata Storage Server Software User's Guide.
Accessing Oracle Support Workbench for Exadata Storage Server
You can access the Oracle Support Workbench for the current Exadata Storage Server to access diagnostic data for problems and incidents related to the cell.
To access the Support Workbench for a single Exadata cell, follow these steps:
-
From the Target menu of the Exadata Storage Server for which you want to access the Oracle Support Workbench, choose Administration.
-
From the Administration menu, select Support Workbench.
The Login to Support Workbench page displays where you can enter the credentials required to access the Workbench.
-
Choose the type of cell administration credential you want to use from the Credential section.
You can choose Preferred Credential, Named Credential, or New Credentials.
-
Depending on what you chose in Step 3, enter the Credential Details (Username and Password) in the appropriate fields. You can turn on the More Details Option to see more details about the credentials.
-
Click Continue to display the Oracle Support Workbench.
Managing the InfiniBand Network
All InfiniBand Switches are discovered automatically during the database machine discovery workflow (see Chapter 3, "Exadata Database Machine Discovery") and are grouped automatically under the group IB Network.
-
From the Enterprise Manager home page, select Targets, then Oracle Exadata Database Machine.
-
In the Target Navigation pane, select IB Network from the list.
-
In the IB Network pane, you can view an overview and activity summary for all InfiniBand Switches.
-
Click Refresh for an On Demand refresh of the InfiniBand schematic. Updates reflect the real-time data.
The following topics address managing your InfiniBand network:
InfiniBand Metrics
The following metrics are available for your InfiniBand Network:
Aggregate Sensor
The Aggregate Sensor takes input from multiple sensors and aggregates the data to identify problems with the switch that require attention. Whenever the sensor trips into an "Asserted" state (indicating a problem) or "Deasserted" (indicating that the problem is cleared) for a component on the switch, associated Enterprise Manager events will be generated.
Response
This is the main metric indicating availability of the InfiniBand switch. It is collected every 60 seconds by default through the management interface of the switch.
Switch Configuration
This metric captures the switch configuration. The information collected is valuable only to Oracle Support, which will use it to assist in debugging situations.
Performing Administration Tasks on Infiniband Networks
To perform an administration operation on an Infiniband Network, follow these steps:
-
Navigate to the DB Machine home page of the Infiniband Network by choosing the DB Machine for which you want to perform an administrative task from the All Targets page.
Enterprise Manager displays the DB Machine Home page for the target you selected.
-
Select the IB Network for which you want to perform an administrative task.
-
From the Target menu item, choose Administration.
The Target & Command page of the Infiniband Network Administration wizard appears.
-
Choose the Target Type and then select the target on which you want to perform the administrative task from the Target drop-down list. Enter the administrative command you want to execute. The available operations from which you can select are dependent on the target type and target you selected. Once you choose the operation, you may need to select a value that will appear after choosing the operation.
-
Click Next to continue.
Enterprise Manager displays the Credentials & Schedule page. Select or enter the credentials to execute the command. The credentials you enter are used when submitting the operation. You can choose between Preferred Credentials, Named Credentials, and New Credentials. Schedule the administration task. Provide the job information in the Administration Job Schedule section. You can choose to begin the job immediately or enter the time you want the job to begin
-
Click Next to continue.
The Review page appears. Use the Review page to ensure you have entered the correct values and then submit the command. The Review page lists the Job Name, Description, Command to Execute, when the job is Scheduled, the Target Type, and the Selected Target.
-
Click Submit Command to submit the job.
When you click Submit Command, a popup is shown if the job is successful. You can go to the Job Detail Page or back to the page from where this wizard was launched.
Setting Up Alerts
After configuring the InfiniBand Switch targets to send SNMP alerts, set up alerts in Enterprise Manager Cloud Control.
-
Log in to Enterprise Manager Cloud Control.
-
Click Targets, then All Targets. All discovered targets will display.
-
In the All Targets page, click Oracle Exadata InfiniBand Switch.
-
Click the target you are interested in. The target home page appears.
-
In the drop-down menu for the Oracle Exadata InfiniBand Switch, select Metric and Collection Settings.
-
In the Metric and Collection Settings page, you can modify metric threshold values, edit monitoring settings for specific metrics, change metric collection schedules, and disable collection of a metric.
You can modify the thresholds directly in the table or click the edit icon (pencil icon) to access the Edit Advanced Settings page. For more information on the fields displayed in this page and how the thresholds can be modified, click Help from the top-right corner of this page.
Flash Cache Resource Monitoring
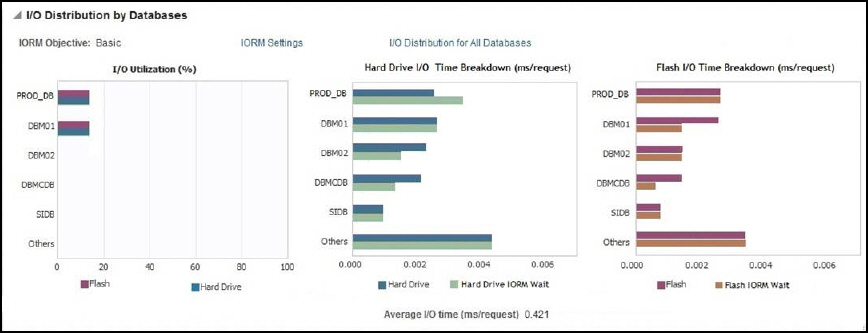
The Oracle Exadata plug-in release 13.1.0.1.0 and above provides flash cache resource monitoring for Oracle Exadata Storage Servers. From the Storage Server home page or from the IO Distribution Detail page, Cloud Control provides a high-level overview of flash cache resources (Figure 5-9). Details include:
-
I/O Utilization (as a percentage).
-
Hard Drive I/O Time Breakdown (in milliseconds per request).
-
Flash I/O Time Breakdown (in milliseconds per request).
From the IO Distribution Details page, which provides a view of all available databases statistics, select Table View (the default is Graph View) to view the data as a table (Figure 5-10):
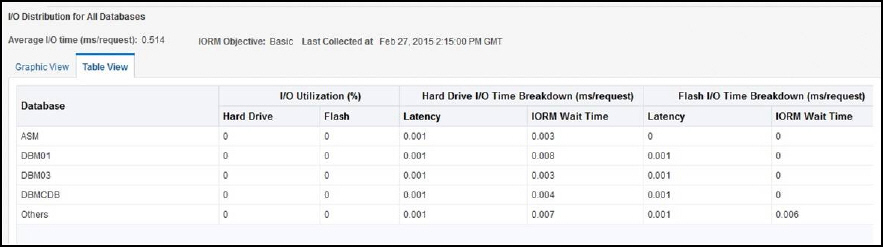
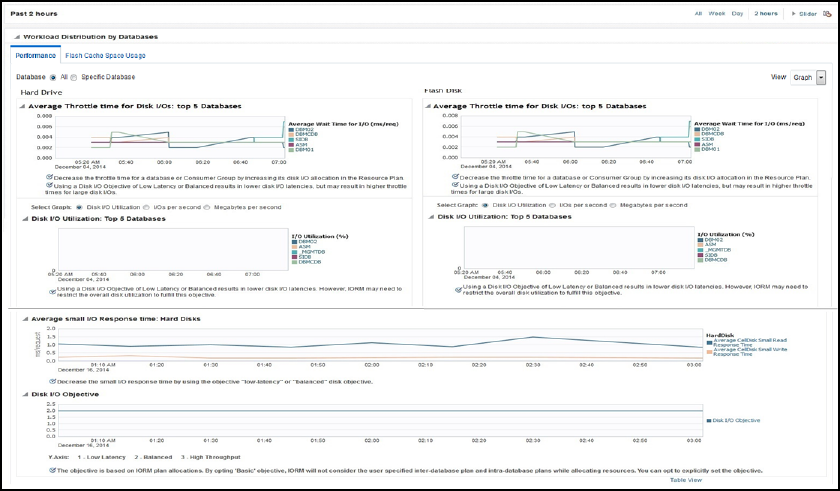
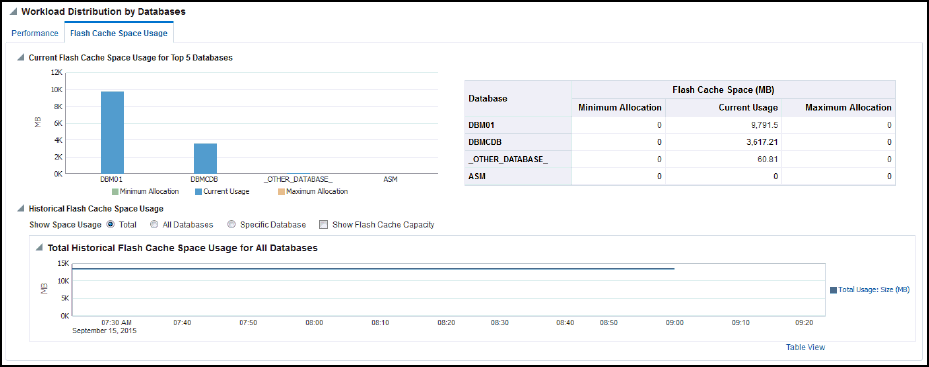
The IORM Performance Page (Figure 5-11) provides detailed metrics, such as Average Throttle Time for Disk I/Os for both hard drives and flash drives. Select Flash Cache Space Usage (Figure 5-12) for detailed performance about flash cache space.
Exadata Database Machine Fault Monitoring
Oracle Enterprise Manager Cloud Control provides hardware fault monitoring for Oracle Exadata Database Machine. Table 5-1 shows the fault monitoring for the Exadata Storage Server. Table 5-2 shows the fault monitoring for the compute nodes.
Note:
The fault monitoring information in the following tables, while comprehensive, may not always be complete. As new fault monitoring functionality is added, these tables will be updated accordingly.Table 5-1 Exadata Storage Server Fault Monitoring
| Area | Fault Monitoring |
|---|---|
|
Access |
Cell cannot be accessed (e.g. ping failure). |
|
Memory |
Memory Controller Error Memory DIMM Error Memory Channel Error Memory DIMM Temperature Sensor Error Memory Correctable ECC Error |
|
CPU |
Internal Processor Error Intel 5500 Chipset Core Error Data Cache Error Cache Error Instruction Cache Error |
|
ESM |
ESM Battery Charge Error ESM Battery Life Error |
|
Hard Disk |
SCSI Error for Media, Device Disk Temperature Threshold Excess Physical Disk Not Present Block Corruption |
|
Flash Disk |
Flash Disk Failure Flash Disk Predictive Failure Flash Disk not Present |
|
Miscellaneous |
Chassis or Power Supply Fan Error PCI-E Internal Error Power Supply Voltage Excess Error Temperature Excess Error Network Port Disconnection and Fault |
Table 5-2 Compute Node Fault Monitoring
| Area | Fault Monitoring |
|---|---|
|
Memory |
Memory Controller Error Memory DIMM Error Memory Channel Error Memory DIMM Temperature Sensor Error Memory Correctable ECC Error |
|
CPU |
Internal Processor Error Intel 5500 Chipset Core Error Data Cache Error Cache Error Instruction Cache Error |
|
Disk |
SCSI Error for Media, Device Disk Temperature Threshold Excess Block Corruption |
|
Miscellaneous |
Chassis or Power Supply Fan Error Non-fatal PCI-E Internal Error Power Supply Voltage Excess Error Temperature Excess Error Network Port Disconnection and Fault |
Monitoring Exadata Database Machine Components
Enterprise Manager collects details for the following components:
Storage Cells
An Enterprise Manager Agent runs the cellcli command via ssh to collect Storage Cell metrics. SNMP traps are sent to the Enterprise Manager Agent for subscribed alert conditions.
Monitoring requires the cellmonitor ssh eq setup with an Agent user.
ASM targets and disk groups are associated.
On the home page, rich storage data is collected, including:
-
Aggregate storage metrics.
-
Cell alerts via SNMP (PUSH).
-
Capacities.
-
IORM consumer and Database-level metrics.
InfiniBand Switches
An Enterprise Manager Agent runs remote ssh calls to the InfiniBand switch to collect metrics. The InfiniBand Switch sends SNMP traps (PUSH) for all alerts.
Monitoring requires ssh eq. for the nm2user for metric collections such as:
-
Response
-
Various sensor status
-
Fan
-
Voltage
-
Temperature
-
-
Port performance data
-
Port administration
Cisco Switch
An Enterprise Manager Agent runs a remote SNMP get call to collect metric data for the Cisco switch, including details on:
-
Status / Availability
-
Port status
-
Vital signs: CPU, Memory, Power, Temperature
-
Network interface various data
-
Incoming traffic errors, traffic kb/s and %
-
Outgoing traffic errors, traffic kb/s and %
-
Administration and Operational bandwidth Mb/s
-
ILOM Targets
An Enterprise Manager Agent runs remote ipmitool calls to each Compute Node ILOM target. Monitoring requires the nm2user user credentials to run ipmitool.
The following details are collected:
-
Response – availability
-
Sensor alerts
-
Temperature
-
Voltage
-
Fan speeds
-
Configuration Data: Firmware version, serial number, and so forth.
-
Power Distribution Units (PDUs)
An Enterprise Manager Agent runs remote SNMP get calls and receives SNMP traps (PUSH) from each PDU. Collected details include:
-
Response and
pingstatus. -
Phase values.
KVM Switch
An Enterprise Manager Agent runs remote SNMP get calls and receives SNMP traps (PUSH) from the KVM switch. Collected details include:
-
Status and response.
-
Reboot events.
-
Temperature.
-
Fan status.
-
Power state.
-
Factory settings.
Using the Conversion Wizard to Convert 12c Targets to 13c Targets
To convert an Exadata Database Machine discovered by Enterprise Manager 12c to be monitored by Enterprise Manager 13c:
-
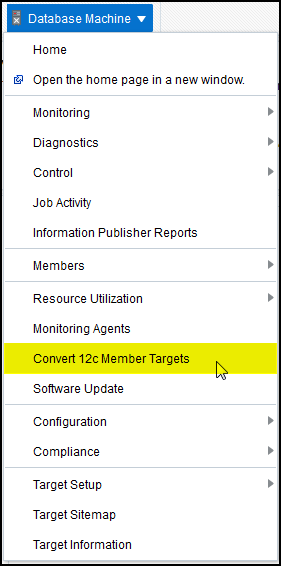
From the Database Machine menu, select Convert 12c Member Targets (Figure 5-13):
-
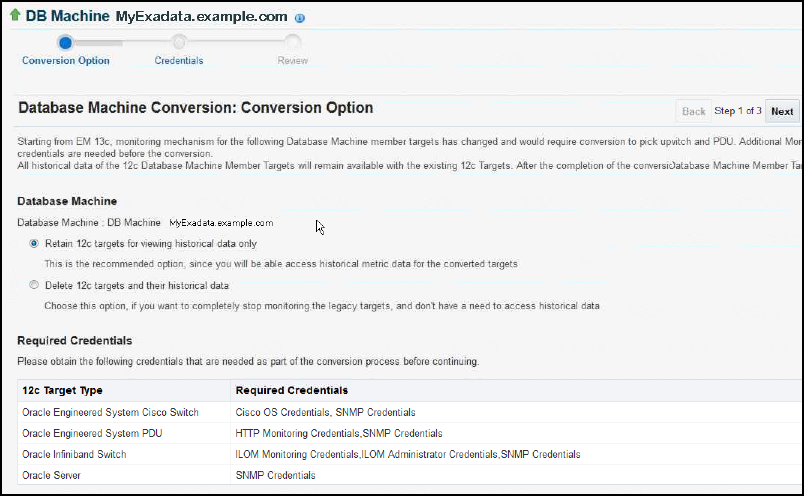
Select a Conversion Option (Figure 5-14):
-
(Default) Delete 12c targets and their historical data. This option halts all monitoring of legacy targets and deletes the historical data. This options allows for a clean start for all Enterprise Manager 13c target monitoring.
-
Retain 12c targets and their historical data. This option preserves the historical data for legacy targets.
Once you have selected a conversion option, click Next.
-
-
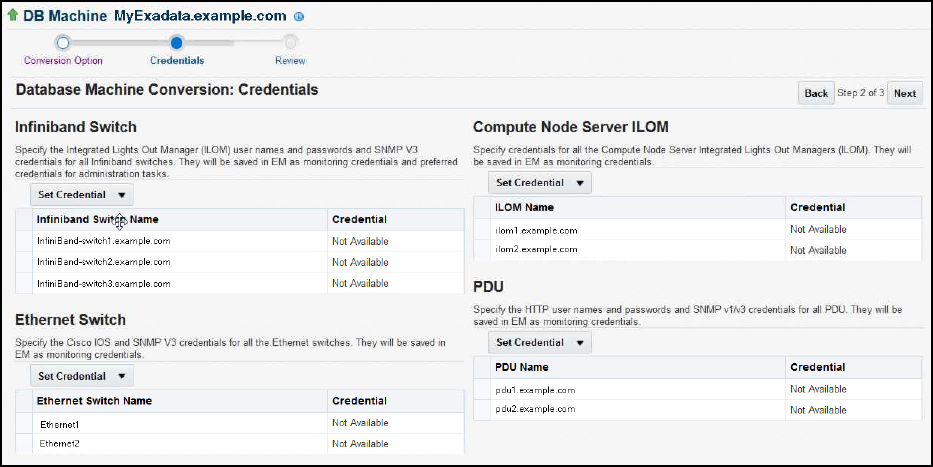
Set the Credentials (Figure 5-15). For the conversion, you must set the credentials for the Exadata Database Machine components to be converted.
From the Set Credential menu, you can set the credentials for a single component or for the entire component types:
-
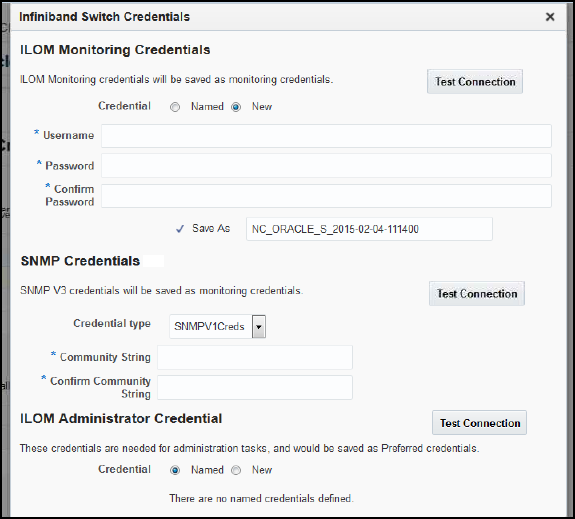
InfiniBand Switch (Figure 5-16)
Enter the username and password for the InfiniBand Switch's ILOM administration.
In the SNMP Credentials section:
If you select SNMP V1 from the Credential type drop-down, then enter public for the Community String.
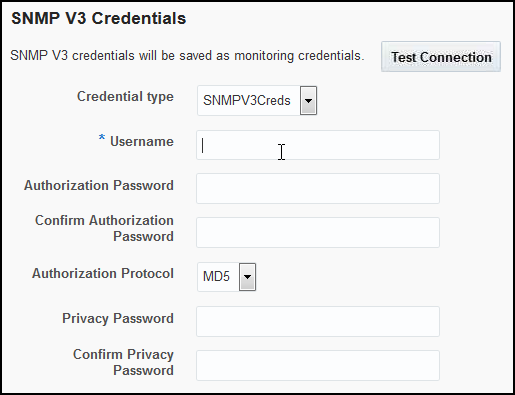
If you select SNMP V3 credentials for the Credential Type, then enter a username and authorization password, select an authorization protocol, and enter a privacy password, as shown in Figure 5-17:
Click Test Connection for any credential to verify the connection. Click OK.
-
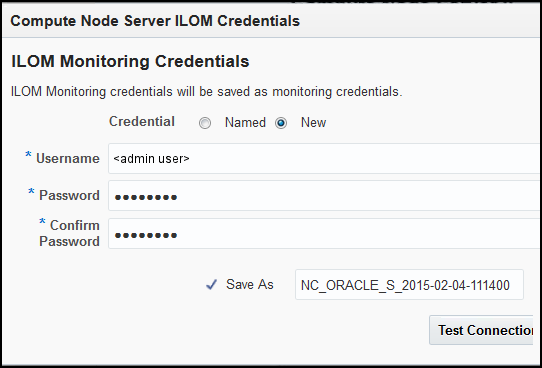
Compute Node Server ILOM
To set the Compute Node Server ILOM, select New and enter a username and password, as shown in Figure 5-18:
Click Test Connection for any credential to verify the connection. Click OK.
-
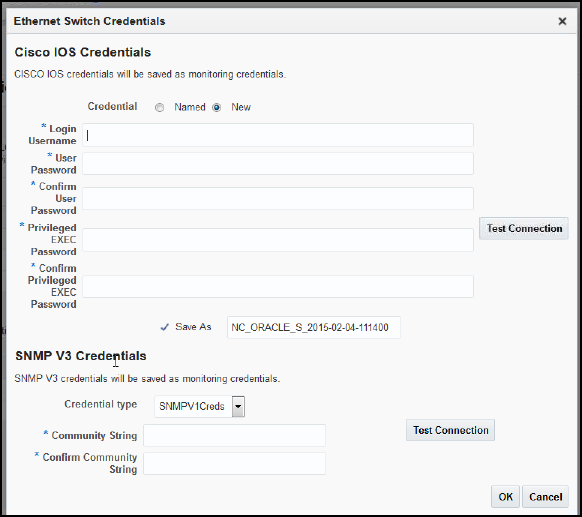
Ethernet Switch (Figure 5-19)
To set the Ethernet Switch credentials, enter the Cisco IOS username, password, and privileged EXEC password. For the SNMP V3 credentials, enter a username and authorization password, select an authorization protocol, and enter a privacy password.
Click Test Connection for any credential to verify the connection. Click OK.
-
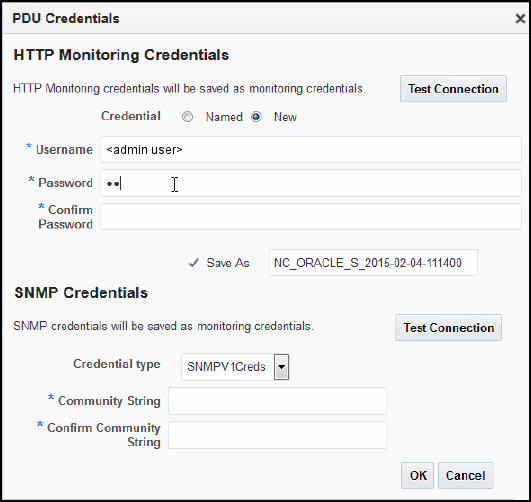
PDU
To set the HTTP monitoring credentials, select New and enter a username and password. For the SNMP V3 credentials, enter a username and authorization password, select an authorization protocol, and enter a privacy password.
Click Test Connection for any credential to verify the connection. Click OK.
Once you have set the credentials, the Credentials page will update to show the credentials set for all components to be converted. Click Next.
-
-
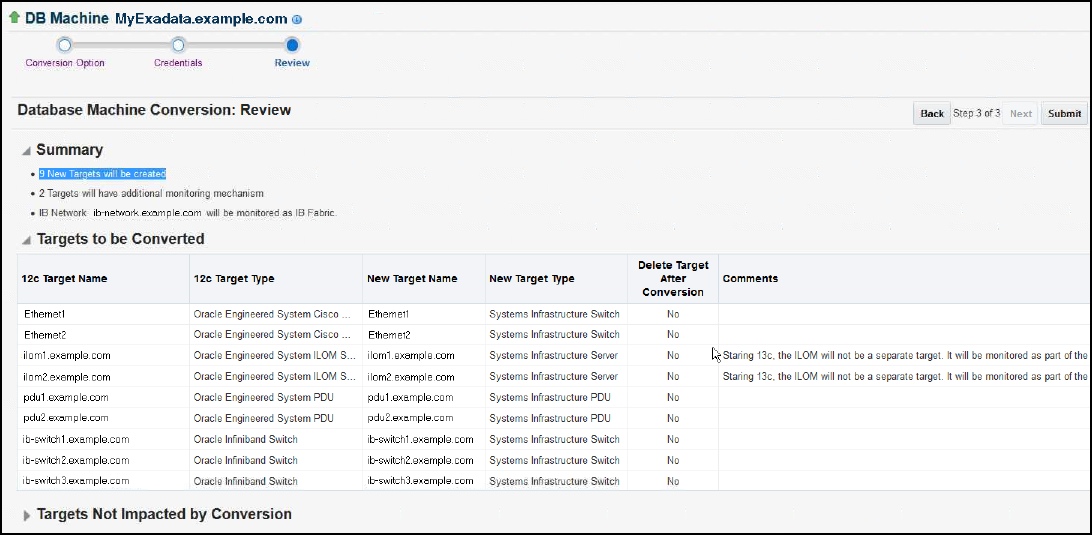
Review the components to be converted in the following three sections (Figure 5-21):
-
Summary: This section summarizes the number of targets to be converted and if any targets will have additional monitoring information available to you after the conversion.
-
Targets to be Converted: This table shows all Enterprise Manager 12c targets to be converted for monitoring by Enterprise Manager 13c and provides the new target name information.
-
Targets Not Impacted by Conversion: All components of the Exadata Database Machine do not need to be converted to be monitored by Enterprise Manager 13c. This list identifies those components that to not need to be converted. These components are already monitored by Enterprise Manager 13c.
Click Submit to begin the conversion.
-
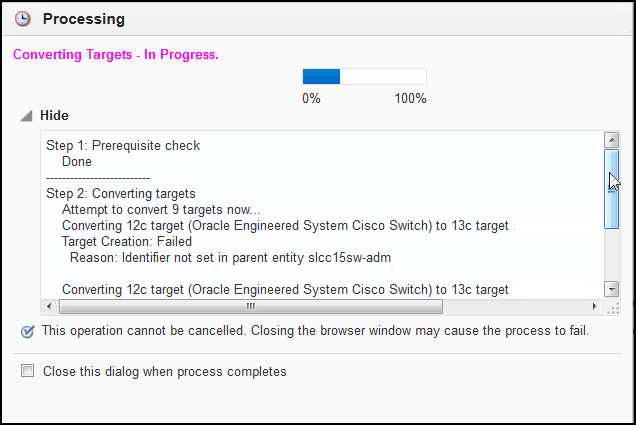
-
A Processing pop-up window will appear (Figure 5-22), which shows you the status of the conversion and a summary of the success or failure of the components to be converted.
Do not close this window until the processing is complete!
You can select the option to close the window after the processing is complete, or click Done.
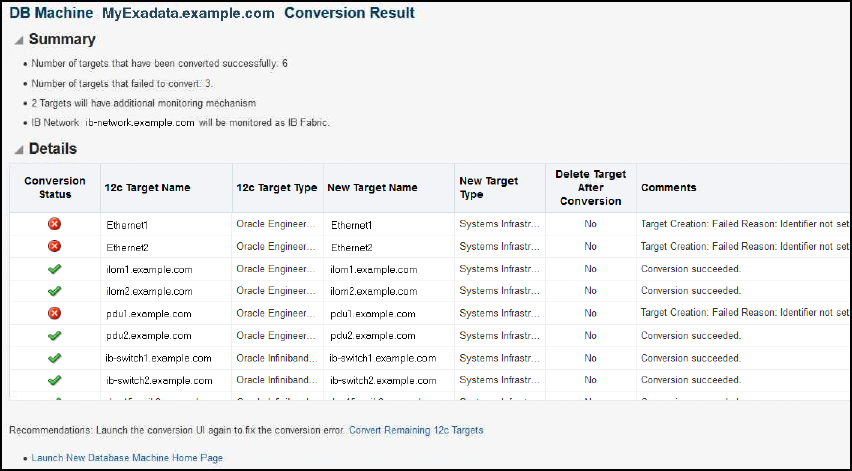
-
Once processing is complete, a Conversion Results page (Figure 5-23) provides a summary of the components converted and details of each component that succeeded or failed to be converted:
From this page, click Convert Remaining 12c Targets to repeat the conversion process for those components that failed to be converted. Click Launch New Database Machine Home Page to view the updated home page with all converted components monitored by Enterprise Manager 13c.