13 Managing Security-Related Information
This chapter describes the use of Collector profiles and the configuration of the security-related settings used by RUEI for traffic monitoring. These include setting network filters to prevent the capturing of specific networks, hosts, Virtual Local Area Networks (VLANs), or to reduce overall monitored traffic. The security of sensitive data can also be maintained by specifying masking actions for HTTP protocol items (such as HTTP headers and cookies). Finally, the managing of your web server's private keys to handle encrypted secure traffic is also described.
The management of all security-related information is the responsibility of the Security Officer.
13.1 Managing Collector Profiles
In order to facilitate the easy management of Collectors, each Collector is assigned to a Collector profile. When configuration changes are made to a Collector profile, they are automatically applied to all Collectors assigned to it.
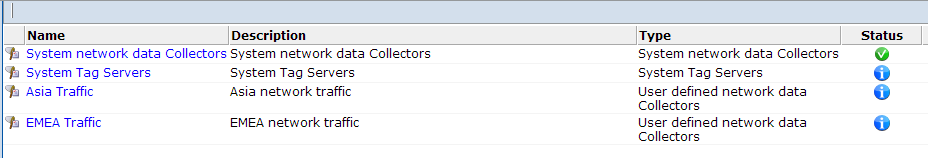
Upon installation, two predefined Collector profiles are created:
-
System network data Collector (for network based data collection)
-
System tag server (for tag based data collection)
You can create additional profiles to meet your reporting requirements by copying an existing profile as the basis for the new one. Note that, unlike user-defined Collector profiles, the System Collector profile cannot be deleted.
To view the currently available Collector profiles, Select Configuration, then Security, and then Collector profiles. An example is shown in Figure 13-1.
For each Collector profile, the options shown in Table 13-1 are available from its context menu.
Table 13-1 Collector Profile Context Menu
| Option | Description |
|---|---|
|
Configure |
Allows you to specify the configuration of all Collectors assigned to the selected profile. These include the use of network filters, the TCP ports on which Collectors should listen, and the private keys used to decrypt secure traffic. This is described in Section 13.1.2, "Modifying Collector Profile Configurations". You can specify whether Collectors assigned to a profile are restarted automatically, or whether a required manual restart is indicated, after configuration changes to a profile. This is described in Section 13.1.6, "Restarting Collectors". |
|
Copy |
Uses the selected Collector profile as the basis for a new one. This is described in Section 13.1.1, "Creating Collector Profiles". |
|
Edit properties |
Allows you to modify the Collector profile's name and brief description. Note that the default Collector profile's properties cannot be modified. |
|
Remove |
Deletes the selected Collector profile. Note that if the select profile has Collectors assigned to it, these are automatically re-assigned to the default (System) Collector profile. Note that it is not possible to delete the default Collector profile. |
13.1.1 Creating Collector Profiles
In order to create a new Collector profile, do the following:
-
Select Configuration, then Security, and then Collector profiles. The currently defined Collector profiles are displayed. An example is shown in Figure 13-1.
-
Select Copy from the context menu of the Collector profile you want to use as a basis for the new one. The dialog shown in Figure 13-2 appears.
Figure 13-2 Copy Collector Profile Dialog
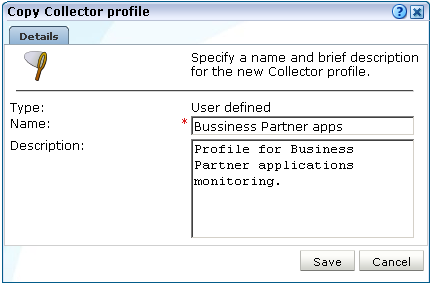
Description of ''Figure 13-2 Copy Collector Profile Dialog''
-
Specify a unique name and, optionally, a brief description for the new Collector profile. It is recommended that the description provides an indication of the profile's purpose and scope. When ready, click Save. Upon creation, the new profile appears in the list of available Collector profiles (Figure 13-1).
-
Configure the new Collector profile to meet your monitoring requirements. This is described in Section 13.1.2, "Modifying Collector Profile Configurations".
13.1.2 Modifying Collector Profile Configurations
After creating a new profile, its configuration is the same as the profile upon which it is based. In order to modify its configuration to meet your requirements, do the following:
-
Click the required profile from the list of available Collector profiles (Figure 13-1), or select Configure from its context menu. A window opens showing the Collectors currently assigned to the selected profile. An example is shown in Figure 13-3.
Figure 13-3 Network Data Collectors Status Window
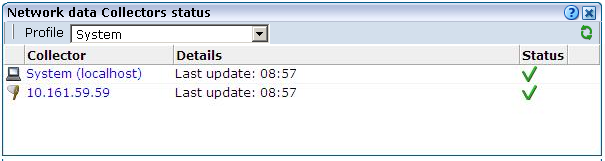
Description of ''Figure 13-3 Network Data Collectors Status Window''
-
From the Configuration menu, select Configure to modify the Collector profile's configuration. The options shown in Table 13-2 are available.
Table 13-2 Collector Profile Configuration Options
Option Description Protocols
Select this option to specify on which TCP ports Collectors assigned to the profile should listen. This is described in Section 13.3, "Managing the Scope of Network Based Monitoring".
Network filters
Select this option to specify whether collectors assigned to the profile should be restricted to monitoring specific segments of network traffic, or to specific servers and subnets. This is described in Section 13.4, "Defining Network Filters".
SSL keys
Select this option to specify the certificates that will be imported to each of the profile's assigned Collectors to monitor encrypted content. This is described in Section 13.5, "Managing SSL Keys".
Collector restart method
Select this option to specify whether Collectors assigned to the profile should be restarted automatically after configuration changes. This is described in Section 13.1.6, "Restarting Collectors."
13.1.3 Assigning Collectors to Different Profiles
Collectors assigned to a profile can readily be re-assigned to another one in order to meet your reporting requirements. For example, as a result of changes in network traffic patterns or security requirements. To re-assign a Collector, do the following:
-
Select the profile to which the Collector is currently assigned. A window similar to the one shown in Figure 13-3 appears.
-
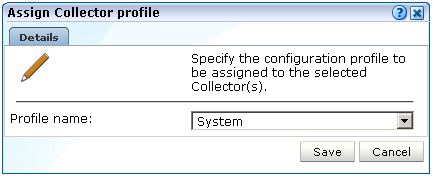
Select the Assign profile option from the Collector's context menu. The dialog shown in Figure 13-4 appears.
-
Select the new profile to which the Collector should be assigned. When ready, click Save.
-
After the Collector is assigned to the selected profile, the status message should in Figure 13-5 appears.
Figure 13-5 Moved Collector Status Message
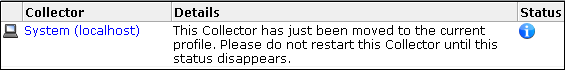
Description of ''Figure 13-5 Moved Collector Status Message''
This status message can remain for up to 60 seconds. After that, the Collector is either restarted automatically, or a required manual restart is indicated. See Section 13.1.6, "Restarting Collectors" for more information.
Important:
Be aware that if the new profile's segmentation scheme is different from that of the previous profile, the Collector's segmentation scheme is adjusted to be consistent with that of its new profile. Therefore, it is strongly recommended that you review its traffic filter settings after assigning it to a new profile. See Section 13.4.3, "Limiting Overall Traffic" for more information.If you want to assign a number of Collectors to a different profile, you can use the Multiple selection option within the Configuration menu. After clicking the required Collectors, click the Assign profile command button on the toolbar.
13.1.4 Assigning Collectors to Interfaces
Collectors can be network or tag based and be associated with different interfaces. To assign a collector to an interface:
-
Select Configuration, then Security, and then Collector profiles. The currently defined Collector profiles are displayed. An example is shown in Figure 13-1.
-
Navigate to the collector you want to modify. A window similar to the one shown in Figure 13-3 appears. Right click on the collector you want to modify.
-
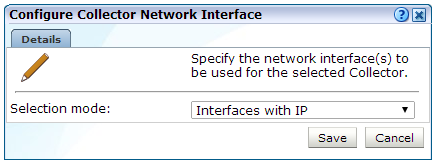
Select the Assign network interface option from the Collector's context menu. The dialog shown in Figure 13-4 appears.
-
For tag based collection, Interfaces with IP should be assigned. For network based collection, Interfaces without IP should be assigned. Alternatively, select Specified Interfaces to display all interfaces and make individual selections. When ready, click Save.
13.1.5 Attaching New Collectors
To attach a new Collector to the system, do the following:
-
Select Configuration, then Security, and then Collector profiles. The currently defined Collector profiles are listed. An example is shown in Figure 13-1.
-
Select the profile to which the new remote Collector should be attached. Alternatively, select Configure from its context menu. The Collectors currently assigned to the selected profile are listed. An example is shown in Figure 13-3.
-
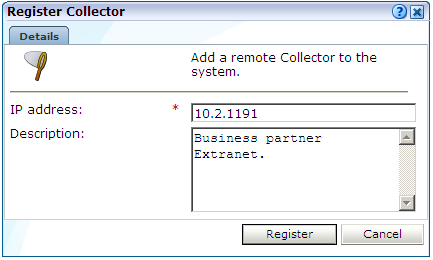
Select the Register remote Collector option from the Configuration menu. The dialog shown in Figure 13-7 appears.
-
Specify the IP address of the new Collector system and, optionally, a brief description. It is recommended that this include an indication of its scope and purpose. When ready, click Register. See the Oracle Real User Experience Insight Installation Guide for information about the configuration requirements for Collector systems.
13.1.6 Restarting Collectors
After making certain configuration changes to a Collector profile, all Collectors assigned to that profile must be restarted in order for the changes to take effect. This restart can either be performed automatically (the default), or be performed manually. To configure the Collector restart method, do the following:
-
Click the required profile from the list of available Collector profiles (Figure 13-1), or select Configure from its context menu. A window opens showing the Collectors currently assigned to the selected profile. An example is shown in Figure 13-3.
-
From the Configuration menu, select Configure, and then Collector restart method. The dialog shown in Figure 13-8 appears.
Figure 13-8 Edit Collector Restart Method
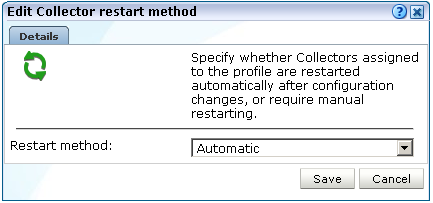
Description of ''Figure 13-8 Edit Collector Restart Method''
-
Use the Restart method menu to specify whether the Collectors assigned to the selected profile are restarted automatically after configuration changes to the profile (the default), or whether a manual restart is required. When ready, click Save.
Manually Restarting Collectors
You should not restart a Collector until a required restart is indicated in the Configure network data Collectors window. An example is shown in Figure 13-9.
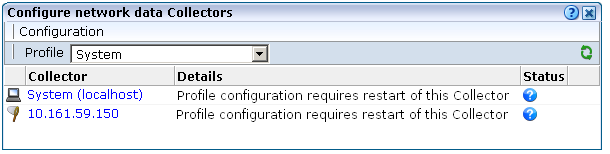
To restart an individual Collector, select Restart from its context menu. Note that when a Collector profile contains a large number of Collectors, it may be more convenient to use the Restart all Collectors option within the Configuration menu.
13.1.7 Disabling and Unregistering Collectors
It may be necessary to stop the Collector instance when performing maintenance or troubleshooting on a remote Collector system. In this case, you can select Disable from the Collector's context menu to stop the Collector's monitoring of traffic. When ready, the Collector can be instructed to resume monitoring by selecting the Restart option.
When a remote Collector system is decommissioned, it is necessary to remove it from the RUEI installation. To do so, select the Unregister option from the Collector's context menu. Upon confirmation, the Reporter's connection to the Collector system is abandoned. Note that the local Collector instance cannot be unregistered.
The local Collector instance on the Reporter system is represented by the System (localhost) item. Note that after installation, it is not yet enabled, and appears in each currently defined Collector profile. After being enabled within a specific profile, it only appears in the selected Collector profile. It is not possible to unregister the local Collector instance.
13.2 Managing Processing Engines
In order to extend processing beyond the capacity of a single system, one or more Processing Engines can be configured to undertake the data processing role normally performed by the Reporter.
To add a Processing Engine to your RUEI deployment, do the following:
-
Ensure that the installation and configuration procedures for Processing Engines have been performed on the target system. This is fully described in Oracle Real User Experience Insight Installation Guide.
-
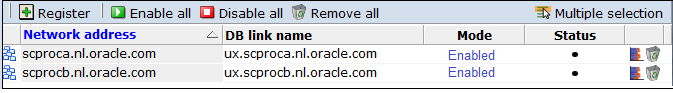
Select Configuration, then Security, and then Processing Engines. The currently registered Processing Engines are listed. An example is shown in Figure 13-10.
-
Click Register. The dialog shown in Figure 13-11 appears.
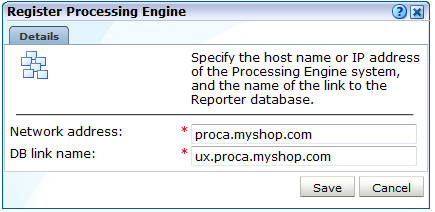
Figure 13-11 Register Processing Engine Dialog
Description of ''Figure 13-11 Register Processing Engine Dialog''
-
Specify the host name or IP address of the Processing Engine system, and the database link name. When ready, click Save. Note that the database link name must include the host name, and conform to Oracle naming conventions. For example, it cannot contain spaces, or start with a number or underscore. For further information, see the Oracle Database Administrator's Guide, available at the following location:
http://download.oracle.com/docs/cd/E11882_01/server.112/e17120/ds_admin.htm#ADMIN029
-
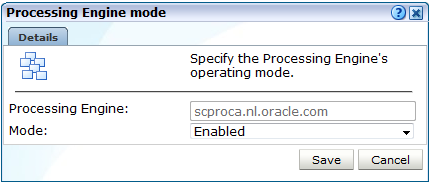
The newly registered Processing Engine appears in the list shown in Figure 13-10 with the mode "None". This indicates that it has yet to be initialized for use by the Reporter. Click the Processing Engine's Mode setting. The dialog shown in Figure 13-12 appears.
-
Select "Enabled" from the Mode menu. When ready, click Save. After a brief period, you are returned to the window shown in Figure 13-10.
Processing Engines can be temporarily disabled in order to perform system maintenance (such as the installation of patches). When disabling a Processing Engine, be aware of the following:
-
If a Processing Engine is disabled for a longer period of time, data for a brief period may be lost.
-
The processing normally performed by the disabled Processing Engine is automatically redistributed among the remaining enabled Processing Engines. If all Processing Engines are disabled, processing is transferred back to the Reporter system.
If you remove a Processing Engine, all information about it (such as its database link) is purged from your RUEI deployment. However, the information within the Processing Engine database is preserved. Therefore, if you re-register a previously removed Processing Engine system, the data within its database will still be available to the Reporter.
13.3 Managing the Scope of Network Based Monitoring
Within RUEI, you control the scope of traffic monitoring by specifying which TCP ports it should monitor for network data based collection. No information is available for unmonitored ports. It is recommended that you carefully review your selections of monitored and unmonitored TCP ports (both HTTP and HTTPS).
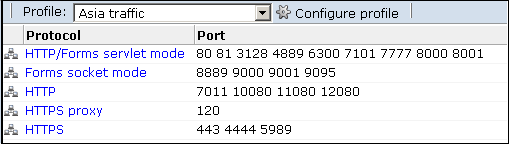
The currently monitored ports can be viewed by selecting Configuration, then Security, and then Protocols. An example is shown in Figure 13-13.
To modify these settings, do the following:
-
Use the Profile menu to select the required Collector profile.
-
Click the protocol whose port settings you want to modify. Table 13-3 shows the available settings.
Protocol Description HTTP/Forms servlet mode
Specifies the ports on which the profile's Collectors should listen for Forms servlet traffic. This option is only applicable to EBS-based traffic (see Appendix N, "Oracle Forms and Oracle E-Business Suite Support").
Forms socket mode
Specifies the ports on which the Profile's Collectors should listen for Forms traffic in socket mode. This option is only applicable to EBS-based traffic (see Appendix N, "Oracle Forms and Oracle E-Business Suite Support").
HTTP
Specifies the ports on which the profile's Collectors should listen for HTTP traffic. This setting should only be used for "pure" HTTP traffic.
HTTPS proxy
Specifies the proxy server port numbers to which SSL traffic is sent. Note that:
-
If only non-SSL traffic is routed over a proxy port, the port number should not be specified via this setting. Otherwise, it can have a significant impact on Collector performance.
-
The port number of the server receiving the SSL traffic (behind the proxy) must be specified via the HTTPS setting.
HTTPS
Specifies the ports on which the profile's Collectors should listen for HTTPS traffic. Upon installation, the HTTPS port 443 is defined as the default monitored port.
A dialog similar to the one shown in Figure 13-14 appears.
Figure 13-14 Edit Collector Ports Dialog
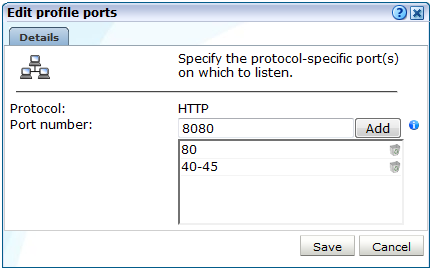
Description of ''Figure 13-14 Edit Collector Ports Dialog''
-
-
To add a new port number, or a range of ports (such as 80-85), enter the required number(s) in the Port number field, and click Add. To remove an item from the list, click the Remove icon to the right of it. When ready, click Save.
Important:
The port numbers specified within each protocol must be mutually exclusive within Collector profiles. That is, a port number should only appear in one protocol's list of assigned port numbers. -
When a required restart is indicated, restart the Collectors assigned to the profile. This is described in Section 13.1.6, "Restarting Collectors".
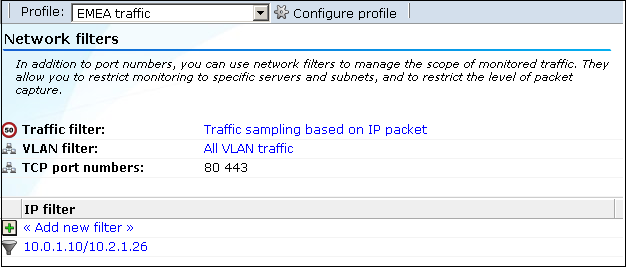
13.4 Defining Network Filters
In addition to port numbers, you can use network filters to manage the scope of monitored traffic. They allow you to restrict monitoring to specific servers and subnets, and to restrict the level of packet capture.
To define or modify network filters, do the following:
-
Select Configuration, then Security, and then Network filters.
-
Use the Profile menu to select the required Collector profile. The currently defined network filters are displayed. An example is shown in Figure 13-15.
-
Use the filters described in the following sections to manage the scope of the monitored traffic.
-
When a required restart is indicated, restart the Collectors assigned to the profile. This is described in Section 13.1.6, "Restarting Collectors".
Understanding the Application of Network Filters
Network traffic is monitored based on inclusive handling of defined filters. For example, all defined port numbers are monitored for traffic. Similarly, all defined network filters (such as server IP address ranges) are monitored. There is one exception to this rule, and that is the use of VLAN filters. When enabled, only VLAN traffic with the specified VLAN ID is monitored. If enabled, but no VLAN ID is specified, all VLAN traffic is monitored.
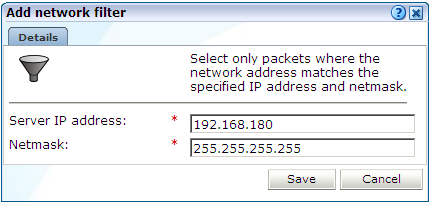
13.4.1 Defining Server IP Address Filters
You can define filters to restrict the scope of monitoring to specific servers and subnets. Note that this facility is only available if at least one Collector has been assigned to the Collector profile. Do the following:
-
Click Add new filter to define a new filter, or click an existing filter to modify it. The dialog shown in Figure 13-16 appears.
-
Use the Server IP address and Netmask fields to specify the address to which the Collector should listen. It is recommended that this is done in consultation with your network specialist. When ready, click Save.
13.4.2 Defining VLAN Filters
VLAN filters offer a means by which to limit monitored traffic to specific servers and subnets. To define VLAN filters, do the following:
-
Click the current setting for VLAN filter shown in Figure 13-15. The dialog shown in Figure 13-17 appears.
Figure 13-17 Configure VLAN Filter Dialog
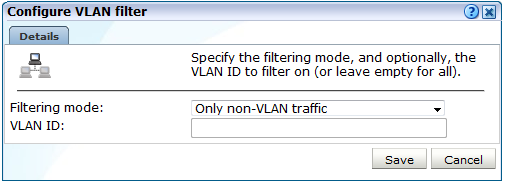
Description of ''Figure 13-17 Configure VLAN Filter Dialog''
-
Use the Filter mode menu to specify whether VLAN filtering should be enabled. By default, no VLAN traffic is monitored. Note that enabling this filter means that only VLAN traffic will be monitored.
-
Optionally, use the VLAN ID field to specify a specific VLAN on which to filter. When ready, click Save.
13.4.3 Limiting Overall Traffic
In addition to the use of network and VLAN filters, it is also possible to specify how much of the overall traffic that remains after the application of other filters is actually monitored. By default, all remaining traffic is monitored.
To specify the level of overall traffic monitoring, do the following:
-
Click the current setting for Traffic filter shown in Figure 13-15. The dialog shown in Figure 13-18 appears.
Figure 13-18 Limit Overall Traffic Dialog
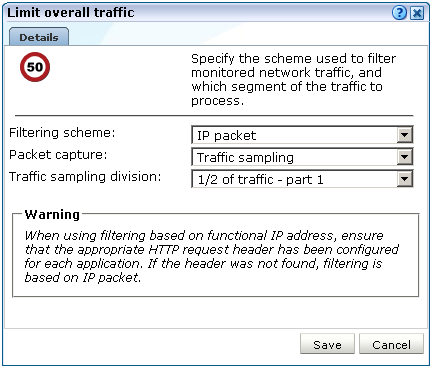
Description of ''Figure 13-18 Limit Overall Traffic Dialog''
-
Use the Filtering scheme menu to specify whether filtering of network traffic should be based on physical or functional IP addresses. The following filtering schemes are available:
-
IP Packet
-
Functional IP address
-
Client port
By default, filtering of network traffic is based on the physical IP address. That is, the IP address fetched from the IP packet. However, if a Collector is installed behind a CDN or proxy server, you may prefer that filtering is based on functional IP addresses or client port. Note that SSL traffic is always sent to the first collector in a client-port scheme. This means SSL traffic is not segmented per client-port mode.
If you choose to use a functional IP address, you should be aware of the following:
-
If the functional IP address is not available, then the IP address obtained from the IP packet is used instead.
-
The use of a configured client IP header for network filtering places a considerable processing overhead on the Collector, especially when SSL encryption is being used in the monitored traffic. This is because filtering upon physical addresses can be performed at the TCP level, while filtering upon functional IP addresses normally has to be performed at HTTP level.
-
-
Use the Packet capture menu to specify which part of the traffic should the profile's Collectors monitor. Table 13-4 shows the available options.
Table 13-4 Packet Capture Schemes
Option Description All traffic
Specifies that all traffic that remains after the application of other filters should be monitored. This is the default.
Specified domains
Specifies that monitoring should be restricted to those domains that are explicitly specified in your application, suite, and service definitions.
Traffic sampling
Specifies that only a portion of the traffic should be monitored, and which part of it. For example, the option "1/4 of traffic, part 4" specifies that each Collector within the selected profile should only monitor the last quarter of the network traffic.
Load balancing
Specifies that monitoring of the packet stream should be spread across the Collectors within the Collector profile, with each Collector receiving a separate portion. 2-16 Collectors are supported for this configuration. The assignment of Collectors can be:
-
Automatic: each Collector is assigned its portion of traffic to monitor based on its position within the profile definition. For example, the eighth assigned Collector would monitor the last eighth of the traffic.
-
Manual: you can specify which portion and part of the traffic individual Collectors should monitor.
This option is only available if at least one Collector has been assigned to the Collector profile.
When ready, click Save.
-
-
When a required restart is indicated, restart the Collectors assigned to the profile. This is described in Section 13.1.6, "Restarting Collectors".
The setting described above specifies how much of the total network traffic is measured. Therefore, if you specify that half of all traffic should be monitored, only the monitored half is reported. When using a setting of less than 100%, you should bear in mind that the reported information does not reflect all actual traffic, but the selected sample.
Traffic monitoring is based on IP addresses. This means that, regardless of what setting you use, complete user sessions are recorded. However, the number of those sessions depends on your selected setting.
13.4.4 Verifying Your Load Balancing and Traffic Sampling Definitions
It is important to understand that load balancing and traffic sampling definitions can lead to incorrect monitoring of your network traffic. For example, it is possible to select the Load balancing division "All traffic divided by 16", while there are not 16 Collectors assigned to the selected profile. Similarly, you could select the Traffic sampling division "1/8 of traffic - part 1", have eight Collectors assigned to the selected profile, and each of them monitoring the same part of your network traffic. Therefore, you should ensure that:
-
Traffic sampling is only specified when your RUEI deployment incorporates Collectors attached to different monitoring points within your network infrastructure.
-
When using load balancing, the selected option must match the number of Collectors assigned to the profile.
Important:
It is strongly recommended that your network filter definitions are reviewed by someone with a thorough knowledge of your network infrastructure.Adding and Removing Collectors from Profiles
Be aware that network filter definitions are not automatically updated when Collectors are added to, or removed from, profiles, and no warnings are generated when such changes result in network traffic being missed or processed multiple times. Therefore, you should carefully review your network filter definitions after making any changes to Collector profile settings.
13.5 Managing SSL Keys
RUEI can be configured to monitor encrypted data (such as HTTPS and SSL). In order to do this, a copy of the web server's private SSL keys needs to be imported into RUEI. To import certificates to monitor encrypted content, do the following:
-
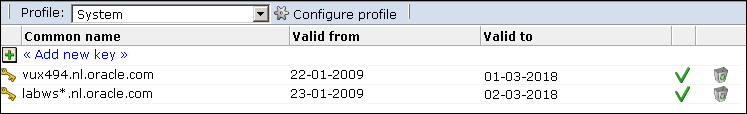
Select Configuration, then Security, then SSL keys, and then SSL keys management. Use the Profile menu to select the required Collector profile. A list of the currently installed keys is displayed. An example is shown in Figure 13-19.
-
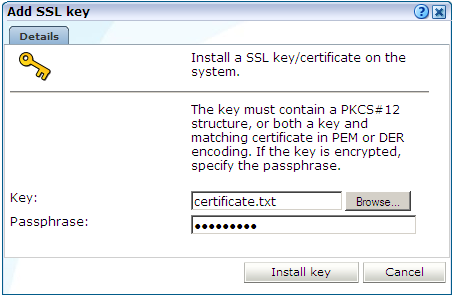
Click Add new key to define a new key. Note that existing SSL key definitions cannot be modified. The dialog shown in Figure 13-20 appears.
-
Use the Key field to specify the file containing the key. If the key is encrypted, you must specify the passphase. When ready, click Install key.
Note:
The supplied file can be in PEM, DER, or PKCS12 format, and must include the key and matching certificate. The key must be an RSA key. Note that encryption protocols that use 40-bit keys (such as DES_40, RS2_4-0, and RC4_40) and AEAD ciphers are not supported. Camellia is only supported for Oracle Linux 6.5 and later.
Supported Encryption Protocols and Mechanisms
Within Message Authentication Codes (MACs), the MD5, SHA-1, and SHA-2 functions are supported. The SSL v3, TLS v1.0, TLS v1.1 and TLS v1.2 cryptographic protocols are supported. A complete list of the currently supported encryption algorithms is available within the SSL connections section of the Collector statistics window (see Section 15.2, "Viewing the Status of the Collectors").
Be aware that both SSL and Oracle Forms traffic are particularly sensitive to disruptions in the TCP packet stream. This is because they require state information to be maintained for the duration of the connection, and any lost packets can cause that information to be lost, preventing RUEI from accurately monitoring and reporting the connection.
Therefore, you should ensure that each Collector is connected to a reliable network device, such as a TAP. In addition, it is strongly recommended that you regular review the information available through the Collector Statistics window (described in Section 15.2, "Viewing the Status of the Collectors") to verify the integrity of the TCP packet stream. Particular attention should be paid to the reported TCP and SSL connection errors.
Private Key Extraction Failures
Be aware that if the loading of a private key fails, this can be due to a number of possible reasons, including an incorrect password or the file containing the certificate and private key is corrupted.
The upload can also fail if the file contains multiple certificates, such as additional Certificate Authority (CA) certificates. To fix this, manually edit the file and remove the extra certificates. If the file is a PKCS12 container, use the following command to convert it to a PEM file that contains only the client and server certificates:
openssl pkcs12 -in PKCS12-FILE -out <PEM-File> -nodes -clcerts
where PKCS12-FILE is the name of the PKCS12 container file.
13.5.1 Removing SSL Keys
To remove an installed SSL key, right click the required key, and select Remove. You are prompted to confirm the key's removal.
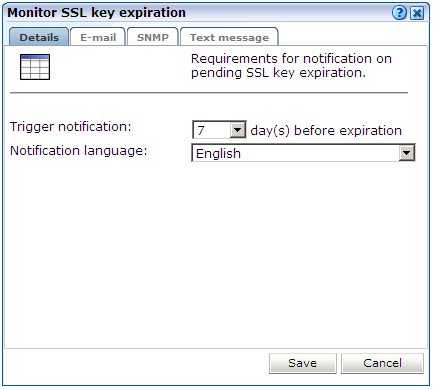
13.5.2 Monitoring Key Expiration
Optionally, you can configure notifications about pending SSL key expirations. This allows you to plan the importation of new keys, and ensures that there are no gaps in the monitored data while new keys are obtained and activated. Do the following:
-
Click the Monitor key expiration icon on the taskbar. If it is not already visible, select Configuration, then Security, then SSL keys, and then SSL keys management. The dialog shown in Figure 13-21 appears.
-
Specify the number of days prior to expiration when notification should be generated. Use the controls on the other tabs to specify the e-mailing, SNMP, and text message notification details. These are similar to the dialogs explained in Section 8.5.1, "Defining Alert Profiles". When ready, click Save.
-
When a required restart is indicated, restart the Collectors assigned to the profile. This is described in Section 13.1.6, "Restarting Collectors".
Note:
The check for expired SSL keys is scheduled to be run once a day at 6 am (Reporter system time).13.6 Masking User Information
The RUEI installation can be configured to omit the logging of sensitive information. This is called masking, and it allows you to prevent passwords, credit card details, and other sensitive information from being recorded on disk.
RUEI's security facilities allow you to control the logging of POST URL arguments, HTTP headers, cookies and their values, Oracle Forms elements, and the contents of URLs.
To implement a masking, do the following:
-
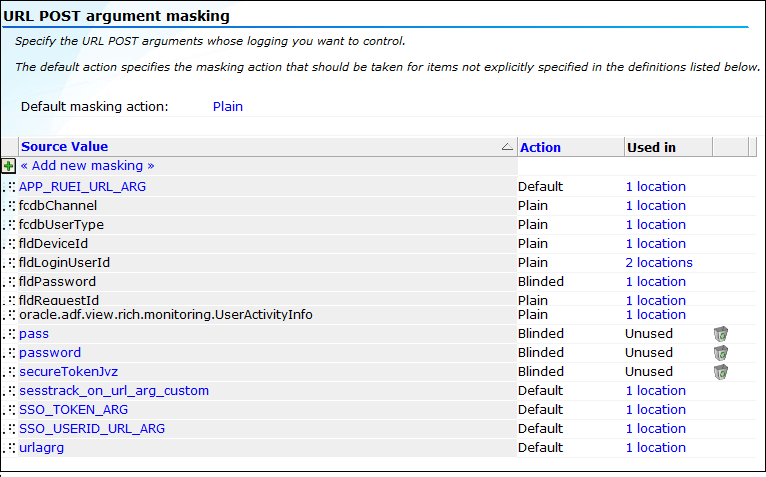
Select Configuration, then Security, then Masking, and then select the appropriate option for the HTTP protocol item you want to configure. For example, URL POST argument masking. A window similar to the one shown in Figure 13-22 appears.
Figure 13-22 URL POST Argument Masking Window
Description of ''Figure 13-22 URL POST Argument Masking Window''
The currently defined maskings for the selected HTTP protocol item are listed.
-
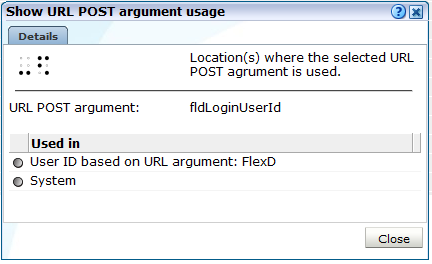
Click an existing item's "Used in" listing to view information about its usage. An example is shown in Figure 13-23.
Figure 13-23 Example HTTP Item Usage Dialog
Description of ''Figure 13-23 Example HTTP Item Usage Dialog''
In this case, it indicates that the selected URL POST argument is used as part of an application's user ID scheme, and is also used as part of RUEI's internal traffic detection. These automatically detected items are explained in a later section.
-
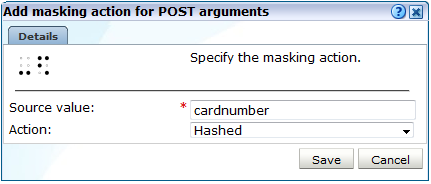
Click Add new masking to define a new masking. A dialog similar to the one shown in Figure 13-24 appears.
Figure 13-24 Add Masking Action for POST Arguments Dialog
Description of ''Figure 13-24 Add Masking Action for POST Arguments Dialog''
-
Specify the name of the item whose logging you want to control. Depending on the selected protocol item, this will either be the name of a POST URL argument, a cookie name or value, an Oracle Forms element, an item within a HTTP header, or a URL prefix.
-
Select the masking action to be assigned to the defined item. Table 13-5 explains the available options for protocol items other than URL prefixes.
Option Description Default
Specifies that the defined default action for the selected HTTP protocol item should be performed for this item. The use of this facility is described in the following section.
Hashed
Specifies that the item's contents should be replaced with a calculated hash value when logged. This mechanism provides a unique value for comparison purposes, but is not in human-readable form. For example, five different user IDs would receive five different hashes when logged, while multiple sessions by the same visitor would receive the same hash. This manufactured (hashed) value provides uniqueness, but not the real value itself.
Blinded
Specifies that the item's original contents should be overwritten with Xs when logged.
Plain
Specifies that the item should be logged in its original state. That is, unprotected.
Truncated
Specifies that only the first 1 KB characters of the HTTP protocol item are logged. Values longer than this have their reminder truncated and hashed, and appended to the first 1 KB of plain (unhashed) data. In this way, their uniqueness is preserved.
When ready, click Save. Any changes you specify take effect within 5 minutes.
In addition to URL POST arguments, Forms elements, cookies, and HTTP headers, it is also possible to protect certain URL contents by specifying a prefix. This facility is useful when you want to prevent the storage of URL structures that might contain sensitive information.
The options specify whether the URL components are preserved in the Collector log files (from which information within the Data Browser groups and Session Diagnostics feature is derived). Table 13-6 shows the available masking actions.
Table 13-6 URL Prefix Masking Actions
| Masking Action | Description |
|---|---|
|
Logging |
Specifies that the URL component should be preserved in Collector log files (after all other defined maskings have been applied). This is the default. |
|
No logging |
Specifies that nothing is preserved in the Collector log files. |
Note that if a URL prefix's masking action is set to "No logging", this also becomes its replay action. As explained in Section 13.10, "Controlling Replay Policies", this cannot be modified without first changing its masking action.
Important:
If the URL prefix default masking action is set to "No logging", then no data is written to Collector log files, and none is available for reporting. Therefore, you should only select this option if you have first defined a whitelist of URL components that will be logged.Specifying the Default Masking Action
As mentioned earlier, the default setting specifies the action that should be taken for HTTP protocol items not explicitly specified in your security definitions. By defining items with the "Default" action, you can modify the security settings for a large number of data items (both listed and unlisted) with one user action.
To specify the default action, do the following:
-
Select the HTTP protocol item whose default action you want to specify. For example, HTTP header masking.
-
Click the current setting for the Default masking action menu. This is located at the top of the masking window. A dialog similar to the one shown in Figure 13-20 appears.
Figure 13-25 Edit Default Masking Setting Dialog
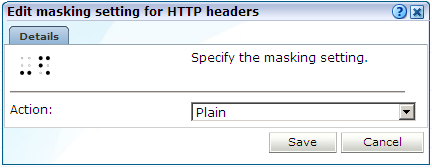
Description of ''Figure 13-25 Edit Default Masking Setting Dialog''
-
Select the required security setting to be applied to all data item's with the action "Default". When ready, click Save. Any changes you make to this setting take effect within 5 minutes.
In addition to the HTTP protocol item maskings you explicitly define, items are also automatically detected by RUEI during configuration. For example, the URL POST argument pagelabel is used to track WebLogic Portal applications, while the HTTP header Accept-Language is used to determine the end-user's language preferences. These items are indicated in the Used in column as "System". Generally, they receive the masking action "Plain", which means their associated items are recorded in their original state. Their actions cannot be modified because they are required for the correct monitoring of network traffic.
Note that if session tracking is based on some standard technology (such as Apache or ColdFusion), the cookie is not reported in the "Used in" section. Instead, these cookies have the default masking action assigned to them, unless they have been defined manually, and have been configured differently from their default values. This does not represent a problem if the default masking action has not been set to blinded. If it has, all visitor sessions would be booked on one session.
Masking the Authorization Field
As explained in Section 7.3.14, "Defining User Identification", user identification is first based on the HTTP Authorization field. Be aware that, if this is sent over the network in plain format, this represents a security issue because the user name and password can potentially be decoded from it. This is a limitation of the basic authentication protocol.
If Authorization fields are sent over the network in plain format, you can use the masking options described in the previous section to control whether they are preserved in the Replay viewer. Alternatively, you can ensure that Authorization fields are hashed when included in network traffic. In this case, the user IDs are unavailable in Session Diagnostics.
Note that the cookie value -1 is automatically assigned the masking action "Plain" (that is, it is preserved in its original state). This is necessary because this value is often used within Oracle E-Business Suite to indicate an end of session.
When using the masking facility, you should pay particular attention to the following points:
-
The masking actions you define are applied to all monitored domains.
-
All masked HTTP protocol items (except URL prefixes) are case insensitive.
-
While multiple (overlapping) item definitions are possible, the longest matching specification will be used as the assigned masking action.
-
After deleting a defined masking item (for example, a custom dimension item described in Section 3.12, "Working With Custom Dimensions"), if you have not modified its masking action, it is automatically removed from the displayed items list. However, if you have previously modified its defined action, you will need to explicitly remove it from the items list.
-
See Appendix G, "Working with National Language Support" for a detailed discussion of the operation of data masking when working with international character sets.
-
As explained in Appendix S, "Enriched Data Export Facility", data collected by RUEI can be exported to enable its combination with other data warehouse data. Because any data items masked within RUEI are also masked when exported, it is recommended that you carefully review the requirements for data items used by external applications. The settings windows available within the masking facility provide an ideal audit tool to verify your security requirements.
-
Be aware that when changing a data item's security, any data already stored in log files is unaffected by the change. If necessary, you should consider purging the system (this is fully described in Section 15.12, "Resetting the System").
-
It is strongly recommended that you regularly verify that all sensitive data is masked correctly on a regular basis. Applications often change over time, and so do their use of POST variables, cookies, headers, and URL structures. The Collector and Reporter raw log files can be found in the directories
/var/opt/ruei/processor/data. The Session diagnostics export facility can also be used to audit the content of these files. This is described in Section 4.4, "Exporting Full Session Information".
13.7 Masking FSR Page Content
The masking facility described in Section 13.6, "Masking User Information" allows you to define masking policies for arguments within headers, URLs, cookies, and Oracle Forms elements. However, you can also define masking policies for the actual content of application pages shown within the Full-Session Replay (FSR) facility. This is particularly useful for restricting access to sensitive information (such as passwords and credit card information) within actual web server content.
To define page content masking policies, do the following:
-
Select Configuration, then Applications, then Applications or Suites, and select the required application. The application overview appears.
-
Click the Advanced tab, and then the Replay masking tab. The currently defined masking policies are displayed. Click Edit. The dialog shown in Figure 13-26 appears.
Figure 13-26 Edit Replay Masking Actions Dialog
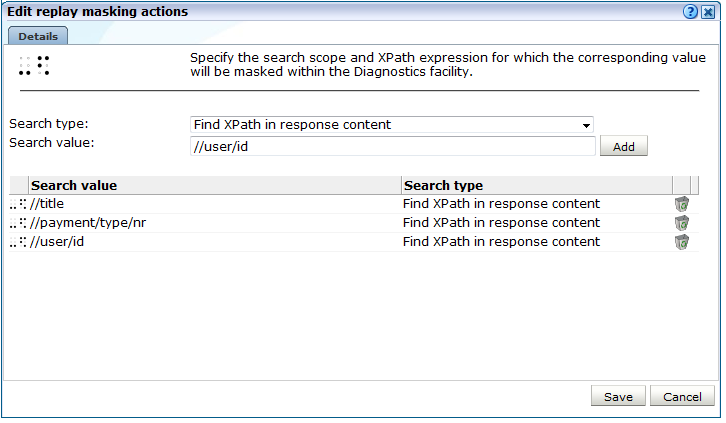
Description of ''Figure 13-26 Edit Replay Masking Actions Dialog''
-
Use the Search type menu to specify the scope of the search. This can be either the request or response content. Use the Search value field to specify the XPath expression that should be used to locate the required page content. More information about the use of XPath queries is available in Appendix F, "Working with XPath Queries". For each required search, click Add. When ready, click Save.
Any changes you make take effect within 5 minutes.
Designing Your XPath Search Expressions
The precise XPath search expressions to locate the required page content depends on the structure of your application pages. Consider the following request and response fragments:
POST /cgi-bin/post HTTP/1.1
Accept: */*
Connection: keep-alive
Content-Length: 97
Content-Type: text/xml
Host: myshop.com
Pragma: no-cache<user><CardName>AMEX</CardName><CardExp>150606</CardExp><CardNo>12345-12345-12345</CardNo></user>

HTTP/1.1 200 OK
Date: Fri, 03 Aug 2012 08:29:01 GMT
Server: Apache/2.2.3 (Oracle)
Connection: close
RUEI-Transfer-Encoding: chunked
Content-Type: text/xml
<?xml version="1.0"?>
<info>
   <request>
      <action>do_refund</action>
      <meta>
         <merchantid>8500</merchantid>
         <ipaddress>10.69.10.214</ipaddress>
         <version>1</version>
      </meta>
      <params>
         <payment>
            <orderid>2012050901</orderid>
            <countrycode>nl</countrycode>
            <paymentproductid>1</paymentproductid>
            <amount>100</amount>
            <currencycode>eur</currencycode>
            <creditcardnumber>12345-12345-12345</creditcardnumber>
            <expirydate>150606</expirydate>
         </payment>
      </params>
   </request>
</info>
The user's credit card number appears in both the request and the response. Therefore, in order to completely mask it within session diagnostics, you would need to define two masking actions:
-
Search type: Find XPath in request content
Search value://CardNo -
Search type: Find Xpath in Response content
Search value://creditcardnumber
Additional actions would also need to be defined to mask the credit card's related information (such as its expiry date).
Be aware that the masking policies defined within this facility only apply to how application pages are displayed within the FSR facility, and not to their storage within the RUEI installation.
13.8 Masking SSL Client Certificates
By default, all SSL client certificate properties (when available) are recorded as part of the log files generated by each Collector system. If this does not meet your organization's security policies, do the following:
-
Select Configuration, then Security, and then SSL certificate masking. The panel shown in Figure 13-27 appears.
Figure 13-27 Collector SSL Client Certificate Masking Policy
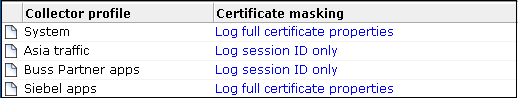
Description of ''Figure 13-27 Collector SSL Client Certificate Masking Policy''
-
Click the required Collector profile's certificate masking action. The dialog shown in Figure 13-28 appears.
Figure 13-28 Edit Collector SSL Certificate Masking Dialog
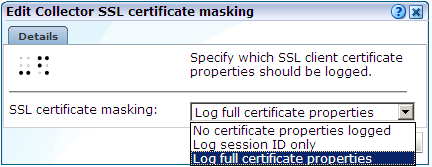
Description of ''Figure 13-28 Edit Collector SSL Certificate Masking Dialog''
The options shown in Table 13-7 are available.
Table 13-7 SSL Certificate Masking Actions
Option Description Log full certificate properties
Specifies that the complete SSL certificate should be logged. This is the default.
Log session ID only
Specifies that only session ID information should be recorded.
No certificate properties logged
Specifies that no proportion of the SSL certificate should be logged.
Select the required masking action. When ready, click Save.
-
When a required restart is indicated, restart the Collectors assigned to the profile. This is described in Section 13.1.6, "Restarting Collectors".
13.9 Defining Collector Data Retention Policies
The following procedure allows you to both to configure data retention and to monitor current disk usage on an application or collector basis. Collector data retention can be configured using the following criteria:
-
size based - data is discarded after a size quota (X GB) is met
-
time based - data is discarded after a defined period (N days)
The storage will not contain more then N days data, and will not occupy more then X GB of disk space. This procedure describes how to configure the size based data retention policy. Time based data retention is related to the reporter retention policy and is described in Section 12.10.1, "Defining Reporter Retention Policies."
Note that the time based collector/reporter data retention policy cannot be specified per application/suite, as is possible for size based collector retention policies.
To specify the size based data retention policy used by the Collectors attached to a Reporter, do the following:
-
Select Configuration, then Security, and then Collector data retention policy. The panel shown in Figure 13-29 appears.
Figure 13-29 Collector Data Retention Policy
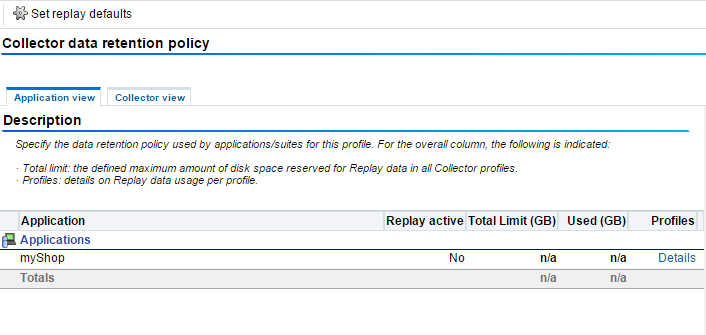
Description of ''Figure 13-29 Collector Data Retention Policy''
-
Within the Application view tab, for each defined application, suite, or services and across each Collector profile, the following information is shown:
-
Limit (GB): indicates the maximum amount of disk space currently reserved for storing Error Page Replay (EPR) and Full Session Replay (FSR) data.
-
Used (GB): indicates the amount of disk space currently used by each Collector within a profile for its replay data.
-
-
For each application, suite, and service, click Details in the Profiles column to view more information.
-
On the details screen, click Yes or No beside the Replay active label to specify whether the creation of replay data should be enabled. By default, replay data is enabled.
-
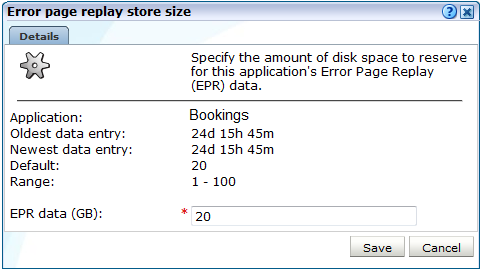
When replay is enabled, click either the Error page replay store (ERS) or Full session replay storage (FRS) value on the details screen for the Collector profile monitoring the application you want to modify. A dialog similar to the one shown in Figure 13-30 appears.
Figure 13-30 Error Page Replay Store Size Dialog
Description of ''Figure 13-30 Error Page Replay Store Size Dialog''
Specify the maximum amount of disk space that should be reserved for FSR or EPR data for all Collectors within the selected profile for the application, suite, or service.
-
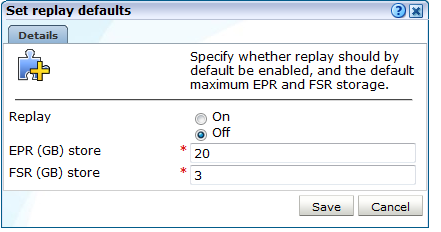
Alternatively, instead of specifying the FSR and EPR data store sizes for individual applications and suites across specific Collector profiles, you can click the Set replay defaults command button shown in Figure 13-29. A dialog similar to the one shown in Figure 13-31 appears.
Specify whether replay storage is enabled by default, and the maximum amount of disk space reserved for FSR and EPR data on each Collector system.
-
After making a change to these settings, it is recommended that you review the last update to each appropriate Collector profile via the Network data Collectors status (described in Section 15.2, "Viewing the Status of the Collectors") to ensure that it has been applied. If necessary, restart all required Collectors as described in Section 13.1.6, "Restarting Collectors".
Be aware of the following:
-
The Replay feature is available if you using a network data collector. If you are only using a tag data collector, this feature is not available.
-
If you want replay data to be available for an application, suite, or service, in addition to enabling replay storage on its associated Collector profiles, you must also ensure its Replay logging policy is set appropriately. This is described in Section 13.10, "Controlling Replay Policies".
-
When you reduce the replay disk space available to an application to an amount lower than that currently being used, the oldest data in store is removed to resize the replay data store. For example, imagine that you specify that an application's FSR data store should be reduced from 20 GB to 10 GB, and 14 GB is currently being used. In this case, the oldest 4 GB of the current FSR data is removed to resize the store.
-
Data retention is limited by a time and space quota as described at the start of this section.
-
If the FSR time span is less than 15 minutes, the error replay facility may not function correctly. In addition, if set to zero, the EPR size setting can no longer be modified.
-
You can click the Collector view tab to view the amount of available and used replay data storage, its time span, and its most recent update for each Collector attached to the Reporter system. It is recommended that you review this regularly to ensure that it meets your reporting requirements.
Note that when an application or suite is deleted, its associated FSR and EPR data is not automatically removed from its Collector systems. Instead, it remains available for viewing. If you want to delete this data, you should click the Remove icon shown in the Replay active column. You are prompted to confirm the data's deletion.
13.10 Controlling Replay Policies
It is possible to control the information written to the Replay Viewer files used by RUEI. You can specify the replay action that should be applied to all monitored traffic, or to only specific IP address ranges. In addition, you can control how certain URL contents are logged by specifying prefixes. To specify the replay policies used within your RUEI deployment, do the following:
-
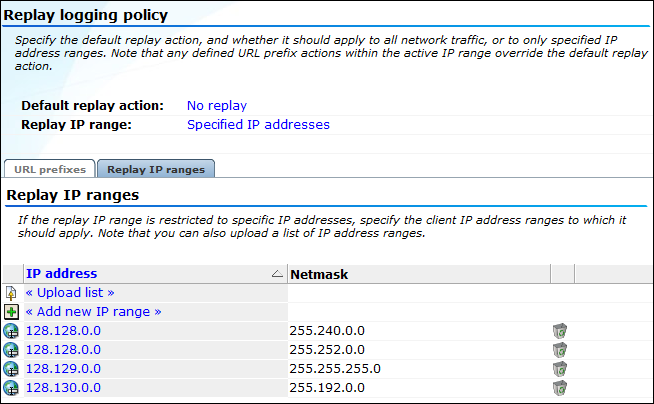
Select Configuration, then Security, and then Replay logging policy. The window shown in Figure 13-32 appears.
Figure 13-32 Replay Logging Policy Window
Description of ''Figure 13-32 Replay Logging Policy Window''
-
Click the default replay action setting. The dialog shown in Figure 13-33 appears.
Figure 13-33 Edit Default Replay Action Dialog
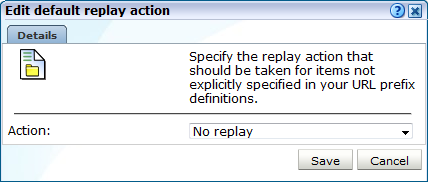
Description of ''Figure 13-33 Edit Default Replay Action Dialog''
-
Use the Action menu to specify which parts of the monitored traffic, in terms of request and response headers and bodies, are logged in the Replay viewer facility and the Collector log files. The available options are explained in Table 13-8.
Table 13-8 Default Logging Actions
Masking Action Description No replay
Specifies that all parts (after any defined maskings have been applied) are preserved in the Collector log files, but nothing is preserved in the Replay viewer. This is the default.
Complete logging
Specifies that all parts should be preserved in both the Replay viewer and Collector log files (after any defined maskings have been applied).
No request body
Specifies that all parts (after any defined maskings have been applied) are preserved in Collector log files, but request bodies are not preserved in the Replay viewer.
No reply body
Specifies that all parts (after any defined maskings have been applied) are preserved in Collector log files, but reply bodies are not preserved in the Replay viewer.
Headers only
Specifies that all parts (after any defined maskings have been applied) are preserved in the Collector log files, but only request and response headers are preserved in the Replay viewer.
Note that the use of masking actions is described in Section 13.6, "Masking User Information".
-
Click the replay IP range setting. The dialog shown in Figure 13-34 appears.
Figure 13-34 Edit Collector replay IP Range Dialog
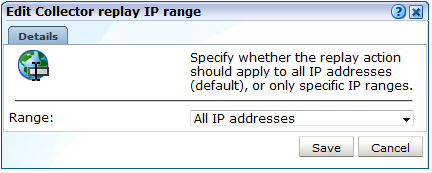
Description of ''Figure 13-34 Edit Collector replay IP Range Dialog''
-
Use the Range menu to specify whether network traffic from all IP address ranges should be logged using the selected default action (the default), or only that from specific address ranges. When ready, click Save. You are returned to the window shown in Figure 13-32.
-
If network traffic should only be logged from specific IP address ranges, click the Logging IP ranges tab. Note that if the "All IP addresses" option is selected, any existing IP address range definitions are disabled and ignored.
-
Click Add new IP range to define a new IP address range, or click an existing definition to modify it. The dialog shown in Figure 13-35 appears.
Figure 13-35 Add Replay IP Address Range Dialog
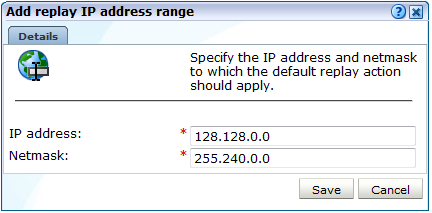
Description of ''Figure 13-35 Add Replay IP Address Range Dialog''
-
Specify the IP address and netmask combination to which traffic logging should be restricted. When ready, click Save.
-
Optionally, you can click Upload list to merge a list of IP address ranges with those that are currently defined. The file must contain only one entry per line, and the information for each address range (that is, the IP address and netmask) must be tab-separated. When ready, click Merge.
-
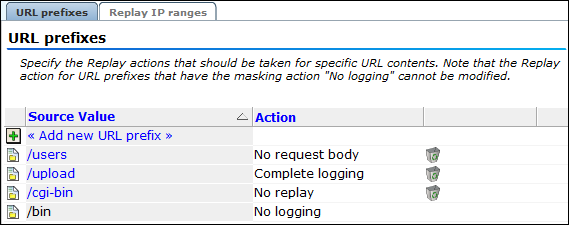
To specify URL component logging policies, click the URL prefixes tab. The currently defined URL prefixes are listed. An example is shown in Figure 13-36.
-
Click Add new URL prefix to define a new URL prefix, or click an existing one to modify it. The dialog shown in Figure 13-37 appears.
Figure 13-37 Add Replay Action for URL Prefix Dialog
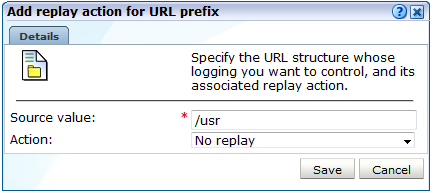
Description of ''Figure 13-37 Add Replay Action for URL Prefix Dialog''
-
Specify the URL component, and select its associated logging action. The available options are explained in Table 13-8. When ready, click Save.
Understanding how Replay Actions are Applied
It is important to understand the following points:
-
The replay actions for URL prefixes with the masking action "No logging" explicitly defined for them (as explained in Section 13.6, "Masking User Information"), appear as automatically listed items, and cannot be modified. An example (
/bin) is shown in Figure 13-36. If you want to modify these items, you must first change their masking action to "Logging". -
The replay actions described in Table 13-8 control the items recorded in the Replay Viewer facility. Table 13-9 indicates which parts are recorded within each replay action.
-
How long a logged item remains available for review via the Replay Viewer is determined by the Error Page Replay (EPR) and Full Session Replay (FSR) settings specified for each of your monitored applications. Therefore, you should ensure that sufficient storage is assigned to them in order to meet your reporting requirements. These settings are explained in Section 13.9, "Defining Collector Data Retention Policies".
Understanding how URL Prefixes are Applied
It is important to understand the following points:
-
Any defined URL prefix replay actions within the active IP range override the default replay action.
-
In the case of overlapping matching URL prefixes (for example,
/ruand/ruei), that have been assigned different replay actions, the longest match is taken. In addition, note that the prefix must be a true prefix. For example, if the matching URL is/app/ruei, neither/ruor/rueiwill be matched. -
The question mark character (?) should not be specified within URL prefixes. If it is, the question mark character, and everything after it, is ignored. For example, if you specify the URL
/catalog/jn.php?item, it is truncated to/catalog/jn.php. URLs should be specified in human-readable format (not encoded). -
URL prefixes are case sensitive.
13.11 Controlling the Monitoring of Jumbo Frames
By default, the Collectors attached to the Reporter only monitor incoming frames with a maximum payload size of 64 KB. This allows RUEI to monitor traffic when the network driver uses TCP segmentation offloading. In some cases it may be necessary to reduce the maximum frame size in order to reduce memory usage and increase the number of frames that can be held in memory. To reduce the maximum frame size:
-
Select Configuration, then Security, and then Jumbo frames.
-
Use the Profile menu to select the required Collector profile.
-
Click the Maximum frame size setting.
-
Select the maximum size of incoming frames accepted by the profile's Collectors. The default is 64 KB. Note that frames that exceed the specified maximum will be discarded, and a message posted in the Event log. When ready, click Save.
The number of frames that can be held in memory as shown in Table 13-10.
Table 13-10 Maximum Frame Size, Number of Frames, and Buffer Size
| Maximum Frame Size | No. of Frames | Buffer Size |
|---|---|---|
|
64KFoot 1 |
8K |
512MBFoot 2 |
|
32K |
16K |
512MBFootref 2 |
|
16K |
32K |
512MBFootref 2 |
|
8K |
64K |
512MB |
|
4K |
64K |
256MB |
|
2K |
64K |
128MB |
Footnote 1 Default.
Footnote 2 The number of frames is adapted automatically.
Therefore, it is recommended that you do not set the maximum frame setting beyond the maximum anticipated frame size within monitored traffic. Note that you can check the maximum frame size encountered by each Collector within the Interfaces tab of the Collector statistics facility (see Section 15.2, "Viewing the Status of the Collectors").
For further troubleshooting procedures, see the Troubleshooting Appendix of the RUEI Installation Guide.
13.12 Controlling RUEI User Session Idle Time
By default, users are logged out of RUEI automatically after 60 minutes if there has been no user activity. To modify the amount of idle time before users are automatically logged out, navigate to Configuration, then select General, Advanced Settings, and User Interface. Select RUEI session idle time (minutes) from the resulting list. Specify the length of visitor inactivity required to elapse before a RUEI session is terminated, or leave empty for unlimited.