2 Working With Reports
This chapter describes the standard library reports that are available to you, how to use reports, control the report mailings you receive, as well as how to modify and create your own reports. The use of the two report modes, inline and print layout, is also explained.
2.1 Introducing the Report Library
Reports provide you with the insight you need to assess the performance of your network infrastructure. They also allow you to see whether defined KPIs and SLAs are being achieved. They enable you to quickly identify any problem areas and, together with the use of alerts, ensure that the necessary corrective action is taken promptly and accurately where required.
RUEI comes with an extensive library of predefined (standard) reports that provides you instant and powerful insight into your organization's monitored operations. These reports are available through the report library, which you can view by clicking the Reports tab. This is shown in Figure 2-1.
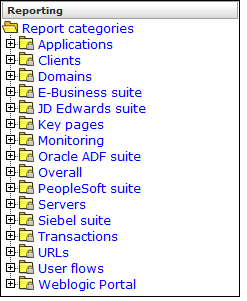
The report library is made up of categories (or folders) containing reports dedicated to particular aspects of the monitored traffic. This enables you to quickly locate the information most relevant to you. The information available in each report category is outlined in Table 2-1.
| Category | Description |
|---|---|
|
Applications |
Provides information about monitored application pages. This includes page views, the objects that appear on the pages, and their loading and reading times. |
|
Clients |
Provides information about monitored application pages. This includes page views, the objects that appear on the pages, and their loading and reading times. |
|
Domains |
Provides information about the monitored domains, including traffic, page views, and loading and reading times. |
|
E-Business Suite |
Provides information about EBS-enabled applications. |
|
Oracle Fusion suite |
Provides information about Oracle Fusion-based applications. |
|
JD Edwards suite |
Provides information about JD Edwards-enabled applications. |
|
Key pages |
Provides information about pages that have been chosen to receive special attention. For these pages, additional information is recorded. |
|
Monitoring |
Provides daily or weekly information on dashboard items (such as SLAs and KPIs). |
|
Oracle ADF suite |
Provides information about Oracle ADF-based applications. |
|
Overall |
Provides cumulative information about the monitored web site, such as failures, total traffic, sessions, and page views. |
|
Servers |
Provides information about client sessions based on assigned IP ranges. |
|
Siebel |
Provides information about Siebel-based applications. |
|
Transactions |
Contains access to historical user flow dataFoot 1 . |
|
URLs |
Provides information about failed or slow hits, and performance killers. |
|
User flows |
Provides client information about all defined web application user flows. For example, how many user flows were initiated by visitors, how long did they take, and how many were completed and aborted. |
|
WebLogic Portal |
Provides information about WebLogic Portal-based applications. |
Footnote 1 In version 6.5.1, transactions were renamed to user flows, and there are important differences in the way they are processed and reported.
2.2 Customizing the Report Library
You can modify the standard report library to better suit your organization's requirements. Using menus, you can rename, remove, or add a report category or subcategory.
It is not possible to modify or delete any standard report. Nor is possible to change their associated permissions. As such, these reports are available to authorized users on a read-only basis. If you want to use a modified version of a standard report, you should use the standard report as the basis for a custom report. The procedure to do this is described in Section 2.11, "Creating New Reports".
To add a category to the main report library, right click the Report categories item. The context menu shown in Figure 2-2 appears.
The following options are available:
-
Add public category to make the new category available to all users.
-
Add private category to make the new category only available to you.
After selecting the required option, you are prompted to specify a unique name for the new category. Report categories are ordered alphabetically, and private categories appear below public ones.
To add a subcategory, or to rename or remove a category, right click the appropriate category. The menu shown in Figure 2-3 appears.
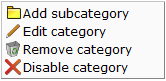
The following options are available:
-
Add subcategory to create a new subcategory under the selected category. This new subcategory will be available to all users.
-
Edit Category to rename or move the category to another location. This option is only available for non-standard report categories.
-
Remove category to delete the category. You are prompted to confirm the deletion. This option is only available for non-standard report categories.
-
Disable category to prevent access to a public report category for all non-Administrator users. This facility is useful when modifying report structures or to restrictive access to reports that contain sensitive information. Note that reports within a disabled category are also automatically removed from the Favorites and Report mailings facilities.
Report Permissions and Power Users
Each user-created report and report category is assigned a usage type. This is either Business or IT, or both. This distinction is also the basis for the user rights explained in Section 14.2, "Understanding User Account Roles and Permissions". If you have been assigned Analytical or Full access level rights as both a Business and IT user (that is, you are a so-called power user), you should be aware that access to the reports you create is controlled on individual report level, and not report category level.
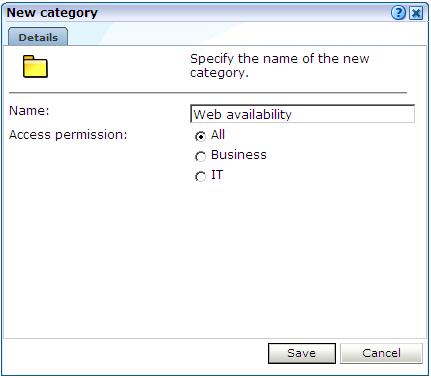
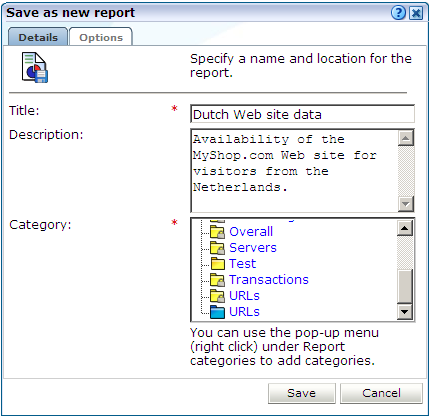
For example, if you create a new public category with the usage type Business, such as the one shown in Figure 2-4, any IT-related reports that are saved to this category cannot be accessed by Business users.
Figure 2-4 Creation of New Public Business Category
Description of ''Figure 2-4 Creation of New Public Business Category''
For this reason, it is recommended that you do not mix reports aimed at different types of users within categories.
2.3 Using the Mailing Facility
You can use the My Mailings facility to obtain a ready overview of the reports you receive through automatic E-mails, and the frequency (daily, weekly, or monthly) with which they are sent to you. An example is shown in Figure 2-5.
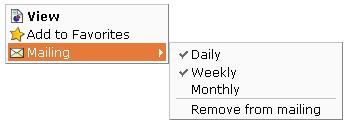
Use the check boxes to the right of a report to specify the frequency with which you want to receive a report. Alternatively, right click a report and select Mailing and the report frequency (Daily, Weekly, or Monthly). You can also select Remove from mailing to stop receiving the selected report.
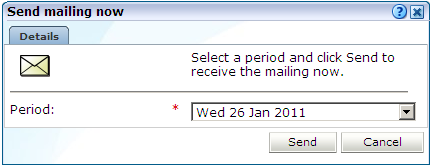
You can use the Daily, Weekly, or Monthly command buttons in the Send mailing now panel to request previous reports. If a command button is unavailable, it means that there are no reports in the mailing list with that frequency.
Note:
The report mailing facility is scheduled to run at 6 am (Reporter system time) every day.For example, if you click Weekly, a list (shown in Figure 2-7) allows you to select a particular week, and you will receive all the weekly reports for the selected week that are currently checked in your mailing profile.
2.4 Using the Favorites Facility
To help you quickly locate the reports you work with most often, click the Favorites option. This facility allows you to create shortcuts to them.
To add a report to your Favorites section, right click the required report, and select Add to Favorites from the menu shown in Figure 2-6. To open the report, click the shortcut, or select View from the menu. To review or change the report´s current mailing frequency, select Mailing and the required option.
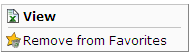
To delete a shortcut from your Favorites, right click it, and select Remove from Favorites from context menu the shown in Figure 2-8.
2.5 Managing Report Mailings
The Report Mailings facility provides for the easy management of the reports mailed to users. Note that this facility is only available to the Administrator. To specify the users that should receive a report, do the following:
-
Click Reports, then Mailing, and then Report mailings.
-
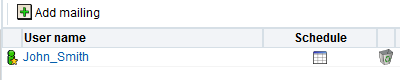
Select the report whose recipients you want to specify. The users who currently receive the selected report are listed, and the frequency with which they receive it. An example is shown in Figure 2-9.
Optionally, click the schedule icon to customize the report mailing schedule. The Customize the report publication schedule screen appears, you can now customise the schedule using the following procedure:
-
Select whether to send the report daily, weekly or monthly. Note that you can define combinations of these schedules, for example, to send mails weekly on a Monday and also on the first of every month.
-
Click Add profile to define a time, day of week, or day of month for publication.
-
Set the required publication timing, including hour and minute of day.
-
Set the reporting period by defining a period on the Customize the report publication schedule screen. By default, all of the period is defined, for example, a daily report has all 24 hours defined as the period. To avoid confusion, define a period before the publication time.
-
Click Save.
-
-
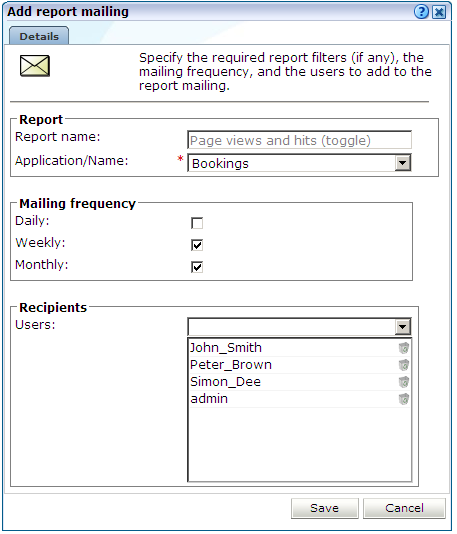
Click the Add mailing command button to add a new report recipient. The dialog shown in Figure 2-10 appears.
-
If the selected report was created with one or more filters (see Section 3.9.3, "Using Report Filters"), you can use the appropriate dimension menus to specify the appropriate values.
-
Use the Daily, Weekly, and Monthly check boxes to specify the frequency with which recipients should receive the selected report.
-
Use the Users field to specify the report's recipients. When ready, click Save.
2.6 Using the Calendar
A report provides information about a particular date or period. Hence, it is necessary to specify the period for which you want information. Use the Calendar, shown in Figure 2-11, to specify the required date or period.
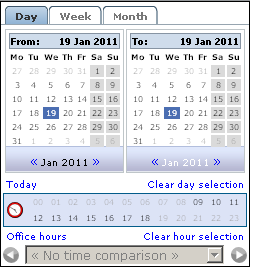
The Calendar contains the following parts:
-
The From and To sections provide a mechanism to specify the period for which you want information. This can be specified in terms of days, weeks, or months. The selected date(s) are shown in highlight. To de-select a date, simply click it again. Use the arrow keys at the bottom of the displayed columns to move backwards and forwards by months or years. You can click Clear day selection to quickly de-select all current selections. By default, the current date is selected. This can also be selected by clicking Today.
-
The Day tab allows you to specify the required period in terms of specific days. Note that if you select a single day, an additional panel allows you to restrict the report to specific hours within the selected day. You can click hours to select and de-select them, or click Office hours to immediately select 09 to 18. You can also quickly de-select any selected hours by clicking Clear hour selection.
-
The Week and Month tabs allow you to request information specified in terms of complete weeks or months.
-
The Compare offset menu allows you to compare data relating to one period with a comparable period. The use of this facility is described in Section 3.10, "Comparing Data Across Different Periods".
Note that while viewing a report, you are free to change your period selection at any time. Simply use the controls described above, and the report is immediately updated to reflect your new period selection.
2.7 Using Report Filters
If you open a report created with a report filter (described in Section 3.9.3, "Using Report Filters"), you are prompted to specify a filter for the report. For example, if the report concerns the browser types, you are prompted for the browser you want to view. This is shown in Figure 2-12.
Select the required value from the displayed list, and click View report. The report then opens. Note that the values available for selection for each required filter include only the values available from the selected report, that is, the values have already been filtered.
2.8 Understanding Report Components
Each report consists of a header, an Information screen, and a number of sections. These report parts are described in the following sections.
The report header contains general information about the report you are viewing. This includes the report's title, an indication of the reported metrics, and the date or period to which the report refers. An example is shown in Figure 2-13.
The information screen provides a glossary of the terms used in the report. This is useful when you (or other report users) need an explanation of the metrics used in a report. An example is shown in Figure 2-14.
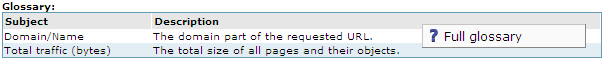
Note you can also obtain a complete list of all terms used in reports, together with an explanation of them, by right-clicking within the glossary and selecting Full glossary.
Typically, a report contains several sections, and the number of available sections varies between reports. For example, a daily traffic report would contain two sections: one reporting traffic in terms of page views for the requested period, and the other reporting traffic in terms of bytes.
You can move between report sections by using the icons in the toolbar at the top of the report panel. In addition, they allow you to view the report's information screen, and switch between a graphic and table (value) view of the report's data. These icons are shown in Figure 2-15 and explained in Table 2-2.
Table 2-2 Inline Layout Icons Explained
| Icon | Description |
|---|---|
Description of the illustration ''informscreenicon.gif'' |
Glossary. Provides a brief explanation of the metrics currently shown in the report. |
Description of the illustration ''barcharticon.gif'' |
Graph. Displays the standard graphic visualization (pie chart, line chart, or bar chart) for the report section. The graphic form depends on the underlying data. |
Description of the illustration ''valuelisticon.gif'' |
Values. Shows the underlying data values for the data in the report. |
Description of the illustration ''leftgreenarrow.gif'' Description of the illustration ''rightgreenarrow.gif'' |
Previous and Next section. Use these controls to move between the report's sections. The number of available sections varies between reports. |
Description of the illustration ''currentsection.jpg'' |
Indicates the current section in the report. |
Description of the illustration ''previewicon.gif'' |
Preview. Opens the report in print layout mode. This is the mode to use when you want to customize the report, or create a new report based on it. |
Description of the illustration ''pdfcreateicon.gif'' |
Download PDF. Create an Adobe PDF file of the report's current contents. |
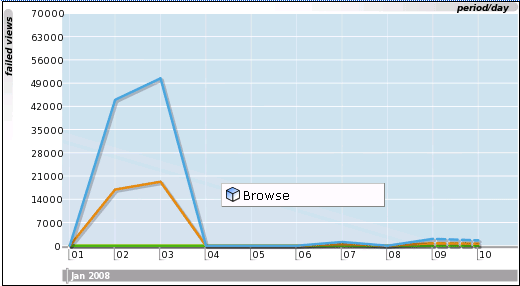
In addition to the options shown in Figure 2-15, you can also use Browse option (shown in Figure 2-16) within each section's context menu to obtain a complete view of the data from which the report section is derived. This is described in Chapter 3, "Working With the Data Browser."
Each section within a report can be enabled or disabled. When disabled, a section is shown as collapsed, and must be enabled to make it visible again. An example of a disabled report section is shown in Figure 2-17.
It is important to understand that this facility is used to control the content of the final (saved) report. For example, if the existing report that you are using as the basis for your new report contains sections that are not relevant to the new report, you can use this feature to remove them from the final report.
2.9 Interpreting Reported Values
When using reports (and the Data Browser described in Chapter 3, "Working With the Data Browser"), a value list may sometimes contain the text "n/a" rather than a reported value. This is caused by no measured data being available. With line graphs and bar charts, this situation is indicated by a 0 (zero) value. This can arise in the following situations:
-
Averages for a selected period are always calculated on the basis of available data. Therefore, if you have requested information about an average value over the last 24 hours, but only 20 hours of data is available, the average would be calculated on the basis of 20 hours, and not 24 hours.
-
Period-based reports might contain automatically inserted "n/a" rows to ensure that the order and range between rows is consistent.
-
The use of filters may lead to data becoming unavailable for the active period. This will also lead to the insertion of "n/a" values. Note that for columns reporting totals, these values are interpreted as 0.
2.10 Working With Print Layout Mode
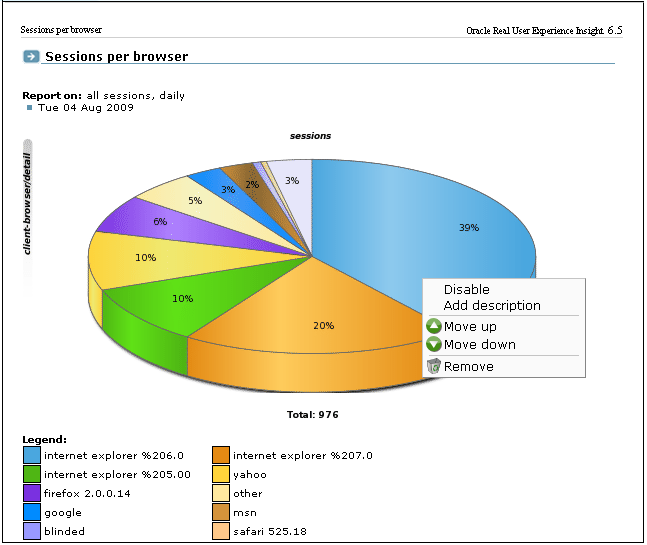
When you open a report in RUEI, it is shown in inline mode. This offers a high-level overview of the report's contents, and provides ready access to more detailed information available through the report. When browsing a report, this is the mode that you will use. However, when you want to customize reports, or create new ones, a more powerful editing mode is required: this is called print layout. To view a report in print layout, select Preview from the taskbar at the top of the report panel (shown in Figure 2-15). An example is shown in Figure 2-18.
Figure 2-18 Example Report in Print Layout
Description of ''Figure 2-18 Example Report in Print Layout''
This layout can be thought of as the report's template: it defines the report's structure and appearance. The report's print layout is shown in a new window.
The first major difference you will notice between the two layouts is that, in print layout, all report sections (including the Information screen) are shown. This provides you with a complete overview of the report's contents. The other major difference is that the report's data is shown in both graphic and value (table) form.
You can use the context menu (shown in Figure 2-18) available under each section to modify the section to your requirements. It allows you to add descriptions to sections, enable and disable report sections (explained in Section 2.8, "Understanding Report Components"), remove sections from the report, and change the order in which sections appear in the report.
2.10.1 Customizing a Report using Print Layout Mode
If you want to modify the columns that are displayed in a report:
-
Select the report that you want to modify and click Preview from the taskbar at the top of the report panel (shown in Figure 2-15) to enter Print Layout Mode.
-
Right Click on a column that you want to modify and click Edit. The Customize Export dialog, similar to the one shown in Figure 3-24, appears.
-
Add or remove columns from the report as required by modifying the Data Columns and Value Columns fields.
-
For details on customizing the export, see Chapter 3, "Modifying the Exported Data".
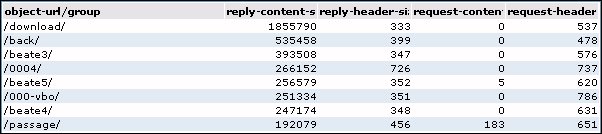
2.10.2 Working With Value Lists
By default, data in report sections is shown in graphic form. However, sometimes you want to see "hard" numbers, rather than a graphic visualization. In addition, you may be planning to distribute the report to users whose printing or display facilities are limited. Therefore, you can use the Values and Graph icons in the toolbar at the top of the report panel (see Figure 2-15) to switch between the two views. An example of a value table is shown in Figure 2-19.
2.10.3 Limiting Value Lists
Within a value list, you can click Preview and then select Limit value lists from the menu to specify the number of values that are shown for both reports and exports.
If you specify a value of -1, all available values will be shown. It is recommended that you use this facility with care because of potentially very large value lists. The default is 100.
2.10.4 Working in Compare Mode
When a report is created using the compare facility (described in Section 3.10, "Comparing Data Across Different Periods"), an additional option, Compare, is available within the context menu of its main section.This allows you to specify the offset period to be used in the report. The available periods depend on the report's active time selection (day, week, or month).
2.11 Creating New Reports
In addition to the standard reports provided in the report library, you can also create new reports. To do so, you should use an existing report as the basis for your new report, and then modify it to meet your requirements. To save the new report, do the following:
-
When you are ready to create the new report, select Save as new from the File menu. The dialog shown in Figure 2-20 appears:
-
Specify a title and brief description for the new report, and the category to which it should be saved. As mentioned earlier, if you save the report to a private category, it will only be available to you. The Options tab allows you to specify whether the glossary is included in the report. When ready, click Save. If a report with that title already exists, you are prompted with an option to replace it.
Note that if the report you created is not immediately visible in the report library, click the Reports icon to refresh the displayed structure.
Modifying Existing Reports
You can use the facilities described in Section 2.8, "Understanding Report Components" to modify a report. Note that it is not possible to modify standard reports (described in Section 2.1, "Introducing the Report Library"). Your ability to create new reports depends on your assigned user permissions. If you create a public report, it is editable by users with the necessary permissions, and is available on a read-only basis to all other users.
2.12 Exporting Reports to PDF
You can click the Download report as PDF icon or select Download report as PDF from the File menu to create an Adobe PDF file of the report's current contents. Use Page orientation from the File menu to create either a portrait or landscape PDF file. Note that sections that are disabled in print layout are not included in the generated PDF file.
Note:
In order to view the generated PDF files, the Adobe Acrobat Reader must be installed. It is available for download from the Adobe web site (www.adobe.com).2.13 Exporting Report Data
The report data within RUEI is available for export in various formats including XML and CSV to host or client systems using a web query. For example, to a Business Intelligence (BI) system. The exported data is in Unicode (UTF-8) format. Data can be downloaded from RUEI using a web request by a RUEI user with the Report Data Export role using basic authentication. Administrators can use RUEI to construct a URL with parameters for this purpose. To use this facility, do the following:
-
Select Reports,
-
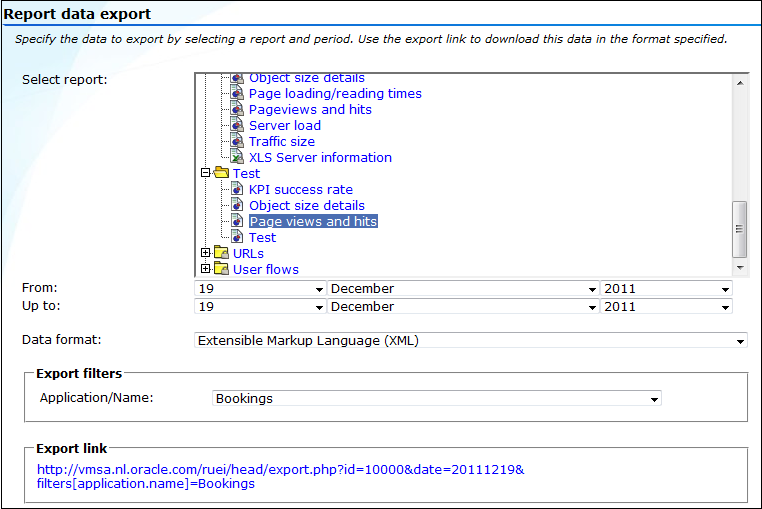
Select the required report and then select Export Report URL in the toolbar. The window shown in Figure 2-21 appears.
-
Specify the period for which data should be available.
-
Use the Data format menu to specify the format in which the report data should be exported. The default is Extensible Markup Language (XML).
-
If the case of a report that makes use of a filter, select the required dimension value. The use of filters is described in Section 2.7, "Using Report Filters".
-
A URL to the report data appears. Copy and send this to all relevant hosts. Users will require a valid username and password to access the report data.
-
If necessary create a user with the Report Data Export role to access the report data. For more information on user roles see Section 14.2, "Understanding User Account Roles and Permissions".
By default, exported data is provided for a complete day, and in XML format. However, the arguments shown in Table 2-3 can also be specified.
Table 2-3 Additional Arguments for Report Data Export Facility
| Argument name | Argument value | Description |
|---|---|---|
|
|
|
Export data in PDF format. |
|
|
Export data in XLS format. |
|
|
|
Export data in XML format (default). |
|
|
|
Export data in comma-separated values. |
|
|
|
Export data in tab-separated values. |
|
|
|
Export data in Web Query format. |
|
|
|
|
Export data provided for a complete day (default). |
|
|
Export data provided for a specific hour. |
|
|
|
Export data provided for a specific 5-minute period. |
|
|
|
|
Export data provided up to a specific day. |
|
|
Export data provided up to a specific hour. |
|
|
|
Export data provided up to a specific 5-minute period. |
Footnote 1 The time range arguments are always in local time with respect to the Reporter system.
Footnote 2 The lowest granularity of the date format is a 5-minute period. Therefore, specifying a date of yyyymmdd1215 will return values for the period 1215-1219.
For example:
http://myshop/ruei/export.php?id=10056&output=csv&date=20101025&date-to=20101027
exports the selected report data in comma-separated values format for the period 25-27 October 2010.
2.13.1 Creating Dynamically Refreshing Dashboards
The Report data export facility can be used to create dynamically refreshing Microsoft Excel spreadsheets. Note that the procedure described below requires a valid user with the Report data export role. These can then be the basis for external dashboards. To create such data feeds, do the following:
-
Select System, and then Report data export. Select the newly created export from the displayed list (Figure 2-21). Note the URL that appears to the export data.
-
Create the file
ruei.iqyon your local system with the following contents:WEB 1 https://<Reporter>/ruei/export.php?output=wqf id=["id","The report ID"]&date=["date","Begin date YYYYMMDD"]&date-to=["date-to","End date YYYYMMDD"]Note that the
Reporterpart of the above specified URL should be replaced with the appropriate host name or IP address. -
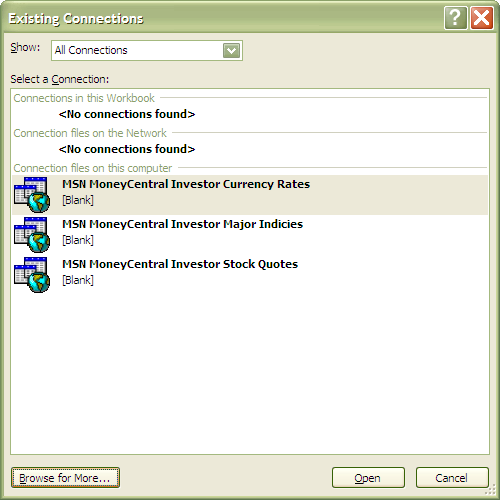
Within Microsoft Excel, select Existing connections from the File menu. Click Browse. A dialog similar to the one shown in Figure 2-22 appears.
-
Click Browse for More, and navigate to and select the
ruei.iqyfile you created earlier. A dialog similar to the one shown in Figure 2-23 appears. -
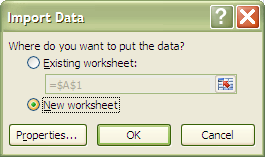
Specify that the imported data should be used to create a new spreadsheet. When ready, click OK. A dialog similar to the one shown in Figure 2-24 appears.
Figure 2-24 Enter Parameter Value Dialog
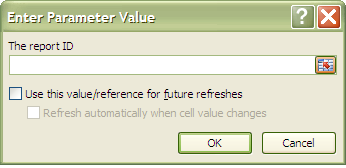
Description of ''Figure 2-24 Enter Parameter Value Dialog''
-
Specify the report ID included in the URL provided to you by the Report data export facility. You are then prompted for the start and end dates. Note that each of these can either be retrieved from a cell within the spreadsheet, or entered directly. When ready, click OK. The data from the specified export source is automatically updated by RUEI.
Note that the number of rows returned within the Microsoft Excel spreadsheet may differ across particular intervals. Therefore, you should ensure that this is taken into account when designing filtering and other formatting queries. In addition, the appropriate menu options and appearance of dialogs may differ from those described above depending on the version of Microsoft Excel you are using.