14 Viewing Metrics
This chapter details metric information collected for your TimesTen database and TimesTen instance to assist you in determining the efficiency and performance of your target.
Topics include:
Navigating to the TimesTen database metrics page
Ensure that you are on the TimesTen database target page. For more information on navigating to the TimesTen database target page, see "Navigating to the TimesTen target page".
-
From the TimesTen Database Home menu, select Monitoring, then select All Metrics.
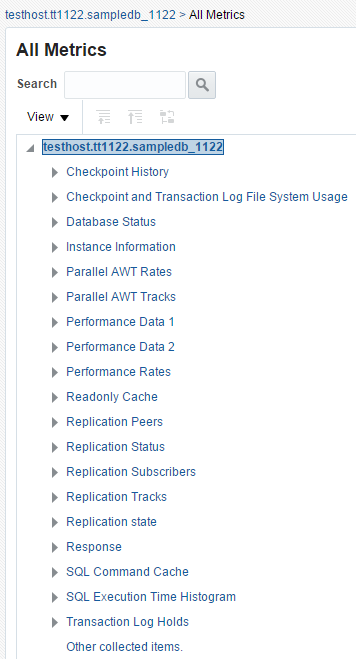
Figure 14-1 TimesTen database All Metrics
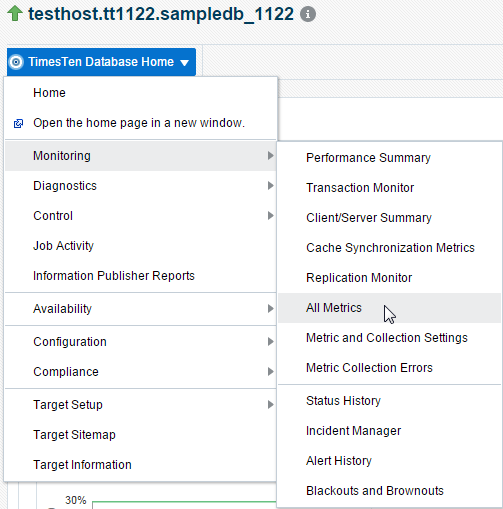
Description of ''Figure 14-1 TimesTen database All Metrics ''
The All Metrics page displays. Locate the name of the metric group.
-
Expand the metric group, and click the name of the metric.
The metric information displays in table format. For more information on TimesTen database metrics, see "Viewing TimesTen database metrics".
Navigating to the TimesTen instance metrics page
Ensure that you are on the TimesTen instance target page. For more information on navigating to the TimesTen instance target page, see "Navigating to the TimesTen target page".
-
From the or TimesTen Instance Home menu, select Monitoring, then select All Metrics.
Figure 14-2 TimesTen Instance All Metrics
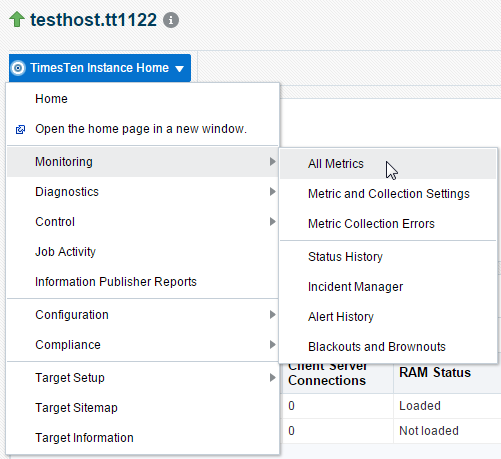
Description of ''Figure 14-2 TimesTen Instance All Metrics''
The All Metrics page displays. Locate the name of the metric group.
-
Expand the metric group, and click the name of the metric.
The metric information displays in table format. For more information on TimesTen instance metrics, see "Viewing TimesTen instance metrics".
Viewing TimesTen database metrics
There are twelve groups of TimesTen database metrics:
Some metrics have predefined warning and critical thresholds. You can modify and add new thresholds. The Oracle Enterprise Manager Cloud Control issues alerts and warnings when the values collected for the metrics surpass the set threshold.
Checkpoint history
Table 14-1 lists each metric and describes the metrics.
| Metric | Description |
|---|---|
|
Blocks currently in use out of total blocks |
The number of blocks that are currently in use. |
|
Bytes occupied by all blocks |
The number of bytes occupied by all blocks. |
|
Bytes occupied by blocks in use |
The number of bytes occupied by the blocks that are in use. |
|
Bytes occupied by dirty blocks |
The number of bytes occupied by dirty blocks. |
|
Bytes written in MB |
Bytes written in megabytes. |
|
Bytes written per sec |
Bytes written per second. |
|
Checkpoint sequence number |
Checkpoint sequence number. |
|
Dirty blocks written by this checkpoint |
The number of dirty blocks written by this checkpoint. |
|
Initiator |
The initiator of the checkpoint request. |
|
Percentage of the checkpoint that has been completed |
Indicates the percentage of the checkpoint that has been completed. If there is no checkpoint in progress, the value is |
|
Permanent blocks currently allocated in the database |
Permanent blocks currently allocated in the database. |
|
Status |
Status of the checkpoint operation. |
|
The database file number used by the checkpoint |
The database file number used by the checkpoint. |
|
The transaction log file number of the checkpoint log record |
The transaction log file number of the checkpoint log record. |
|
The transaction log file offset of the checkpoint log record |
The transaction log file offset of the checkpoint log record. |
|
Time when the checkpoint completed |
Time when the checkpoint completed. |
|
Time when the checkpoint was begun |
Time when the checkpoint began. |
|
TimesTen database error number for the failure |
TimesTen error number that indicates the reason for the failure. |
|
Total bytes written by this checkpoint |
The total number of bytes written by this checkpoint. |
|
Type |
The type of checkpoint. |
Checkpoint and transaction log file system usage
Table 14-2 lists each metric and describes the metrics.
Table 14-2 Checkpoint and Transaction Log File System Usage
| Metric | Description |
|---|---|
|
Checkpoint file system |
Checkpoint file system. |
|
Checkpoint file system mount Point |
Checkpoint file system mount point. |
|
Checkpoint file system size (MB) |
Checkpoint file system size in megabytes. |
|
Checkpoint file system space available (%) |
Checkpoint file system space available (expressed as a percentage). |
|
Checkpoint file system space available (MB) |
Checkpoint file system space available in megabytes. |
|
Transaction log file system |
Transaction log file system. |
|
Transaction log file system mount point |
Transaction log file system mount point. |
|
Transaction log file system size (MB) |
Transaction log file system size in megabytes. |
|
Transaction log file system space available (%) |
Transaction log file system space available (expressed as a percentage). |
|
Transaction log file system space available (MB) |
Transaction log file system space available in megabytes. |
Database status
Table 14-3 shows information about your database.
Instance information
Table 14-4 shows information about your TimesTen instance.
Table 14-4 Instance Information
| Name | Description |
|---|---|
|
Daemon port number |
Daemon port number. |
|
Instance name |
TimesTen instance name. |
|
Platform type |
Platform type. For example, Linux/86_32. |
|
TimesTen server port number |
Server port number. |
|
TimesTen server process ID |
TimesTen server process identifier. |
|
TimesTen server running |
1 if running, 0 if not running. |
|
TimesTen version number |
Five-digit release number. |
For more information on your TimesTen instance, see "ttStatus" in the Oracle TimesTen In-Memory Database Reference.
Parallel AWT rates
Table 14-5 shows information about your Parallel AWT rates.
| Name | Description |
|---|---|
|
Bytes sent in PL/SQL mode MB per sec |
The number of megabytes sent in PL/SQL mode to the Oracle database per second. |
|
Bytes sent in SQL mode MB per sec |
The number of megabytes sent in SQL mode to the Oracle database per second. |
|
Oracle database Rollbacks Timeout per sec |
The timeout per second for rollbacks on the Oracle database. |
|
Total AWT MB per sec |
The number of megabytes sent for AWT to the Oracle database per second. |
|
Total number of Oracle database commits per sec |
The total number of Oracle database commits per second. |
|
Total number of batches sent fully per sec |
The total number of batches sent fully per second. |
|
Total number of batches sent partially per sec |
The total number of batches sent partially per second. |
|
Total number of transactions per sec |
The total number of transactions sent to the Oracle database per second. |
|
Transaction master restart per sec |
The number of transaction master restarts per second. |
|
Transactions Generated on TimesTen database per sec |
The number of transactions generated on the TimesTen database per second. |
|
Transactions propagated to Oracle database per sec |
The number of transactions propagated to the Oracle database per second. |
Parallel AWT tracks
Table 14-6 shows information about your Parallel AWT tracks.
Table 14-6 Parallel AWT tracks
| Name | Description |
|---|---|
|
Batches Begin Waited |
The number of AWT batches that had to wait on a begin dependency before being transmitted between the TimesTen database and the Oracle database. |
|
Batches Begin Waits Count |
The number of times the AWT batch had to check on a begin dependency to be satisfied before being transmitted between the TimesTen database and the Oracle database. |
|
Commit Waited Count |
The number of times the AWT batch had to check on a commit dependency to be satisfied before the AWT batch is committed on the Oracle database. |
|
Full Batches |
The number of full AWT batches transmitted between the TimesTen database and the Oracle database. |
|
Oracle database Rollbacks |
The number of rollbacks performed on the Oracle database. |
|
PL/SQL Mode Batches |
The number of AWT batches transmitted between the TimesTen database and the Oracle database in PL/SQL mode. |
|
Partial Batches |
The number of partial AWT batches transmitted between the TimesTen database and the Oracle database. |
|
SQL Mode Batches |
The number of AWT batches transmitted between the TimesTen database and the Oracle database in SQL mode. |
|
Subscriber |
The name of the subscriber database. |
|
Track |
The track number. |
|
Transaction processed |
The total number of transactions processed. |
|
Transactions processed per sec |
The number of transactions processed per second. |
Performance data
Table 14-7 shows performance information.
| Metric | Description |
|---|---|
|
Cache - AWT transactions committed on Oracle database |
Number of AWT transactions committed on the Oracle database. |
|
Cache - AWT transactions re-tries in case of an error |
Number of times AWT transactions are re-tried on Oracle database. |
|
Cache - Autorefresh cycles completed successfully |
Number of autorefresh cycles completed successfully on TimesTen. |
|
Cache - Autorefresh cycles that failed due to errors |
Number of autorefresh cycles that failed because of errors. |
|
Cache - Batches sent to Oracle database in SQL mode |
Number of batches sent to the Oracle database in SQL mode ( |
|
Cache - Bytes flushed to Oracle database |
Number of bytes flushed to the Oracle database. |
|
Cache - Bytes loaded due to dynamic load miss-local |
Total number of bytes loaded from the Oracle database for servicing dynamic load misses for dynamic local cache groups. |
|
Cache - Bytes loaded due to dynamic load misses |
Total number of bytes loaded from the Oracle database for servicing dynamic load misses. |
|
Cache - Bytes sent to Oracle database for SWT operations |
Number of bytes sent to the Oracle database during SWT cache group operations. |
|
Cache - Bytes sent to Oracle database in PL/SQL mode |
Number of bytes sent to the Oracle database in PL/SQL mode ( |
|
Cache - Bytes sent to Oracle database in SQL mode |
Number of bytes sent to the Oracle database in SQL mode ( |
|
Cache - Calls made to Oracle database for AWT |
Number of calls made to the Oracle database for AWT. |
|
Cache - Data loads from Oracle database for dynamic load misses |
Number of data loads from the Oracle database when servicing dynamic load misses for dynamic local cache groups. |
|
Cache - Data reqs. due to dyn. load on remote cache grid member |
Number of requests for data received by this cache grid member from another cache grid member (because of a dynamic load on the remote cache grid member). |
|
Cache - Data requests received for dirty data |
Number of requests for data received by this cache grid member when the data requested is dirty (and must first be propagated to the Oracle database). |
|
Cache - Data requests received where data not present |
Number of requests for data received by this cache grid member when the data requested was not found in this member. |
|
Cache - Data requests received where locked by transaction |
Number of requests for data received by this cache grid member when the data requested was locked by a transaction on this member. |
|
Cache - Delete batches sent to Oracle database in SQL mode |
Number of delete batches sent to the Oracle database in SQL mode ( |
|
Cache - Dynamic load misses from the Oracle database |
Number of times a dynamic load miss had to load the requested data from the Oracle database. |
|
Cache - Flush cache group executes |
Number of flush cache group executions. |
|
Cache - Full refreshes triggered during autorefresh operations |
Number of full refreshes triggered during autorefresh operations. |
|
Cache - Global dynamic cachegroup cache hits |
Global dynamic cache group hits: Dynamic loads that find the data in the local cache grid member without requiring the data to be loaded from the Oracle database or another cache grid member. |
|
Cache - Global dynamic cachegroup cache misses |
Global dynamic cache group misses: Dynamic loads that do not find data initially in the local cache grid member (either need to go to the Oracle database or another cache grid member). |
|
Cache - Insert batches sent to Oracle database in SQL mode |
Number of insert batches sent to the Oracle database in SQL mode ( |
|
Cache - Local dynamic cachegroup cache hits |
Local dynamic cache group hits: Number of dynamic loads that find the requested data in the database. |
|
Cache - Local dynamic cachegroup misses |
Local dynamic cache group misses: Number of dynamic loads that do not find the requested data in the database and need to load the data from the Oracle database. |
|
Cache - PL/SQL block batches sent to Oracle database |
Number of PL/SQL block batches sent to the Oracle database. ( |
|
Cache - Remote dynamic loads |
Dynamic loads that do not find data in the local cache grid member and successfully load the required data from another cache grid member. |
|
Cache - Rollbacks on Oracle database because of errors |
Number of rollbacks on Oracle database because of errors. |
|
Cache - Rows deleted in the TimesTen database by autorefresh |
Number of rows deleted from TimesTen during autorefresh from the Oracle database. |
|
Cache - Rows deleted on Oracle database in PL/SQL |
Number of rows deleted from Oracle database in PL/SQL mode ( |
|
Cache - Rows deleted on Oracle database in SQL |
Number of rows deleted from the Oracle database in SQL mode ( |
|
Cache - Rows flushed to Oracle database |
Number of rows flushed to the Oracle database. |
|
Cache - Rows in SWT cache groups deleted on Oracle database |
Number of rows in SWT cache groups deleted from Oracle database. |
|
Cache - Rows in SWT cache groups inserted on Oracle database |
Number of rows in SWT cache groups inserted into Oracle database. |
|
Cache - Rows in SWT cache groups updated on Oracle database |
Number of rows in SWT cache groups updated on Oracle database. |
|
Cache - Rows inserted in the TimesTen database by autorefresh |
Number of rows inserted into TimesTen during autorefresh from the Oracle database. |
|
Cache - Rows inserted on Oracle database in PL/SQL mode |
Number of rows inserted into Oracle database in PL/SQL mode ( |
|
Cache - Rows inserted on Oracle database in SQL mode |
Number of rows inserted into Oracle database in SQL mode ( |
|
Cache - Rows updated in the TimesTen database by autorefresh |
Number of rows updated in TimesTen during autorefresh from the Oracle database. |
|
Cache - Rows updated on Oracle database in PL/SQL mode |
Number of rows updated on Oracle database in PL/SQL mode ( |
|
Cache - Rows updated on Oracle database in SQL mode |
Number of rows updated on Oracle database in SQL mode ( |
|
Cache - Transactions propagated from TimesTen to Oracle database |
Number of TimesTen transactions propagated to the Oracle database. |
|
Cache - Update batches sent to Oracle database in SQL mode |
Number of updated batches sent to the Oracle database in SQL mode ( |
|
Cache grid - Cache grid members that have attached so far |
Number of attach operations. |
|
Cache grid - Detach operations |
Number of detach operations. |
|
Checkpoint - Bytes written during last checkpoint |
Number of bytes written during last checkpoint. |
|
Checkpoint - Checkpoint bytes written during database recovery |
Number of bytes written for checkpointing during database recovery. |
|
Checkpoint - Checkpoint volume in bytes |
Number of bytes written for checkpointing. |
|
Checkpoint - Checkpoint writes |
Number of checkpoint writes. |
|
Checkpoint - Checkpoints completed |
Number of checkpoints completed. |
|
Checkpoint - End time of last checkpoint begun |
End time of last checkpoint begun. |
|
Checkpoint - Fuzzy checkpoints completed |
Number of fuzzy checkpoints completed. |
|
Checkpoint - Start time of last checkpoint begun |
Start time of last checkpoint begun. |
|
Checkpoint - Status of last checkpoint begun |
Status of last checkpoint begun. For instance, completed. |
|
Checkpoint - Type of last checkpoint begun |
Type of last checkpoint begun. For example, fuzzy. |
|
Checkpoint - Whether last checkpoint begun had an error |
Whether last checkpoint begun had an error. |
|
Client/Server - Round trips |
Number of client/server round-trips. |
|
Client/Server - ALTER statements executed by server |
Number of |
|
Client/Server - Bytes received by server |
Number of client/server bytes received by server. |
|
Client/Server - Bytes transmitted by server |
Number of client/server bytes transmitted by server. |
|
Client/Server - CREATE statements executed by server |
Number of |
|
Client/Server - DELETE statements executed by server |
Number of |
|
Client/Server - DROP statements executed by server |
Number of |
|
Client/Server - Disconnects |
Number of client/server disconnects. |
|
Client/Server - INSERT statements executed by server |
Number of |
|
Client/Server - MERGE statements executed by server |
Number of |
|
Client/Server - SELECT statements executed by server |
Number of |
|
Client/Server - Table rows deleted by server |
Number of table rows deleted by server. |
|
Client/Server - Table rows inserted by server |
Number of table rows inserted by server. |
|
Client/Server - Table rows updated by server |
Number of table rows updated by server. |
|
Client/Server - Transaction rollbacks by server |
Number of transaction rollbacks by server. |
|
Client/Server - Transactions committed by server |
Number of transactions committed by server. |
|
Client/Server - UPDATE statements executed by server |
Number of |
|
Connections - Client-server connections established |
Cumulative number of client/server connections established. |
|
Connections - Database connects established |
Cumulative number of database connections established. |
|
Connections - Database connects exceeding configured maximum |
Cumulative number of database connection thresholds exceeded. |
|
Connections - Database disconnects |
Cumulative number of database disconnections. |
|
Connections - Direct linked database connections established |
Cumulative number of direct-linked database connections established. |
|
Connections - First database connections established |
Number of first database connections established. |
|
DB - Deletes from range indexes |
Number of rows deleted from range indexes. |
|
DB - Full table scans |
Number of full table scans. |
|
DB - Hash index inserts during database recovery index rebuild |
Number of rows inserted into hash indexes during index rebuild phase of database recovery. |
|
DB - Hash indexes scanned |
Number of hash indexes scanned. |
|
DB - Hash indexes scanned during replication |
Number of hash indexes scanned during replication operations (such as insert, update, and delete operations on tables). |
|
DB - Indexes rebuilt |
Number of indexes rebuilt. |
|
DB - Inserts into range indexes |
Number of rows inserted into range indexes. |
|
DB - LRU aging commits done since database loaded |
Number of LRU aging commits since the database was loaded into memory. |
|
DB - LRU aging cycles completed since database loaded |
Number of LRU aging cycles completed since the database was loaded into memory. |
|
DB - LRU aging high threshold crossings since database loaded |
Number of times LRU aging high threshold has been reached since the database was loaded into memory. |
|
DB - Merge joins done |
Number of merge joins done. |
|
DB - Nested loop joins done |
Number of nested loop joins done. |
|
DB - Range index inserts during database recovery index rebuild |
Number of rows inserted into range indexes during index rebuild phase of database recovery |
|
DB - Range indexes scanned |
Number of temporary indexes scanned. |
|
DB - Range indexes scanned during replication |
Number of temporary indexes scanned during replication operations. |
|
DB - Rows deleted during LRU aging since database loaded |
Number of rows deleted during LRU aging since the database was loaded into memory. |
|
DB - Rows deleted during time-based aging since database loaded |
Number of rows deleted during time-based aging since the database was loaded into memory. |
|
DB - Rows deleted from hash indexes |
Number of rows deleted from hash indexes. |
|
DB - Rows fetched from hash indexes |
Number of rows fetched from hash indexes. |
|
DB - Rows fetched from hash indexes during replication |
Number of rows fetched from hash indexes during replication operations. |
|
DB - Rows fetched from range indexes during replication |
Number of rows fetched from range indexes during replication operations. |
|
DB - Rows fetched from temp indexes during replication |
Number of rows fetched from temporary indexes during replication operations. |
|
DB - Rows fetched from temporary indexes |
Number of rows fetched from temporary indexes. |
|
DB - Rows inserted into hash indexes |
Number of rows inserted into hash indexes. |
|
DB - Rows not deleted using LRU aging because of lock contention |
Number of rows that were not deleted using LRU aging because of lock contention since the database was loaded into memory. |
|
DB - Rows not deleted using time-based aging - lock contention |
Number of rows that were not deleted using time-based aging because of lock contention since the database was loaded into memory. |
|
DB - Sorts done |
Number of sorts done. |
|
DB - Table rows deleted |
Number of table rows deleted. |
|
DB - Table rows inserted |
Number of table rows inserted. |
|
DB - Table rows read |
Number of table rows read. |
|
DB - Table rows updated |
Number of table rows updated. |
|
DB - Temporary indexes created |
Number of temporary indexes created. |
|
DB - Temporary indexes scanned |
Number of range indexes scanned. |
|
DB - Temporary indexes scanned during replication |
Number of range indexes scanned during replication operations (such as insert, update, and delete operations on tables). |
|
DB - Time-based aging commits done since the database loaded |
Number of time-based aging commits since the database was loaded into memory. |
|
DB - Time-based aging cycles completed since database loaded |
Number of time-based aging cycles completed since the database was loaded into memory. |
|
DB - Times LRU aging low threshold reached since database loaded |
Number of times LRU aging low threshold has been reached since the database was loaded into memory. |
|
DB - Tuples fetched from range indexes |
Number of rows fetched from range indexes. |
|
DB - Updates on range indexes |
Number of rows updated on range indexes. |
|
Lock - Deadlocks |
Number of deadlocks. |
|
Lock - Locks acquired for DML activity |
Number of locks acquired for DML activity. |
|
Lock - Locks acquired for table scans |
Number of locks acquired for table scans. |
|
Lock - Locks granted immediately |
Number of locks granted immediately. |
|
Lock - Locks granted that required waiting |
Number of locks granted that required waiting. |
|
Lock - Requests denied due to timeouts |
Number of lock requests denied due to timeouts. |
|
Log - Bytes inserted into the log buffer |
Number of bytes inserted into the log buffer. |
|
Log - Bytes of log read during DB recovery |
Number of log bytes read during database recovery. |
|
Log - Bytes read from log for commits |
Number of bytes read from the log for commit processing. |
|
Log - Earliest log file currently |
Earliest log file that currently exists in the database. |
|
Log - File system reads |
Number of file system reads. |
|
Log - File system reads for commits |
Number of file system reads from the log for commit processing. |
|
Log - File system writes |
Number of file system writes. |
|
Log - Last log file number |
Number of last log file. |
|
Log - Log files generated so far |
Number of log files generated so far. |
|
Log - Log records inserted into the log buffer |
Number of log records inserted into the log buffer. |
|
Log - Most recent log file present |
Most recent log file present. |
|
Log - Times the log is synched to disk |
Number of times the log has been synchronized to disk. |
|
Log - Total waits for inserts |
Number of times a thread was delayed while trying to insert a log record into the log buffer because the log buffer was full. If this value is increasing, it generally indicates that the log buffer is too small. |
|
Memory - Highest amount of permanent region in use - MB |
Highest amount of memory of the permanent data region in use since the first connection to the database. |
|
Memory - Highest amount of temporary region in use - MB |
Highest amount of memory of the temporary data region in use since the first connection to the database. |
|
Memory - MB of permanent space in use |
Size of permanent region currently in use. |
|
Memory - MB of temporary space in use |
Size of temporary region currently in use. |
|
Memory - Percent of permanent space in use |
Percent of the permanent region space currently being used. |
|
Memory - Percent of temporary space in use |
Percent of the temporary region space currently being used. |
|
PL/SQL - Cache hit ratio for object handles |
The cache hit ratio for PL/SQL object handles. |
|
PL/SQL - Cache hit ratio for pin requests |
The cache hit ratio for PIN requests. |
|
PL/SQL - Lock requests for a PL/SQL object |
Number of times a lock was requested for a PL/SQL object. |
|
PL/SQL - Object invalidations due to dependent object changes |
Total number of times objects in the namespace were marked invalid because a dependent object was modified. |
|
PL/SQL - PINs of objects not 1st performed since creation |
Any PIN of an object that is not the first PIN performed since the object handle was created and which requires loading the object from the database. |
|
PL/SQL - Times PL/SQL object's handle found in memory |
Number of times a PL/SQL object's handle was found in memory. |
|
PL/SQL - Times a PIN was requested for PL/SQL objects |
Number of times a PIN was requested for PL/SQL objects. |
|
PL/SQL - Times all metadata of library object found in memory |
Number of times all of the metadata pieces of the library object were found in memory. |
|
PL/SQL - Total heap (MB) for PL/SQL on this database connection |
Total amount of heap memory in megabytes allocated to PL/SQL for the database connection. |
|
PL/SQL - Total times a deferred cleanup occurred |
Number of times a deferred cleanup occurred. |
|
Replication - Last log file number held by replication |
Number of last log file held by replication. |
|
Replication - Transactions replicated from this database |
Number of replicated transactions generated on the local database that are being replicated to at least one peer database. |
|
Statement - ALTER statements executed |
Number of |
|
Statement - Automatic statement reprepares |
Number of automatic statement reprepares. |
|
Statement - CREATE statements executed |
Number of |
|
Statement - Command cache misses during statement prepare |
Number of command cache misses during statement prepare. |
|
Statement - DELETE statements executed |
Number of |
|
Statement - DROP statements executed |
Number of |
|
Statement - INSERT statements executed |
Number of |
|
Statement - MERGE statements executed |
Number of |
|
Statement - SELECT statements executed |
Number of |
|
Statement - Statement prepares |
Number of statement prepares. |
|
Statement - Statement reprepares (forced or automatic) |
Number of statement reprepares including forced and automatic. |
|
Statement - Total SQL statements executed |
Number of SQL statements executed. |
|
Statement - UPDATE statements executed |
Number of |
|
Transaction - Durable replicated transaction commits |
Number of durable replicated transaction commits. |
|
Transaction - Durable transaction commits |
Number of durable transaction commits. |
|
Transaction - Nondurable replicated transaction commits |
Number of nondurable replicated transaction commits. |
|
Transaction - Nondurable transaction commits |
Number of nondurable transaction commits. |
|
Transaction - Replication initiated transaction commits |
Number of replication initiated transaction commits. |
|
Transaction - Transaction rollbacks |
Number of transaction rollbacks. |
|
Transaction - Transactions committed |
Number of durable and non-durable transaction committed. |
|
Transaction - XLA initiated transaction commits |
Number of XLA initiated transaction commits. |
|
Workload - 10th most commonly executed SQL statement |
Tenth most commonly executed SQL statement. |
|
Workload - 2nd most commonly executed SQL statement |
Second most commonly executed SQL statement. |
|
Workload - 2nd most commonly prepared SQL statement |
Second most commonly prepared SQL statement. |
|
Workload - 2nd most commonly reprepared SQL statement |
Second most commonly reprepared SQL statement. |
|
Workload - 3rd most commonly executed SQL statement |
Third most commonly executed SQL statement. |
|
Workload - 3rd most commonly prepared SQL statement |
Third most commonly prepared SQL statement. |
|
Workload - 3rd most commonly reprepared SQL statement |
Third most commonly reprepared SQL statement. |
|
Workload - 4th most commonly executed SQL statement |
Fourth most commonly executed SQL statement. |
|
Workload - 4th most commonly prepared SQL statement |
Fourth most commonly prepared SQL statement. |
|
Workload - 4th most commonly reprepared SQL statement |
Fourth most commonly reprepared SQL statement. |
|
Workload - 5th most commonly executed SQL statement |
Fifth most commonly executed SQL statement. |
|
Workload - 5th most commonly prepared SQL statement |
Fifth most commonly prepared SQL statement. |
|
Workload - 5th most commonly reprepared SQL statement |
Fifth most commonly reprepared SQL statement. |
|
Workload - 6th most commonly executed SQL statement |
Sixth most commonly executed SQL statement. |
|
Workload - 7th most commonly executed SQL statement |
Seventh most commonly executed SQL statement. |
|
Workload - 8th most commonly executed SQL statement |
Eighth most commonly executed SQL statement. |
|
Workload - 9th most commonly executed SQL statement |
Ninth most commonly executed SQL statement. |
|
Workload - Cache hits |
Number of hits inside cache. |
|
Workload - Client/Server connections |
The number of current active client/server connections on the TimesTen database. |
|
Workload - Commands prepared |
Number of commands prepared (compiled). |
|
Workload - Commands reprepared |
Number of commands reprepared. |
|
Workload - Communication with Oracle database for dynamic load |
Number of executes from the Oracle database using dynamic load. |
|
Workload - Cursor opens |
Number of cursor opens. |
|
Workload - Cursors closed |
Number of cursor closed. |
|
Workload - Direct linked connections |
The number of current direct-linked connections on the database. |
|
Workload - Fetches from Oracle database using dynamic load |
Number of fetches from the Oracle database using dynamic load. |
|
Workload - Most commonly executed SQL statement |
Most commonly executed SQL statement. |
|
Workload - Most commonly prepared SQL statement |
Most commonly prepared SQL statement. |
|
Workload - Most commonly reprepared SQL statement |
Most commonly reprepared SQL statement. |
|
Workload - Passthrough count |
Number of passthrough operations executed. |
|
Workload - System connections |
The sum of the current active subdaemon, replication agent, and cache connect agent connections. |
|
Workload - Total number of connections |
Sum of all current active connections on the TimesTen database. |
Performance rates
Performance rates are expressed as a rate (For example, X times per minute). These rates are considered instantaneous rates because the value is the rate in the last minute or the per-minute rate (if you have changed the most recent collection interval to a value other than one minute).
Table 14-8 shows each metric and describes the metrics.
| Metric | Description |
|---|---|
|
Cache - Rows per batch in PL/SQL mode |
The number of rows sent per batch in PL/SQL mode to the Oracle database. |
|
Cache - Rows per batch in SQL mode |
The number of rows sent per batch in SQL mode to the Oracle database. |
|
Cache - Total AWT MB per sec |
The number of megabytes of AWT transactions sent per second to the Oracle database. |
|
Cache - Transactions committed on Oracle database per sec |
The number of transactions committed per second on the Oracle database. |
|
Cache - Transactions propagated to Oracle database per sec |
The number of transactions propagated per second to the Oracle database. |
|
Cache grid - Cache grid attaches per minute |
The number of cache grid attaches per minute. |
|
Cache grid - Cache grid detaches per minute |
The number of cache grid detaches per minute. |
|
Cache grid - Cache grid global hit percent |
The number of cache grid global hit percent (percent is found in local grid member). |
|
Cache grid - Cache grid global hits per sec |
The number of cache grid global hits per second. |
|
Cache grid - Cache grid global misses per sec |
The number of cache grid global misses per second. |
|
Cache grid - Cache grid local hits per sec |
The number of cache grid local hits per second. |
|
Cache grid - Cache grid local misses per sec |
The number of cache grid local misses per second. |
|
Cache grid - Cache grid misses filled from Oracle database per sec |
The number of cache grid misses filled from the Oracle database per second. |
|
Client/Server - ALTER statements executed by server per sec |
The number of |
|
Client/Server - Bytes received by server per sec |
The number of client/server bytes received per second by the TimesTen server. |
|
Client/Server - Bytes transmitted by server per sec |
The number of client/server bytes transmitted per second by the TimesTen server. |
|
Client/Server - CREATE statements executed by server per sec |
The number of |
|
Client/Server - DELETE statements executed by server per sec |
The number of |
|
Client/Server - DROP statements executed by server per sec |
The number of |
|
Client/Server - INSERT statements executed by server per sec |
The number of |
|
Client/Server - MERGE statements executed by server per sec |
The number of |
|
Client/Server - Round trips per sec |
The number of client/server round-trips per second. |
|
Client/Server - SELECT statements executed by server per sec |
The number of |
|
Client/Server - Table rows deleted by server per sec |
The number of table rows deleted per second by the TimesTen server. |
|
Client/Server - Table rows inserted by server per sec |
The number of table rows inserted per second by the TimesTen server. |
|
Client/Server - Table rows updated by server per sec |
The number of table rows updated per second by the TimesTen server. |
|
Client/Server - Transaction rollbacks by server per sec |
The number of transaction rollbacks per second by the TimesTen server. |
|
Client/Server - Transactions committed by server per sec |
The number of transactions committed per second by the TimesTen server. |
|
Client/Server - UPDATE statements executed by server per sec |
The number of |
|
DB - Table rows deleted per minute |
The number of table rows deleted per minute in the TimesTen database. |
|
DB - Table rows inserted per minute |
The number of table rows inserted per minute in the TimesTen database. |
|
DB - Table rows read per minute |
The number of table rows read per minute in the TimesTen database. |
|
DB - Table rows updated per minute |
The number of table rows updated per minute in the TimesTen database. |
|
Lock - Deadlocks per minute |
The number of deadlocks per minute. |
|
Lock - Immediate lock grants per minute |
The number of nonblocking locks acquired per minute. |
|
Lock - Lock grants after wait per minute |
The number of blocking locks acquired per minute. |
|
Lock - Lock timeouts per minute |
The number of lock timeouts per minute. |
|
Lock - Percent locks granted immediately |
The percent of locks granted immediately versus having to wait. |
|
Log - Log buffer MB inserted per sec |
The number of megabytes inserted into the log buffer per second. |
|
Log - Log buffer waits per minute |
The number of times per minute a thread had to wait because the log buffer was full. |
|
Log - Log bytes to disk per minute in MB |
The number of megabytes of log that was written to disk per minute. |
|
Log - Log flushes to file system per minute |
Number of times per minute the log buffer was written to the file system. |
|
Log - Log reads from file system per minute |
The number of times per minute a log read could not be satisfied from the in memory buffer. |
|
Prepares per minute to executes per minute ratio |
The ratio of the prepares per minutes to executes per minute. |
|
Replication - Transactions replicated per minute |
The number of transactions replicated to a peer per minute. |
|
Statement - DELETE statements executed per sec |
The number of |
|
Statement - INSERT statements executed per sec |
The number of |
|
Statement - MERGE statements executed per sec |
The number of |
|
Statement - SELECT statements executed per sec |
The number of |
|
Statement - Total statements executed per sec |
The total number of statements executed per second. |
|
Statement - UPDATE statements executed per sec |
The number of |
|
Transaction - Transaction rollbacks per sec |
The number of transactions rolled back per second. |
|
Transaction - Transactions committed per sec |
The number of transactions committed per second. |
|
Transaction - Transactions durably committed per sec |
The number of durable transactions committed per minute. |
|
Workload - Commands prepared per minute |
The number of SQL commands prepared (compiled) per minute. |
|
Workload - Commands reprepared per minute |
The number of SQL commands reprepared (recompiled) per minute. |
|
Workload - Connects per minute |
The number of connections to the database per minute. |
|
Workload - Disconnects per minute |
The number of disconnects from the database per minute. |
|
Workload - Queries per sec |
The number of queries per second. |
Readonly cache
Table 14-10 shows readonly cache metrics and describes the metrics.
| Metric | Description |
|---|---|
|
Auto refresh status |
The status of the autorefresh operation. |
|
Cache group ID |
The identifier of the cache group. |
|
Cache group name |
The name cache group. |
|
Cache group owner |
The owner of the cache group. |
|
Object Identifiers |
The object identifier of the table on the Oracle database. |
|
Refresh Interval |
The refresh interval for the cache group. |
|
Refresh Time Spent(ms) |
The total time spent performing refresh operations. |
|
Rows autorefreshed |
The number of rows that have been autorefreshed. |
|
Start Time |
The timestamp of when the last autorefresh was performed. |
|
Updates pending refresh |
The number of updates that are pending refresh. |
Replication peers
Table 14-10 shows replication peers metrics and describes the metrics.
| Metric | Description |
|---|---|
|
Replication peer host name |
Name of the system that hosts replication. |
|
Replication peer name |
If replication type is DNS, name of the database to be queried. If replication type is PEERS, name of the database that is a replication peer to this database. |
|
Replication port number |
TCP/IP port used by the replication agent to listen for connections from the transmitter threads of remote replication agents. The default is 0 indicating that this port has been assigned automatically to the replication agent, rather than being specified as part of a replication scheme. |
|
Replication protocol |
Protocol used by replication to communicate between peers. |
|
Replication state |
Current replication state of the replication peer in relation to the queried database. |
|
Type |
The replication type. |
Replication status
Table 14-11 shows replication status information.
Table 14-11 Replication Status
| Name | Description |
|---|---|
|
Replication peer name |
The replication peer name. |
|
Replication thread type |
The replication thread type. Valid values are Transmitter or Receiver. |
|
Start or restart count |
Start or restart count. |
|
Transactions sent or received |
The total number of transactions sent or received. |
|
Transactions sent or received per sec |
The number of transactions sent or received per second. |
Replication subscribers
Table 14-12 shows replication subscriber information.
Table 14-12 Replication Subscribers
| Name | Description |
|---|---|
|
Average latency time (in seconds) |
The average latency time in seconds between when the master sends a message and when it receives the final acknowledgment from the subscriber. |
|
Last message received |
Time in seconds since this subscriber received the last message from the master. |
|
Last message sent |
Time in seconds since the master sent the last message to the subscriber. This includes the "heartbeat" messages sent between the databases. |
|
Replication host name |
Name of the system that hosts the subscriber. |
|
Replication peer name |
Name of the subscriber database. |
|
Replication port number |
TCP/IP port used by the subscriber agent to receive updates from the master. A value of 0 indicates that replication has automatically assigned the port. |
|
Replication protocol |
Protocol used by replication to communicate between master and subscribers. |
|
Replication state |
Current replication state of the subscriber peer in relation to the queried database. |
|
Replication track |
Replication track. |
|
Txn log files held by the master database for a subscriber |
Number of transaction log files the master database is retaining for a subscriber. |
Replication tracks
Table 14-15 shows replication tracks information.
Table 14-13 Replication Tracks
| Name | Description |
|---|---|
|
Receiver batch commit counts |
The total number of batch commits on the receiver. |
|
Receiver batch commit time |
The total time of batch commits on the receiver. |
|
Receiver txn commit counts |
The total number of commits on the receiver. |
|
Receiver txn commit waits |
The total number of commits waits on the receiver. |
|
Subscriber |
The subscriber database. |
|
Track |
The track number. |
|
Transmitter log waits |
The log waits from the transmitter. |
Replication state
Table 14-11 shows replication state information.
Response
Table 14-15 shows response information.
SQL command cache
Table 14-16 describes information in the SQL command cache.
| Name | Description |
|---|---|
|
Command ID |
The SQL command identifier. |
|
Executions which took place on this command |
The number of executions that took place on this command since it was brought into the command cache. |
|
Fetch executions done internally for this statement |
The number of fetch executions that were done internally for this statement. |
|
Indicates if command can be garbage collected |
Indicates whether this command can be garbage collected by the subdaemon. If 0, it is non-freeable. If 1, it is freeable. |
|
Last measured execution time of the command |
The last measured execution time for this SQL command. |
|
Maximum execute time in seconds of this statement |
The maximum execution time in seconds for this SQL command. |
|
Minimum execute time in seconds |
The minimum execution time in seconds for this SQL command. |
|
Reprepares or invalidations of this command |
A counter for the number of reprepares or invalidations of this command. |
|
SQL for the current command |
The full SQL text for the current command. |
|
Space(bytes) allocated for this command in the command cache |
The total space in bytes allocated for this command in the command cache. |
|
Time when the statement started |
The time of when the last execution of the SQL statement started. |
|
Unique ID of a private connection |
Unique identifier of a private connection. |
|
User prepares which result in a hit on the command cache |
A counter for the number of user prepares that result in a hit in the command cache. |
|
User who created this command |
The identifier of the user who created this command. |
SQL execution time histogram
Table 14-18 shows SQL execution time histogram information.
Table 14-17 SQL Execution Time Histogram
| Name | Description |
|---|---|
|
Accumulated wall clock execution time(sec) when sampling |
The accumulated wall clock execution time when sampling in seconds. |
|
Execution Time(sec) upper bound for the bucket |
The execution time upper bound limit for this bucket in seconds. |
|
Execution time samples since database start or statistics reset |
The number of execution time samples that have been taking since the database has started or since statistics were reset. |
|
SQL command count in this bucket |
The SQL command count in this bucket. |
Transaction log holds
Table 14-18 shows transaction log holds information.
Table 14-18 Transaction Log Holds
| Name | Description |
|---|---|
|
Object for which the hold was created |
The type specific object for which the hold was created. |
|
Transaction log file number of the hold |
The transaction log file number of the hold. |
|
Transaction log file offset of the hold |
The transaction log file offset of the hold. |
|
Type of hold |
The type of hold. |
Viewing TimesTen instance metrics
There are two groups of TimesTen instance metrics:
Figure 14-4 TimesTen Instance All Metrics
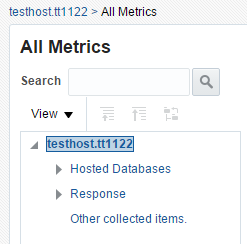
Description of ''Figure 14-4 TimesTen Instance All Metrics''
Some metrics have predefined warning and critical thresholds. You can modify and add new thresholds. The Oracle Enterprise Manager Cloud Control issues alerts and warnings when the values collected for the metrics surpass the set threshold.
Hosted databases
Table 14-18 shows hosted databases information.
| Name | Description |
|---|---|
|
Cache agent |
This value can be either Up or Down. If you have not configured a cache group, then this value is Down. |
|
Client server connections |
The number of client/server connections to the database. |
|
Database path name |
The value is taken from the last part of the path to the database. For example, if the path to the database is |
|
PL/SQL |
This value can be either Enables or Disabled. Once PL/SQL support is enabled in a database, you cannot disable it later. |
|
Ram status |
This value can be either Loaded or Not loaded. The RAM status is Loaded if the database is loaded into memory. |
|
Replication agent |
This value can be either Up or Down. If you have not configured a replication scheme, then this value is Down. |
|
Total connections |
The total number of direct linked and client/server connections to the database. |
Response
Table 14-18 shows response information.