15 Viewing Target Topology
This chapter describes the TimesTen topology page. The topology page provides a visual layout of the relationships between Enterprise Manager targets and performance information about your targets.
Topics include:
Viewing the topology page
To view the topology page, ensure that you are on the TimesTen target page. For information on navigating to the TimesTen target page, see "Navigating to the TimesTen target page".
Depending on the type of target there are two ways of accessing the topology page:
-
For a TimesTen instance target:
From the TimesTen Instance Home menu, select Configuration, then select Topology.
-
For a TimesTen database target:
From the TimesTen Database Home menu, select Configuration, then select Topology.
Changing the view of the topology page
The topology page provides a visual layout of the relationships between Enterprise Manager targets and performance information about your targets.
To change the view of the topology page:
-
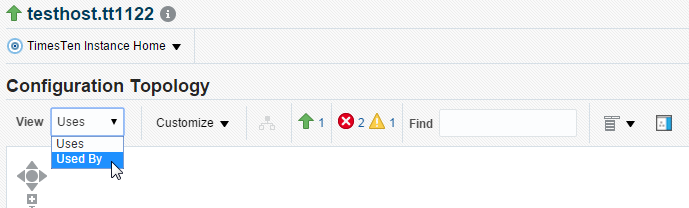
From the View drop-down list, select a view type:
-
Uses
This view helps you determine the targets that the selected target depends on. If a target is having problems, this view can be useful in helping you determine whether its problems have been caused by another target it depends on. This is the default view.
-
Used by
This view shows you the targets that depend on the selected target. This can be useful, for example, to view a certain TimesTen metric for the TimesTen databases that are associated with a specific TimesTen instance.
The topology page refreshes with your selected view type.
Adding monitoring metrics
The topology page enables you to view monitoring metrics for your Enterprise Manager targets on a single page. For example, you can monitor the PermSize and TempSize attributes of all of the TimesTen databases that are associated with your TimesTen instance.
To add monitoring metrics to the targets displayed on the topology page, ensure that you are on the topology page for your TimesTen target.
-
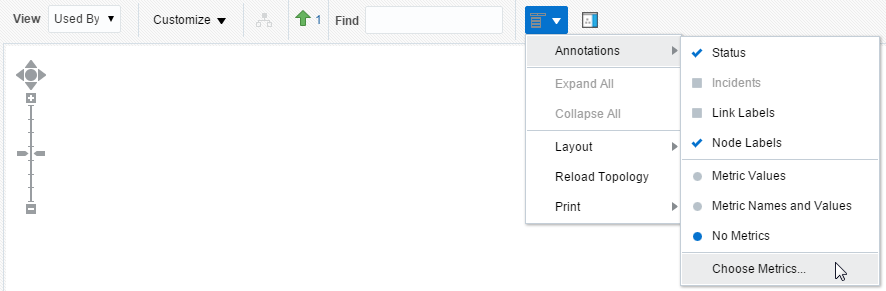
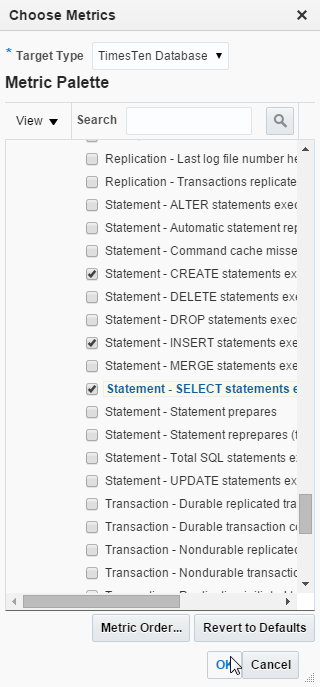
From the Options menu, select Annotations, then select Choose Metrics.
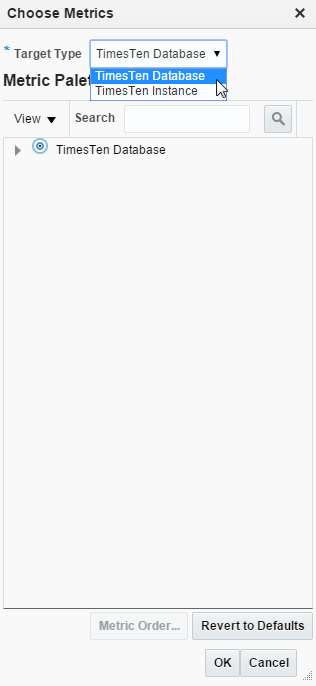
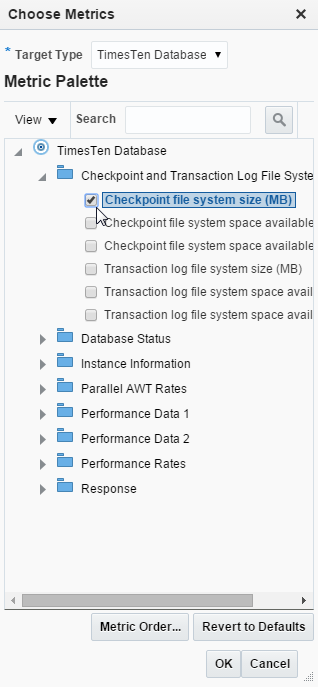
The Choose Metrics dialog displays. Locate the * Target Type drop-down list.
-
From the * Target Type drop-down list, select a target type:
-
TimesTen Database
This target type lets you choose metrics that are specific for TimesTen database targets. For more information on TimesTen database metrics, see "Viewing TimesTen database metrics".
-
TimesTen Instance
This target type lets you choose metrics that are specific for TimesTen instance targets. For more information on TimesTen instance metrics, see "Viewing TimesTen instance metrics".
Locate the name of the metric group.
-
-
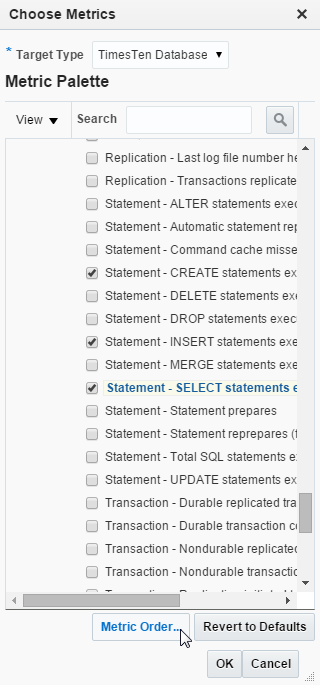
Expand the metric group, and click the name of the metric.
Repeat this step until you add all of the metrics that you want to monitor. Locate the Metric Order button.
-
Click Metric Order.
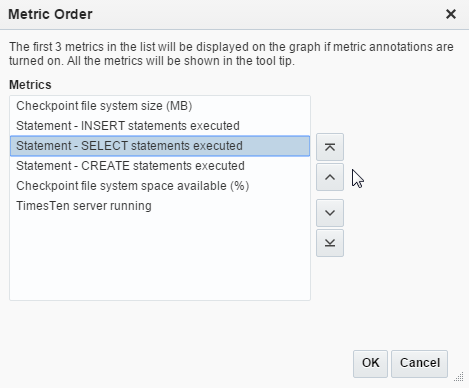
The Metric Order dialog displays. The first three metrics in the list are displayed for each of your Enterprise Manager target on the topology page. Additional metrics are displayed in the tooltip of the Enterprise Manager target.
-
Organize the metrics with the arrows that are on the right of the metric list.
Locate the OK button.
-
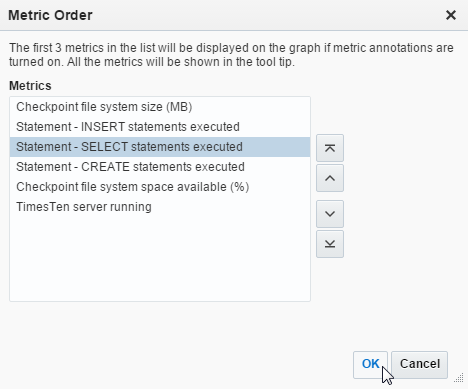
Click OK.
The Metric Order dialog closes. Locate the OK button in the Choose Metrics dialog.
-
Click OK.
The Choose Metrics dialog closes. Locate the Options button on the topology page.
-
From the Options menu, select Annotations, then select Metric Names and Values.
Figure 15-9 Select Metric Names and Values
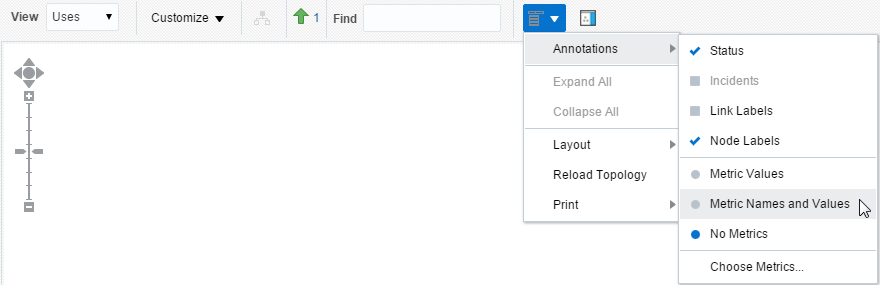
Description of ''Figure 15-9 Select Metric Names and Values''
The Topology page refreshes.
Your targets now show the top three metrics that you configured. Hover over a target and click the more link in the popup to see all of your configured metrics for a specific target.