2 Analysis Reports
Table 2-1 Analysis Report Components
| Analysis Report Component | Example | |
|---|---|---|
|
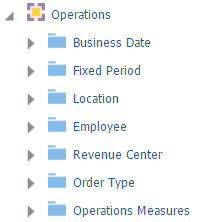
Subject areas represent an area of business data that end users can view in the analysis report, and consist of folders, measure columns, attribute columns, hierarchical columns, and hierarchy levels. |
The Operations subject area contains data for operations totals and counts, such as sales, guests, labor cost, cost of goods, and checks. |
|
|
Folders provide a named grouping of columns. |
The Operations subject area contains six folders for attribute columns and one folder for measure columns, with a clear name for the folder containing measure columns. |
|
|
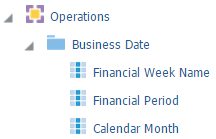
Attribute columns hold a flat list of values with no hierarchical relationships, and provide scope and constraints to the data presented by a report. The folders containing attribute columns unique to the selected subject area typically contain Definitions in their names. |
The Business Date folder contains attribute columns such as financial period and calendar month. |
|
|
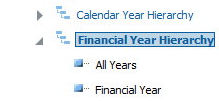
Hierarchical columns hold data values that are organized using named levels and parent-child relationships. Hierarchical columns allow users to drill down into the data, and their folder name typically contains Hierarchy. |
The Business Date folder contains the Calendar Year Hierarchy column, which can drill down into the All Years, Calendar Year, Calendar Month, and Business Date Detail columns. |
|
|
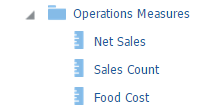
Measure columns hold a list of data values that typically reside in the Business Intelligence repository as a fact table, which can change or be added or aggregated. The folders containing measure columns typically contain Measures in their names. |
The Operations subject area contains the Operations Measures folder, which contains measure columns such as Net Sales, Sales Count, and Number of Checks. |
|
You can select the operational subject area, or business model, that applies to the report or visualization you want to view or create, and then you can apply business analytics by:
-
Selecting specific data sets to use in the report, and then applying filters to each data set.
-
Selecting and configuring the resulting appearance of data, such as by rearranging columns and rows in the table, inserting visualizations and charts, and changing column labels.
-
Adding and configuring user prompts to allow users viewing the report to configure data filters as needed. For example, you can add a date selection prompt to allow users to set the range of dates for which they need the report.
Oracle Fusion Middleware Oracle Business Intelligence online Help opens if you access online Help when creating or editing analysis reports or when working with dashboards. The Oracle Business Intelligence online Help may describe functionality not available in Reporting and Analytics.
- Analysis Report Examples
- Report Walkthrough: Revenue and Cost Comparisons
- Running, Printing, and Exporting Analysis Reports
- Creating Analysis Reports
- Managing Analysis Reports
- Analysis Report Permissions
- File Permissions and Publishing
- Configuring Analysis Report Permissions
- Publishing an Analysis Report
- Analysis Report Date Session Variables


