35.7 PDU Test Connection and Metric Collection Error Troubleshooting
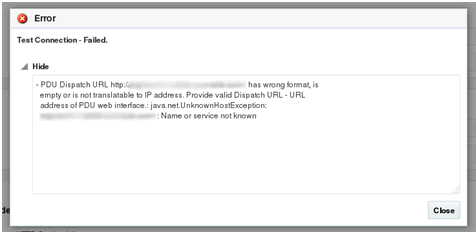
Collection of some PDU metric or test connection might fail. In that case, PDU test connection fails with an error message. This section explains how to troubleshoot such conditions.
35.7.1 Test Connection Error Identification
If a test connection fails, a message with a problem description is displayed. See the PDU Error States and Resolution table for possible PDU error states and their resolution and try to fix the problem source as described in the table and repeat the test connection.
35.7.2 Metric Collection Error Identification
If collection of some metric fails, a metric collection error event is raised for the PDU.
Note:
Incidents are not generated from metric collection errors by default. You can turn on incidents generation under Setup > Incidents > Incident Rules.
Search for the rule Group metric collection error events for a target and enable it.
Perform the following steps to identify and view and view all metric collection errors of PDU:
-
Go to Target Menu at the left top corner of the PDU landing page, click Systems Infrastructure PDU.
-
Click Monitoring, then click All Metrics.
-
In the Overview section, click on the number in Metric Collection Errors.
-
Select and click a metric collection error to view more details. A detailed error description is displayed.
See the PDU Error States and Resolution table for possible PDU error states and their resolution, try to fix the problem source as described in the Table 35-2. Repeat evaluation for every failed metric.
35.7.3 Metric Recollection
If you have evaluated all failed metrics, repeat the metric collection.
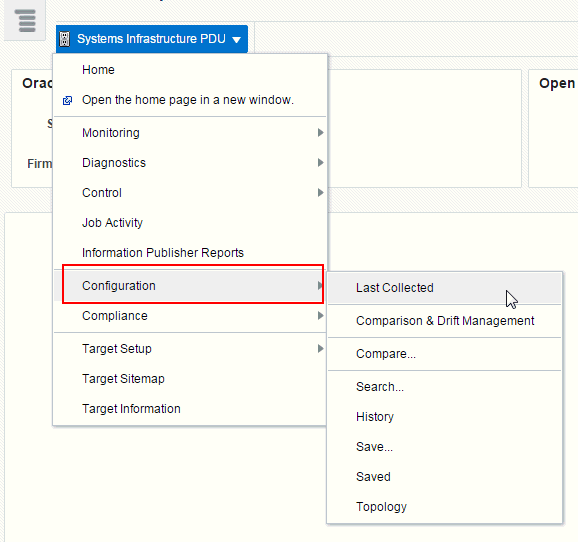
- Go to Target Menu at the left top corner of the PDU landing page, click Configuration, then click Last Collected.
- In the Latest Configuration screen, click the Refresh button.
When metrics are collected again and all reasons of collection errors are resolved, the incident disappears from Incidents Manager, dashlet, and Photorealistic view.
If the failed metric is displayed with the word Status, it is a performance metric which cannot be refreshed. You have to wait for the next scheduled metric recollection. In a default configuration, PDU performance metrics are recollected every 15 minutes.
Note:
Metric recollection interval can be changed by user in Enterprise Manager in Target Menu, submenu Metrics, item Metric and Collection Settings.

