38.4 Viewing the Oracle SuperCluster System
The Oracle SuperCluster landing page provides information about the system and aggregated information about the targets it contains. The page is divided into two parts. The top region consists of dashlets which provide you the general overview of the system.
The first dashlet is the Summary dashlet. It displays the summary of the system, that is, total number of most important target types (racks, switches, servers, Exadata cells), amount of available memory, and number CPU cores.
The second dashlet displays the number of open incidents grouped by severity. Oracle SuperCluster collects incidents from all associated targets. You can get more details about incidents by clicking on the numbers in the dashlet. The details are displayed in a table with information such as Target, Summary, Last Updated, Acknowledged, and Status. You can click on a target to view more information of the particular target or click on the summary to view the details of the incident.
The third dashlet displays the time of the last configuration change and last reported incident.
The main page consists of one tab that displays the physical view of Oracle SuperCluster. Click on any target to view important information and to open the target's landing page. You can also switch to a different rack or M-series server by selecting it in the left menu (available only if there is more than one rack or M-series server in the system.)
38.4.1 Physical View of Oracle SuperCluster
Physical view of the Oracle SuperCluster system provides an overview of how the Oracle SuperCluster system is physically structured in the rack.If there is more than one rack or M-series server in the system, you can select a target from the selector available on the left side to view its detailed physical layout. (The selector is hidden if only one rack or server is present). You can click any target or component to get more information about it.If there are any incidents on a target, that particular target is highlighted by a red border to indicate it needs attention. Click on the target to view incidents grouped by severity. You can then click the severity to open the incident manager where you can further interact with the incident.
You can switch between several representations of the physical view.
-
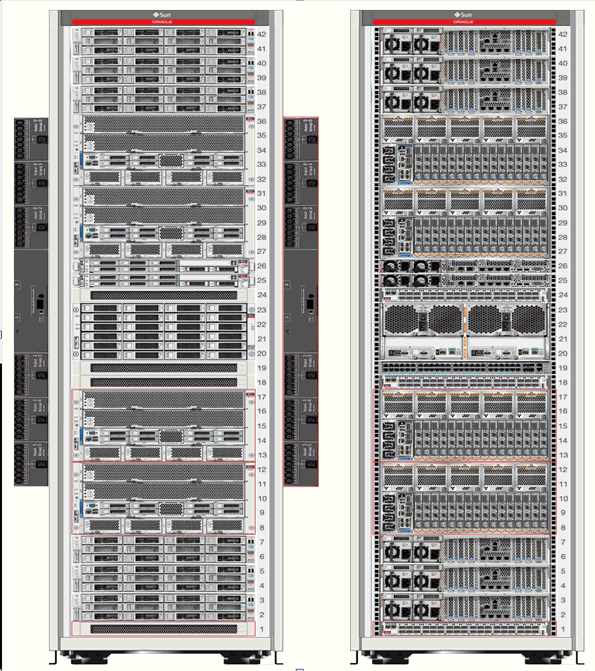
Photorealistic view provides a realistic picture of the system, providing detailed graphics of all the components.
-
Schematic view is data oriented and displays the most important information such as locator light, status, temperature, host name. Each component in the view has its color based on the type for easy identification of the component.
-
Table view is a tabular representation of the physical view, providing a list of displayed components with the most important information.
Figure 38-3 displays the front and rear views of the Oracle SuperCluster system.
Figure 38-3 Oracle SuperCluster Rack View

Description of "Figure 38-3 Oracle SuperCluster Rack View"
38.4.2 Virtualization Management on the Oracle SuperCluster System
For Oracle Supercluster virtualization management, the Enterprise Manager Agent has to be deployed to each of the virtualization platforms that is planned to be managed.
To monitor Oracle VM Server for SPARC, deploy the EM Agent for Host targets to the Control Domain Operating System. This agent monitors all the Oracle VM Server for SPARC resources as well as the Solaris zones configured on the Control Domain. After the Enterprise manager Agent is deployed on the guest domain operating system, Solaris zones configured in guest domains are monitored. You can install EM Agents into Control Domain and Oracle Solaris Zones using Add Host Targets wizard.