1 Overview of the Mediation Engine Connector User Interface
This chapter provides an overview of the Oracle Communications Session Monitor Mediation Engine Connector (Mediation Engine Connector) user interface.
Logging In to Mediation Engine Connector
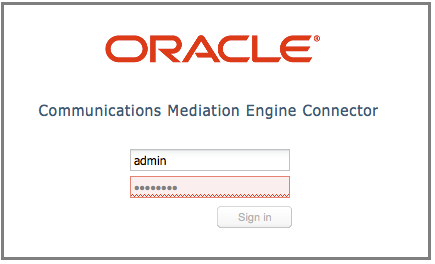
You must first install an instance of Mediation Engine Connector (MEC), connect it to your network, and access the user interface using a Web browser. See the referenced sections when changing settings for additional details.
Note:
The Web interface requires a browser with JavaScript enabled. Additionally, allowing "HTTP cookie" is recommended for several of the features.Point the browser to the configured IP address of the management interface to load the login screen (see Figure 1-1). Log into the pre-configured account with user name admin and password oracle.
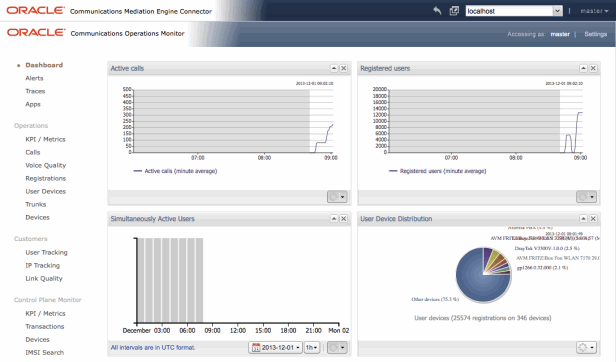
About Mediation Engine Connector Dashboard
After you log in, you should see the MEC dashboard. In the top-right corner, a drop down menu displays the current user and contains links to the Mediation Engines window, the HTML version of this manual (opens in a new browser window), and the option to logout.
Figure 1-2 shows the MEC dashboard.
Figure 1-2 Mediation Engine Connector Dashboard
Description of ''Figure 1-2 Mediation Engine Connector Dashboard''
The Mediation Engine Connector (MEC) dashboard is similar to the dashboard of the Mediation Engines. It allows you to view at a glance important information retrieved from single probes, as well as information aggregated from all Mediation Engines. The dashboard contains a configurable number of panels, which can be added or removed by the user. The following functionality is available for the MEC dashboard.
Adding a Dashboard Panel
To add a dashboard panel:
-
Right-click on the dashboard.
A context menu appears.
-
Select Add a panel...
A wizard appears in a new window, which guides you through the creation of the new dashboard panel.
Removing a Dashboard Panel
To remove a dashboard panel:
-
Click the cross button in the upper-right corner of the panel.
A dialog box appears.
-
Click Yes.
Rearranging Dashboard Panels
Dashboard panels can be rearranged using drag and drop. Drag a dashboard panel by clicking and holding the title bar and drop it where you would like it to stay on the page.
Enabling Dashboard Panel Refresh
The information in a dashboard panel refreshes only when it is active in a dashboard tab. Panels refresh only when they are visible to the user in an active browser window. You can change this behavior to enable panels to continue to refresh when they are not displayed in an active browser window.
Note:
Enabling panel refresh can cause decreased system performance.To enable dashboard panels to refresh:
-
Select the menu title that displays your user name.
-
Click My Profile.
The Edit own user information menu appears.
-
From the Widgets Refresh list, select refresh options that you would like to enable.
-
Click Finish.
About Dashboard Panels
This section describe only panels containing aggregated information. Panels containing Mediation Engine-related information are the same as the panels for the dashboard of the Mediation Engine.
The MEC dashboard can have the following types of panels:
-
Panels containing aggregated information
-
Panels containing information retrieved from a single Mediation Engine
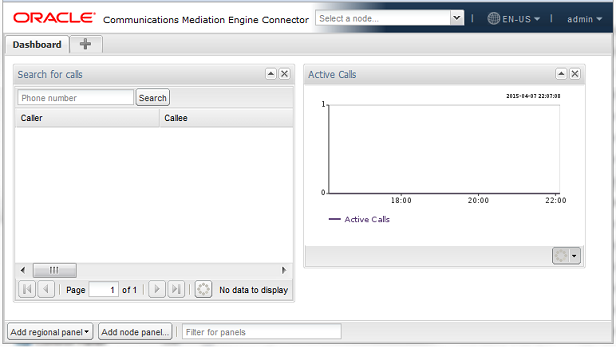
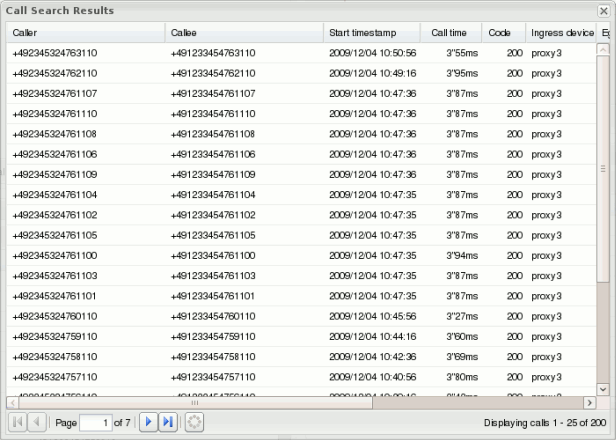
Call Search Panel
The Call Search panel allows you to specify the search criteria and display matching unique calls on all probes simultaneously.
Figure 1-3 shows the Call Search panel.
The Call Search panel provides the following functionality:
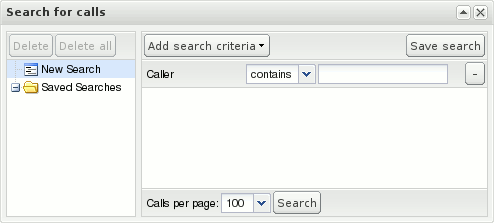
Enter search criteria: To enter the search criteria, click Add search criteria button and select the field for which you want to enter a search criterion. A new row appears in the center-right area of the Call Search panel. You can enter a comparison operator and a comparison value for the criterion in this row.
Execute a search: Click Search to execute the active search. The Call Search Results page appears.
Save search and retrieve saved searches: You can save a search by clicking Save Search. A new node appears in the tree to the left of the panel, under the Saved Searches folder. To give a name to the saved search, click the tree node for the search and enter a name. To retrieve a previously saved search, click select a node from under the Saved Searches folder. You can also delete a saved search by selecting its node and clicking Delete. Clicking Delete all deletes all saved searches. Note, that saved searches will be gone, once you reload the page or logout from the MEC and login again.
Call Search Results page: The Call Search Results page appears after you execute a search and displays unique calls matching the search criteria found on all Mediation Engines.
Figure 1-4 shows an example call search results.
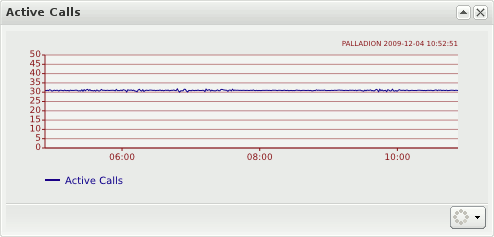
Active Calls Counter Panel
The Active Calls counter panel displays a chart which is computed based on values aggregated from all Mediation Engines. Currently the active calls counter is available. It is the only option present in the dashboard add panel wizard, when you choose Display a counter.
Figure 1-5 shows the Active Calls counter panel.
About Mediation Engine Selection and View
Mediation Engine selection refers to the controls in the header bar of the MEC user interface. These controls allow you to select a Mediation Engine to display in the Mediation Engine view.
Figure 1-6 shows the Mediation Engine selection drop-down list.

Select the Mediation Engine you want to view from the drop-down list and the Mediation Engine view for this Mediation Engine is displayed. The Mediation Engine view is displayed in an iframe inside the MEC user interface. You are automatically logged in with the user name that you used to log into the MEC.
Figure 1-7 shows the Mediation Engine view page.
You can also display the Mediation Engine view in its own window by clicking Open in new window button.