| Oracle® Retail Category Management User Guide for the RPAS Fusion Client Release 14.1.1 E62413-01 |
|

 Previous |
 Next |
| Oracle® Retail Category Management User Guide for the RPAS Fusion Client Release 14.1.1 E62413-01 |
|
Previous |
Next |
This appendix provides additional information on the following topics:
Information contained in this section is based on the following book:
AC Neilsen, Heller, A., Karolefski, J. (2005) Consumer-Centric Category Management. Hoboken, NJ: John Wiley & Sons.
Category Planning provides the ability to drive out and confirm roles, strategies, and tactics for the categories being planned. Generally speaking, this is done during the annual line review process and incorporates upstream financial plans.
Category Planning enables retailers to take action based on a broad variety of data, which can include market data, panel data, demographic and customer segment data, and performance data. The application consolidates this data in an efficient manner and raises up actionable insights each step of the process. It starts with taking both internal and external performance data, as well as upstream retail strategy and financial targets, and provides recommendations related to roles, strategies, and tactics. These can be planned at a national level or regional/cluster level, and can include customer segmentation details as dictated by the business needs.The process starts with a review of both the customer and the competitive landscape, followed by some initial analysis around category performance in relation to the market. The application workflow is presented in Figure A-1.
The process leverages either of two Category Management industry standard methodologies. The first methodology considers market data and the second focuses on the retailer's sales and margin. Roles are set at the category level, or higher if you want.
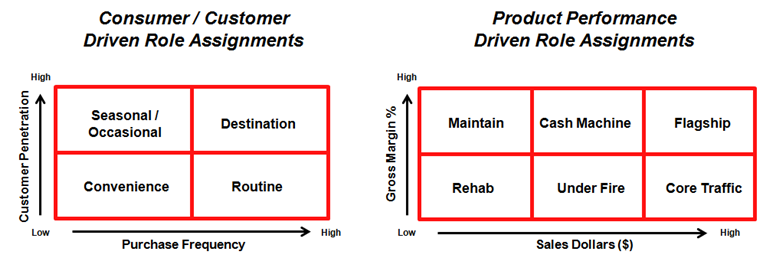
The first approach for role-setting is based on market data, specifically, customer penetration and purchase frequency. Using this approach, category roles are based on total opportunity in the marketplace. Generally speaking, market data is used as part of this model, but retailers may leverage some of their own loyalty data, to better understand how often their customers are purchasing this category as well as how profitable they are.
Item Penetration: Penetration is a measure of item, brand, or category popularity. The number of people who buy a specific category of goods at least once at the retailer is divided by the number of people who buy this category in the market as a whole. This is specifically in a retailer's business context. Alternatively, in a market context, the definition is the number of people who buy a specific category of goods at least once divided by the total number of customers or buyers in the market. Item penetration in a market context measures category acceptance by a defined population and is useful in tracking acceptance of new product categories.
Purchase Frequency: Frequency is defined by the average number of times per year a category is purchased at a retailer. This measurement may be more meaningful for a retailer with a high number of transactions per customer, such as a grocer that the consumer visits every week, than for one with a lower number of transactions per customer, such as an electronics specialty store that the consumer may only visit a few times in a year. Purchase frequency can also be viewed in a market context, where it is defined as the number of times a category is brought on an average per year across the market.
Category performance drives the assignment into the following roles:
Destination: Identified by their high penetration, purchase frequency, and large sales revenue. The objective is to be the primary category provider and help define the retailer as the store of choice by delivering consistent value and superior target consumer value.
Example Destination categories: Bread, Milk
Routine: Lower penetration, high purchase frequency, and medium sales revenue. The objective is to be one of the preferred category providers and help develop the retailer as the store of choice by delivering consistent, competitive target consumer value.
Example Routine categories: Coffee, Orange Juice
Seasonal/Occasional: High penetration, low purchase frequency, and variable sales revenue. The objective is to be a major category provider and help reinforce the retailer as the store of choice by delivering frequent, competitive target consumer value.
Example Seasonal/Occasional categories: Herbs and Spices, Halloween Candy
Convenience: Represented by average to low penetration, purchase frequency, and sales revenue. The goal of such a category is to be a category provider and help reinforce the retailer as the full-service store of choice by delivering good target consumer value.
Example Convenience categories: Greeting Cards, Pet Food
The second role-setting approach is based on the retailer's own sales/performance data, specifically, Sales Revenue and Margin %. This approach assigns category roles based on how productive the category is. The six roles assigned using this model are Flagship, Cash Machine, Maintain, Core Traffic, Under Fire, and Rehab, as depicted in Figure A-2. The options for each role are as follows:
Flagship categories are identified by high sales and high gross margin. The objective of such categories is to increase sales and maintain margin, or maintain sales and increase margin. The retailer may create new sub-categories, emphasize more profitable SKUs, increase service levels, and so on.
Cash Machine categories are represented by high sales and medium gross margin. The objective is to increase sales and maintain profits, or maintain sales and increase profits. Some approaches the retailer may take would be to increase assortments, prune less profitable SKUs, and introduce private label.
Maintain categories are identified by low sales and high gross margin. The goal is to maintain sales and profits, or increase sales and maintain profits. The retailer can consider promoting profitably, emphasizing high-profit SKUs, and increasing the assortment in growing categories/sub-categories.
Core Traffic categories are represented by high sales and low gross margin. The target is to decrease sales and increase profits, or maintain sales and profits. The retailer may aggressively promote SKUs as a loss leader, create private label in high and low quality tiers, and match competition.
Under Fire categories have medium sales and low gross margin. The objective is to decrease sales and increase profits, or maintain sales and increase profits. The retailer may drop a number of sub-categories and/or SKUs and retain the more profitable ones.
Rehab is characterized by low sales and low gross margin. The goal is to decrease sales and increase profits. The retailer may drop a number of sub-categories and/or SKUs and retain only the most profitable ones.
Category Management automatically provides a suggested role for each category based on the market and historical data. It considers the range of the retailer's values for Penetration/Frequency (for Industry Model A) and Sales/Margin (for Industry Model B). It compares each category to the overall minimum and maximum values, and then assigns that category a role based on its relationship to the range of values. For example, a category with high purchase frequency and low item penetration relative to the other categories will be assigned a Routine role for Industry Model A. That same category may have high gross margin and low sales revenue relative to the other categories, and would be assigned a Maintain role for Industry Model B.
Both approaches are widely used; however some retailers may use them as a baseline, and then make adjustments to ensure the model is most meaningful to them. These system-recommended role assignments can be overridden.
After assigning category roles, the next step is to review available performance data to determine and assign a particular strategy to support the category roles. Strategies are set at the sub-category level, or higher if you want. The strategies and their characteristics are listed in Table A-1.
Table A-1 Category Strategies and their Characteristics
| Category Strategies | Characteristics | Purchase Dynamics | Measures and View | Example |
|---|---|---|---|---|
|
Traffic Building |
Attracting customers to the store, aisle, and category |
High share, frequently purchased, high percent of sales |
WP Sales contribute to Market Sales by Consumer Seg R, Purchase Frequency, WP Sales by Consumer Seg R and Fc Sales R in Identify Traffic Builders view |
Whole coffee as a traffic building sub-category for a retailer (Retailer A) with a grocery retail chain specializing in hot beverages like tea and coffee to cater the original taste from tea/coffee gardens. This serves as a unique selling proposition to the target consumer segments such as gourmet shoppers, who are looking for authentic whole coffee beans of different varieties. |
|
Transaction Building |
Enlarging the size of the average purchase |
Higher ring-up, impulse purchase |
Purchase Frequency and Transaction Size with Category in Identify Transaction Builders view |
Ground coffee as a transaction building sub-category for Retailer A, catering to the consumer segments, such as value seekers, who are looking for authentic coffee but have little free time. |
|
Profit Generating |
Yielding profits |
Higher gross margin, higher turns |
Measures: WP Gross Profit by Consumer Seg R in Identify Profit Generators view |
Whole coffee with many private label SKUs and direct sourcing from coffee estates, as a profit generating sub-category with higher margins for a a retailer with a hypermarket chain (Retail-er B), which presents a limited range of merchandise in coffee in relation to a speciality retailer like Retailer A. |
|
Cash Generating |
Producing cash flow |
Higher turns, frequently purchased |
Measures: WP Turn, Purchase Frequency and WP Sales by Consumer Seg U in Identify Cash Generators view |
Instant coffee as a cash-generating sub-category for a supermarket retailer with staple food as the main attraction to customers, with coffee playing the role of a convenience category. |
|
Excitement Generating |
Generating interest and enthusiasm among consumers |
Impulse, life-style oriented, seasonal |
LY Sales by Consumer Seg R, Fc Sales R and WP Sales by Consumer Seg R in Identify Excitement Generators view |
Single serve coffee as excitement-generating sub-category in a hypermarket retail chain (Retailer B) in a market where the working population is relatively important target consumer segment. |
|
Image Enhancing |
Strengthening the view of the retailer held by the consumer |
Frequently purchased, highly promoted, impulse, unique items, seasonal |
Purchase Frequency, WP Sales by Consumer Seg R, WP Promo Sales contrib to Sales by Consumer Seg R and Fc Sales R in Identify Image Enhancers view |
Instant coffee as a image enhancing sub-category for the speciality retailer, Retailer A, so as to have a complete range of SKUs in coffee product category to serve the need of wide spectrum of customers looking for variety in coffee. |
|
Turf Defending |
Positioning the category strongly versus competitors |
Used by retailers to draw traditional customer base |
WP Turn, Purchase Frequency & WP Sales by Consumer Seg U in Identify Turf-Defenders view |
Ground and whole as turf depending sub-categories for retailer (Retailer C) who specializes in coffee and presents a wide variety in its product range. |
|
Note: The assignment of these strategies drives the downstream assortment processes, as they feed to assortment planning. They can be used to set focus area weight values through the user-driven Seed IPI Weights custom menu option found in the Create IPI Assortment step. Each assignment drives the product focus of the Assortment Planner team. For example, a Profit Generating strategy will focus on assorting products that are more profitable, whereas a Cash Generating strategy will focus on assorting products driving the most revenue. |
The final step in this part of the process is the assignment of tactics that lead to strategic yet actionable plans, to meet performance goals. Tactics are set at the sub-category level, or higher. The RCM Category Planning tactics, and the associated settings options, are listed in Table A-2.
Table A-2 Category Planning Tactics
| Tactic | Tactic Settings |
|---|---|
|
Assortment |
Decrease |
|
Pricing |
Be Within X% of Competition |
|
Promotion |
Aggressive Marketing/Offers |
|
Space |
Adjust Shelving/Capacity |
|
Inventory |
Decrease |
The specific tactics to be assigned vary based on what is applicable for that tactic. For example, the options for the Assortment tactic are to Maintain, Increase, or Decrease, while the Pricing tactics relate to how the retailer should price versus the competition.
Once assigned, these tactics (along with the category role and strategy) can be pushed to downstream processes/solutions. For example:
Assortment tactics being pushed and integrated with the Assortment Planning processes.
Pricing tactics being pushed and leveraged in a pricing solution.
Promotional tactics being pushed and leveraged in a promotional planning solution.
Inventory tactics being pushed and leveraged in an allocation and/or replenishment solution.
Space tactics being pushed and leveraged in a space planning solution and MSO task.
Roles, strategies, and tactics are all visible in Assortment Planning and Macro Space Optimization @ Sub-Category. Roles and tactics do not have a direct influence on assortment plan creation; rather, they are provided as a reference to help the Assortment Planning team ensure that the updated assortment is in line with the broader Category Management objectives.
Strategies can have a direct impact on the Assortment Planning process. The strategies have been mapped to the focus area weights and metrics that best align with that category's role. Seeding these weights to the assortment, and then using those weights to create an IPI assortment, ensures that SKUs that have the characteristics that align with that particular strategy are ranked highest so that they can be included in the assortment.
Table A-3 shows which focus area weights and metrics that best align with the different Category Management strategies, as well as some suggested values for each. These can be used to help drive IPI assortments. (Note that market coverage assortments are driven purely by market performance.) Of course, the exact values can vary based on the retailer's or category's specific strategies. To apply the system-recommended focus area weights and metrics, run the Seed IPI Weights custom menu option located in the Create IPI Assortment step.As an example, a Cash Generating strategy is most closely aligned with the Performance focus area and associated metric is Sales Revenue. These weight settings will ensure that all SKUs that produce high sales revenue are ranked high in the recommended assortment. This provides the starting point from which decisions to keep/add/drop SKUs are made to finalize the assortment. Conversely, an Excitement Generating strategy considers both attributes and performance. The SKUs that will be ranked on top of the recommended assortment will be those that have high sales units both overall as well as within the attributes deemed most important. As a third example, a Transaction Building strategy gives the highest rank to those SKUs that appear often in shoppers' market baskets and produce high sales revenue.
Table A-3 Focus Areas and Metrics for Strategies
| Strategy | Weights | Attributes | Loyalty | Market Basket | Performance |
|---|---|---|---|---|---|
|
Traffic Building |
Focus Area Weight |
25% |
NA |
50% |
25% |
|
Metric Weight |
Sales U (100%) |
NA |
Market Basket Index (100%) |
Sales U (100%) |
|
|
Transaction Building |
Focus Area Weight |
NA |
NA |
50% |
50% |
|
Metric Weight |
NA |
NA |
Market Basket Index (100%) |
Sales R (100%) |
|
|
Profit Generating |
Focus Area Weight |
NA |
NA |
NA |
100% |
|
Metric Weight |
NA |
NA |
NA |
Gross Profit R (50%) Gross Profit % (50%) |
|
|
Cash Generating |
Focus Area Weight |
NA |
NA |
NA |
100% |
|
Metric Weight |
NA |
NA |
NA |
Sales R (100%) |
|
|
Excitement Generating |
Focus Area Weight |
50% |
NA |
NA |
50% |
|
Metric Weight |
Sales U (100%) |
NA |
NA |
Sales U (100%) |
|
|
Image Enhancing |
Focus Area Weight |
50% |
50% |
NA |
NA |
|
Metric Weight |
Sales U (25%) Sales R (75%) |
Loyalty Index/Top Shoppers Index (100%) |
NA |
NA |
|
|
Turf Defending |
Focus Area Weight |
NA |
50% |
25% |
25% |
|
Metric Weight |
NA |
Loyalty Index/Top Shoppers Index (100%) |
Market Basket Index for targeted consumer segments (100%) |
Sales U (100%) |
This section outlines the navigation through the RCM application for two real-world business workflows. It contains an overview of the business process, followed by the steps to take through the application.
The following business workflows are described:
Category Reset - Major Line Review, where an entire category is re-assorted, or a new category is introduced.
Continuous Planning - In-season updates to an existing assortment for a category or sub-category. Can include item swaps/updates or vendor updates.
The following features are used to support the workflows:
Clustering
Category Planning
Assortment Planning and Optimization:
Demand Transference
Assortment and Space Optimization
CDT Science
These workflows follow an example using the coffee category, which is in the default data set that is delivered with the base product.
This scenario walks through most of the Category Management processes, starting with clustering and category planning, and then creating an assortment in assortment planning and optionally optimizing that for space in ORASE.
Create store assortment clusters for coffee using the Advanced Clustering solution of ORASE or the retailer's own clustering process:
For a trading area (location hierarchy level below chain in the default dataset)
For a planning period (the period of time being planned for, which is a quarter in the default dataset)
Run Category Planning:
For the same trading area and planning period
Analyze the business, customers, and market in order to help determine the roles, strategies and tactics for the Coffee category. For more information on this functionality, see "Roles, Strategies, and Tactics in Category Planning."
Define the Retail Strategy, which is the big picture view of the shoppers, trading area, and competition to assess the overall business opportunity in the market..
Assign the category role:
Perform a deeper analysis of the market, consumers, and so on at the trading area level.
Assess what type of retailer to be for this category.
Assign a category role. Verify the preassigned role using either Model A (Item Penetration versus Purchase Frequency) or Model B (Sales versus GP).
Assign category strategies:
Analyze the retailer business by trading area/consumer segment/sub-category.
Assign strategies by sub-category/trading area/consumer segment. Strategies drive the focus area and metric weights in IPI based assortment generation in assortment planning.
Assign category tactics:
Analyze the retailer business at the category/sub-category level, trading area, against the market and/or by different time periods to see trends over time.
Assign tactics for different aspects of the business at the trading area/sub-category level.
Create category/sub-category-level plans for sales, profit, inventory, and turn by trading area/quarter:
Plan sales and inventory increase in Private Label business versus LY and flat margin/turn. Plan decrease for the Coffee category business.
Approve category/sub-category plans to share it with Macro Space Optimization and Assortment Planning.
Macro Space Optimization (MSO) helps determine how best to balance space in order to maximize profit, either at the department level or the subcategory/planogram level.
The optimization leverages space elasticity curves that define the expected profit that will be generated for differing amounts of space.
These curves can also be used in reverse to answer the question: "How much space do I need to meet my financial target?" The curves are held as space-profit tables within the system and must be defined before MSO can be used.
Macro Space Optimization Process
Admin setup
Define POG hierarchy; it can be sourced from space planning system.
Import current space information from space planning systems like Macro Space Management system (MSM).
Set up space elasticity curve data.
Map product and POG hierarchies.
Macro Space Optimization at Department level
Review financial targets from MFP and CP.
Set optimization constraints.
Run macro space optimization and review the results.
Approve optimization results, which must be shared with space planning systems like MSM.
Macro Space Optimization at Sub-Category level
Review roles, strategies, and tactics, along with financial targets (from MFP and CP).
Set optimization constraints.
Run macro space optimization and review the results.
Approve optimization results, which are shared with Assortment Planning tasks (MSM).
Macro Space Optimization Workflow
Admin setup
Given POG hierarchy information is setup as part of foundation data, import current space information from MSM. Current space information consists of:
Current store size
Current department sizes
Total available linear space for each department
Current space for each planogram subcategory
Subcategory/POG adjacency information
Set up data space elasticity curve data in Manage MSO Tables at both department and sub-category level.
Map product and POG hierarchies in POG and PROD Hierarchy Mapping at both department and sub-category level.
Macro Space Optimization at Department level
Review financial targets from MFP and CP on product and POG hierarchy in Review Category Scorecard at department level.
Review current space information and set macro space optimization constraints in Setup and Review Optimization @Dept. Following constraints need to be defined:
Lower and upper guard rails for space to be allocated to departments.
Minimum and maximum space values for departments.
Space increments for each department.
Optimization and Target Alignment type. Options available here include Space - less than or equal to, Financial - max profit up, and Financial - max profit down.
Selecting departments that participate in optimization using Include POG department flag measure.
Locking current space for those departments that need to keep their current space intact.
Selecting Mandatory departments.
Run optimization using Optimize Dept custom menu.
Review optimization results in the form of recommended space and gross profit.
Review optimization results in the form of histograms in the form histograms in Review Space and Profit Histograms @ Dept.
Approve optimization results, which need to be shared with MSM and kept as reference in optimization at the sub-category level.
Macro Space Optimization at the Sub-Category level
Based on optimization results at the department level, estimate the linear space available to department that is being optimized.
Review financial targets from MFP and CP on product and POG hierarchy in Review Category Scorecard at sub-category level.
Review current space information and set macro space optimization constraints in Setup and Review Optimization @Sub-Category. The following constraints need to be defined:
Lower and upper guard rails for space to be allocated to departments.
Minimum and maximum space values for sub-categories.
Space increments for each sub-category.
Optimization and Target Alignment type. Options available here include Space - less than or equal to, Financial - max profit up, and Financial - max profit down.
Selecting sub-categories that participate in optimization using Include POG department flag measure.
Optional: Locking current space for those sub-categories that need to keep their current space intact.
Optional: Locking current space for those sub-categories that need to keep their current space intact.
Optional: Selecting Mandatory sub-categories.
Review optimization results in the form of recommended space and gross profit.
Review optimization results in the form of histograms in the form histograms in Review Space and Profit Histograms @ Sub-Category.
Approve optimization results, which are shared with Assortment Planning tasks. These results also must be shared with MSM.
Review various analysis in Assortment Planning at SKU/Cluster or Store level.
View the category scorecard to review the targets from Category Planning (CP), Macro Space Optimization (MSO) and Merchandise Financial Planning (MFP). CP and MFP provide financial targets. MSO provides space and gross profit targets.
In Assortment Planning, develop an assortment for each of the store assortment clusters. Assortments can also be created at the store level.
Develop coffee assortment based on IPI:
System recommends core and optional SKUs:
Strategies and CDTs drive weights
Run Demand Transference and use insights to fine-tune the assortment.
Review updated revenue for the category.
Run Assortment Improvement to better the assortment on assortment-mix, sales and gross profit and further fine-tune it to the set targets.
Review the incremental curve based on IPI ranking to arrive at an optimum assortment range
Export preliminary assortment to ORASE or retailer's own space optimization process.
Before following the step-wise process detailed below, complete the following two actions:
Review performance analysis, market analysis and consumer analysis under Assortment Planning Analysis to get a an understanding of how category's assortment has fared in the past.
Review the targets from CP, MSO and MFP in Review Category Scorecard.
Set up the assortment:
Seed the assortment plan using one of the fo.llowing options: LY, Forecast, MFP targets, or CP targets
Review and plan the assortment plan:
Plan sales U, GM (R or %), and sales R.
Increase sales plan for the brands to focus on. Ensure overall margin plan increases.
Review sales versus forecast and GM versus LY or Category Manager's plan.
Introduce new SKUs for consideration into the assortment by seeding new SKUs based on like items:
Based on retailer like item (replacement for an existing SKU in the assortment or mapped to a similar product introduction from the past year or two).
Map retailer like item.
Check attributes to be sure they are seeded correctly. If not, map like item attributes to an existing SKU.
Create an IPI-based assortment at the cluster level:
Set IPI criteria:
Seed focus area weights that are aligned to category strategy set by the Category Planner. Can be manually entered based on retailer best practice.
Attribute weights can be pre-seeded with CDT science.
Override lower-level attribute value weights to emphasize the brands or other attributes to focus on.
Specify consumer segment weights.
This needs to be set to ensure IPI calculates correctly even if not planning by consumer segment.
Generate and review IPI scores.
Evaluate by brand/attribute. Is there emphasis on SKUs from the brands/ attributes to focus on, and did the new SKUs (with like items) get an appropriate IPI score? For information on setting and assessing IPI scores, see "IPI in Assortment Planning."
Select eligible and mandatory items.
Set thresholds for core and optional assortment using one of the available options in the form of IPI threshold values, SKU Count, or Financial Targets (MFP or CP Target).
Generate the IPI-based assortment recommendation and run Demand Transference.
Review the assortment by different brand and sub-category levels, or by consumer segment, to see the IPI assortment recommendations in different ways:
By brand, sub-category, consumer segment.
Check new SKUs and map them with like items.
Compare SKU count versus LY and ensure poor performers are dropped, yet sub-category/brand targets are still aligned.
Understand the Assortment Plan's alignment to targets:
Review of the IPI Assortment alignment to MFP targets and CP plan (sales, margin, brand penetration).
Cumulative sum of IPI assortment sales.
Understand the impact of Demand Transference on the IPI assortment:
After running the Demand Transference custom menu option on the initial assortment, use DT to decide how to edit the assortment.
Review substitutable demand and lost sales of each SKU in the IPI assortment to understand what SKUs can be most easily dropped from the assortment with minimal impact to category sales and revenue.
What-if by adding/deleting SKUs in the assortment to see the impact to overall profit for the assortment (drop national items, and so on).
Add/override core SKUs based on DT information (substitutable/incremental demand).
Run the DT custom menu option as needed to reassess the assortment as SKUs are added and dropped.
Monitor the impact on Sales U, Sales R, GP Revenue (or GM Revenue), and GP % (or GM) after each DT run to align versus targets or CP plan.
Use the Assortment Improvement functionality to better the assortment using any of the following options:
Improve the assortment on SKU count in lines with space allocated to the category.
Or improve the assortment on sales and gross profit to align with the targets.
Or improve the assortment to the set targets in the form of CP and MFP targets by directly using the optimization to target option. This option is used when there is a marked difference between assortment plan numbers and set targets.
Review the incremental curve based on IPI ranking to assess the assortment range and make corrections using assortment improvement feature as detailed in step 5.
Perform a final comparison against plan targets.
Repeat for other clusters.
Compare the draft assortment across clusters and make adjustments as needed.
Export the draft assortments to ASO for space optimization.
Optimize the assortment plans to available space in ASO and export back optimization recommendations in the form of ASO results consisting of recommended assortment plan and space productivity information.
Import ASO results into RCM.
Compare ASO recommended assortment with the exported assortment and other versions of assortment plan like LY, CP and LP.
Review if the recommended assortment and space productivity information meets the expectations and aligns with the set targets.
Accept ASO results if the recommended assortment plan is in line with the set targets.
Formalize placeholder SKUs in the assortment, if any.
Approve and finalize the cluster-level plan assortment for implementation, which signals ASO to go ahead with the implementation. ASO then sends POG information for the category to space planning systems like MSM.
Optional: Adjust assortment for stores:
Repeat Steps 2 to 5 at the store level for the stores you want.
Review store-level assortments against each other and the cluster.
Follow a similar procedure as at the cluster level to optimize the store level assortments to the available space by exporting assortment plans to ASO, optimizing assortment plans in ASO, importing ASO results into RCM, accepting them, and approving and finalizing them.
Review the approved assortment and assortment plan in the Assortment and CP scorecards.
Continuous planning includes in-season updates to an existing assortment for a category or sub-category. Examples are simple item swaps where an item is updated (examples such as new size, packaging, or new and improved product), or vendor-level line reviews and updates. The majority of Continuous Planning tasks are related to execution and publication of the changes to the store (tasks outside of RCM and Assortment Planning):
If the Continuous Planning involves simple in-season item swaps, it may be easier to manage the process outside of the Assortment Planning tool, rather than making the change to all the assortment planning workbooks, and then cascading those changes through to planograms and then floor-plans.
More extensive Continuous Planning updates will follow the assortment planning workflows as described in the "Category Reset" section.
Additional Continuous Planning activities:
Update Coffee planogram in ASO.
Review the updated planogram in Oracle Retail In-Store Space Collaboration (ISSC).
Retailers have numerous approaches to planning and creating assortments. This section presents a sample of some different areas that a retailer may want to focus on, and provides some high-level considerations to help align the assortments with these areas of emphasis. Retailers may use one or more than one of these areas of emphasis when planning their assortments, so a combination of these assortment planning considerations may be needed.
Description:
Vendor-level performance, space, and profit are key considerations for this retailer. An example of a primary goal in this approach is to understand profit and productivity in the space allocated to a brand/vendor, and assess whether it would be a good business decision to allocate more space to that vendor or just to adjust the assortment within the space already given to that vendor. Cosmetics is an example of a category that many retailers plan with a focus on brand, profit, and space.
Assortment Planning Considerations:
Create an IPI assortment:
Use attribute weights and attribute values to emphasize the brand.
Use performance weights to give importance to items with higher revenue and gross margin.
Select eligible and mandatory items to ensure higher presence of desired brands with higher revenue and gross margin.
Ensure higher presence of desired brands in the eligible items set.
Ensure key brand items are marked as mandatory.
Set core and optional assortment constraints in the form of IPI thresholds.
Description:
Retailers trying to grow or manage a Private Label business consider ways to analyze, set targets for, and emphasize a new or existing private label business. Private Label merchandise is often an area of emphasis at grocery or specialty retailers, but can also apply to any retailer with a robust or growing private label business.
Assortment Planning Considerations:
Review and plan private label sales for the Assortment Plan.
Introduce new private label items into the assortment by seeding new items based on either national brand like items or existing private label like items:
Check seeding of attributes and map them to another item if adjustments are needed.
Create an IPI assortment:
Use attribute weights and attribute values for the private brand.
Optional: Use performance weights for revenue and gross margin.
Select eligible and mandatory items.
Ensure higher presence of private label items in the eligible items set.
Ensure key private label items are marked as mandatory.
Set core and optional assortment constraints in the form of IPI thresholds.
Description:
This area of emphasis aligns with a retailer who prioritizes customer service and loyalty programs, and who wants to do an excellent job of catering to the customer. This retailer's approach to creating assortment plans is focused on loyalty, customers, and consumer segments.
Assortment Planning Considerations:
Define clusters that consider customer segment shopping behavior along with revenue/seasonality and so on.
The Category Planner should set strategies that vary by consumer segment.
When analyzing historical business, use pivots, filters, and/or CDTs to review by consumer segment.
Create an IPI assortment:
Use loyalty weights, varied by consumer segment.
Set higher consumer segment weight to target consumer segments.
Select eligible and mandatory items.
Ensure higher presence of items that are most frequently bought by target con-sumer segments in the eligible items set.
Ensure items with high top shoppers' index are marked as mandatory.
Set core and optional assortment constraints in the form of IPI thresholds.
Create assortments at the cluster level, and then at the store level for key stores.
Description:
Retailers may be very focused on assorting based on the overall market, when there are similar retailers competing for the same share of the wallet of the consumers in a trading area. The retailer emphasizing this area remains competitive with pricing and focuses on the items most important in the market. This is typically seen in large grocery retailers or big box retailers.
Assortment Planning Considerations:
Use the robust market analysis in Category Planning and Assortment Analysis. Note that this assumes that the retailer has third-party market data available.
Create a cluster-level market coverage assortment:
Select eligible or mandatory items.
Ensure higher presence of popular market items in the eligible items set.
Ensure key market items are marked as mandatory
If the user wants to have, for example, 50 percent market coverage to align with their market share targets, the user can specify the category-level constraints based on SKU count or coverage percent.
The user may choose to also constrain the assortment by sub-category, to protect or enhance the assortments at that level, which can also be done by SKU count or coverage percent.
Vary by consumer segment.
Description:
A Curious Retailer wants to know: What does the science tell me? This retailer has an existing assortment, but wants to see if there are ways to use the insight from ORASE to rework the assortment to get an increase in revenue/margin. This approach could be used either by a retailer who already has sophisticated Category Management and/or Assortment Planning processes, or as an evolution in a crawl-walk-run implementation approach where the retailer embraces the science after a year or two of using the more fundamental product functionality.
Assortment Planning Considerations:
Use CDTs to set attribute value weights.
Use strategies to seed focus area weights.
Leverage the Advanced Clustering solution of ORASE to group stores into optimal clusters using attributes such as seasonality, price elasticity, format, and demographics.
Create an IPI-based assortment using IPI thresholds, and then review the assortment plan on the basis of incremental curve and make changes to it using assortment improvement functionality. The objective is to derive an assortment with an optimal assortment range in the available space and arrive at the best product-mix based on advanced science recommendations:
Create an IPI assortment with IPI thresholds as assortment constraints.
Review the incremental curve for the IPI assortment to arrive at an appropriate assortment range (number of SKUs).
Use add/remove/swap options in assortment improvement to derive a product-mix in lines with the assortment range suggested by the incremental curve. This would take into consideration all SKUs that are eligible to be part of the assortment.
Use optimization to target option in assortment improvement in conjunction with add/remove/swap options to arrive at an assortment plan, which is in line with the set targets.
RCM's Item Priority Index (IPI) is used to create assortments using multiple inputs including performance, attributes, market basket, and loyalty information. All of the business factors deemed important by the user are pulled together into an index for each SKU. The SKUs can then be ranked using this index. This system-recommended assortment generation method provides a smart starting point for the Assortment Planner to then tailor the assortments by cluster and/or by store. Item rankings are a very common assortment planning approach used by retailers.
The IPI score can be calculated at the cluster and/or store level to tailor the assortment.
The following user settings drive a system-recommended IPI assortment:
Focus Area Weights (Performance, Attributes, Market Basket, Loyalty)
Drive the product mix by identifying what characteristics to emphasize in the assortment. These can be pre-seeded based on the Category Planner's assigned Strategy. For more information see "Applying Roles, Strategies, and Tactics in Assortment Planning and Macro Space Optimization."
IPI Assortment Constraints (SKU Count, IPI Scores, MFP Target, CP Target) determine the number of core and optional items for the assortment.
The following are required to calculate an IPI score and create an IPI assortment:
An approved category plan with roles, strategies, and tactics assigned to categories and sub-categories. The approved category plan is available in the Review Assortment Scorecard step. Strategy assignment to categories is used to populate the weights used for IPI calculations.
If strategies are not available, the weights can be entered manually.
Assortment Plan targets to be used as the working plan, which includes cluster-level sales and gross profit targets. This target is created as part of the Assortment Planning process flow in the Assortment Setup step.
To create an assortment based on IPI:
Determine what is important for the assortment being planned, which drives which type of weights should be set.
Select Assortment Planning @ Cluster, Assortment Setup, and then Set IPI Weights.
Set the Focus Area Weights. These can be pre-populated using the strategy set by the Category Manager, or entered manually:
If the weights are to be pre-populated based on the category's strategy, run the Seed IPI Weights custom menu option to import the weights settings. This is the most common approach.
If entering the weights manually, assess what needs to be emphasized within the assortment as part of the business process, prior to creating the IPI assortment. For guidance on weight-setting to align with retailer strategies, see "Applying Roles, Strategies, and Tactics in Assortment Planning and Macro Space Optimization."
To set the weights manually or adjust the weights:
If weighting by performance:
Set the Performance focus area weight.
Set the metric weights for the Performance focus area attributes.
Example:
Goal: Prioritize the items with the highest sales revenue in the IPI assortment.
Settings: Performance Focus Area Weight = 100% (chooses performance as the way to prioritize items in the assortment) and Sales R Metric Weight = 100% set for the Performance attribute (chooses to weight the SKUs based on their sales revenue).
If weighting by attributes:
Set the attribute focus area weight.
Set the metric weights for the attribute focus area attribute.
Specify which attributes should get additional emphasis (set attribute weights) and then which of those attributes get the emphasis (set attribute value weights).
Note that some retailers will import the attribute name weights from ORASE's CDT Science, which will emphasize the most important attributes based on historical performance. No action is required; this import happens in the back-end.
Example:
Goal: Ensure two brands' organic coffees are emphasized in the recommended assortment, while also considering SKUs with high sales units.
Settings: Attribute Focus Area Weight = 100% (chooses attributes as the way to prioritize items in the assortment), Sales U Metric Weight = 100% for the attribute (chooses to weight the SKUs using their sales units). Then, add emphasis to the Brand and Manufacturing Process Attribute Name Weights (pick which attributes to emphasize). Finally, select the important Brands and Manufacturing Processes to emphasize, and by how much, under Attribute Value Weights.
If weighting by loyalty:
Set the Loyalty focus area weight.
Set metric weights for the Loyalty focus area attributes.
Example:
Goal: Prioritize the items that the most loyal shoppers spend their money on. This weight leverages the retailer's Loyalty index.
Settings: Loyalty Focus Area Weight = 100% (chooses Loyalty as the way to prioritize items in the assortment), and Loyalty Metric Weight = 100% set for the Loyalty attribute (chooses to weight the SKUs using their Loyalty Index values).
If weighting by market basket:
Set the Market Basket focus area weight.
Set the metric weights for the Market Basket focus area attributes.
Example:
Goal: Prioritize the items that most frequently make it into shopper's baskets. This weight leverages the retailer's Market Basket index.
Settings: Market Basket Focus Area Weight = 100% (chooses Market Basket as the way to prioritize items in the assortment), and Market Basket Metric Weight = 100% set for the Market Basket attribute (chooses to weight the SKUs using their Market Basket Index values).
A combination of these focus area weights and metric weights can be used, and they can be set at different levels/locations, in order to further tailor the assortment to align with the retailer's category strategies.
Set the consumer segment weight.
Run the Calc Cluster IPI Score custom menu option.
Review the IPI Scores in Assortment Setup:
The IPI score for an average item and for the aggregate level (typically category level) is around 1.00. This may deviate somewhat from a value of 1.00 if the attributes focus area weights are used.
Any item with an IPI score over 1.00 is one that is better than average. Any item with an IPI score below 1.00 is worse than average.
Items that best fit the selected Focus Area weights will have the highest IPI scores; alternatively, items with the worst fit to the selected Focus Area weights will have the lowest IPI scores.
Adjust the weights if adjustments are needed, and recalculate.
Select eligible SKUs to be part of the assortment and mandatory SKUs for the assortment in Assortment Setup, Set Assortment Constraints.
Set assortment constraints in Assortment Setup. These constraints are the boundaries for the set of SKUs that will become part of the core and optional assortments. There are several different ways to constrain the IPI assortment.
SKU Count - Number of SKUs that can fit into the space allotted for this category (set at category level).
IPI Threshold - Cut-off point for the IPI score for SKUs to be included in the assortment. These can be set at the category and/or sub-category level.
Targets - The targets from Category Planning and MFP can be used to constrain the assortment plan. When using this constraint, the Target Alignment drives the decision to go over, under or closest to the target, and to specify a percentage of the target for Optional SKUs. This is set at the Category level.
Specify whether or not to apply Demand Transference, using the IPI Apply DT measure on Set IPI Constraints. If creating the assortment for the first time, the reference assortment, specified using the IPI DT K/A/D measure, should be set to WP/LY. If there is already a CP assortment, then either WP/CP or WP/LY can be used. Applying demand transference in assortment creation updates overall sales and margin of the assortment based on shift in sales between similar SKUs for each SKU addition in the process of meeting set assortment constraints. This facilitates creation of demand transference adjusted draft assortment plans. See "Demand Transference in Assortment Planning" for details on this functionality.
Run the Create IPI Assortment custom menu option.
View the IPI assortment in the Review IPI Assortment Recommendation view under the Manage IPI Assortment step.
To create store-specific assortments, these steps can be repeated in the Assortment Planning @ Store task. Seeding or entering weights at the cluster level will also apply those weights to the stores within the cluster, which can then be overridden.
While it is not critical to the assortment planning process to understand how IPI is calculated, it may be useful to understand the underlying calculations. It comes from a straight-forward Combined Index to Average calculation that is widely used and is not specific to the RCM solution.
Example 1 shows Sales R of 10 items. To get the IPI scores, each item's sales are divided into the average sales for all items. The items are then assigned a rank based on their IPI score.
IPI Score Calculation = Item X / Average of all Items
Example: Item A's Sales (85,000) divided by the Average Sales of all Items (73,100) = 1.16
Example 2 takes things one step further, and blends two different weights to create a blended IPI score. To step through the example, an IPI score is calculated for the Sales R (Step 1), the same as was done in Example 1. Step 2 is to perform the same calculation using Margin R, now shown for the same 10 items. The third and final step is to blend those weights. The Sales R IPI score is multiplied by the weight assigned to it (50%) and the Margin R IPI score is also multiplied by the weight assigned to it (50%). These values are then added together to come up with the final blended IPI score, and then the rank is derived based on this IPI score.
Step 1 - Calculate Sales IPI score
IPI Score Calculation = Item X / Average of all Items
Example: Item A's Sales (85,000) divided by the Average Sales of all Items (73,100) = 1.16
Step 2 - Calculate Margin IPI score
IPI Score Calculation = Item X / Average of all Items
Example: Item A's Margin (18,700) divided by the Average Margin of all items (16,759) = 1.12
Step 3 - Calculate Blended IPI Score (50% Sales and 50% Margin)
Blended IPI Score Calculation = (Item X's IPI 1 * Weight 1) + (Item X's IPI 2 * Weight 2)
Example: (Item A's Sales IPI (1.16) * .5) + (Item A's Margin IPI (1.12) * .5) = (.58) + (.56) = 1.14
The process gets more complex as more weights are used, and also when varying weights by location and/or consumer segment, but the concepts and underlying calculations are still the same as these examples.
Constraints are used to define the boundaries of the recommended assortment after the SKUs' IPI scores and ranks have been calculated.
Before setting IPI assortment specific constraints, define eligible and mandatory items. Marking an item as eligible qualifies it to participate in the assortment generation process while marking an item as mandatory ensures that is part of all system recommended assortments.
IPI assortment constraints can then be defined using one of the following options:
IPI Score Thresholds: SKUs whose IPI scores are above the constraint value will be included in the assortment; SKUs whose IPI scores are below the constraint value will not be included.
To assess appropriate values for the Core and Optional constraint cutoffs, rank the SKUs by their IPI score. The IPI Rank value that equates to the number of desired SKUs can be used to determine the IPI cutoff values for the thresholds. The constraints can be set at the category level, sub-category level, or both.
SKU Count: The number of core and (core + optional) SKUs required in an assortment can be set as constraints at the category level.
Targets: Financial targets from Merchandise Financial Planning (MFP) and Category Planning (CP) can be used as well.
In addition, while constraining the IPI assortment using targets, the number of items required as optional items in the assortment can be defined as a percentage of the target parameter's (MFP or CP) sales retail value.
Eligible and mandatory items are set in Select Eligible and Mandatory Items View under Set Assortment Constraints tab. IPI assortment constraints are set in Set IPI Constraints view under the same tab.
|
Note: Core items are those that must be included in the assortment. Optional items are those that can be included in the assortment if there is space and/or budget to include them. Mandatory items must be included in the assortment, regardless of their IPI score. An Eligible flag is available in Market Coverage-driven assortments, that is used to define the items to be considered in the assortment. |
To generate an IPI-driven assortment after calculating IPI scores, set the IPI assortment constraints in the form of IPI thresholds, SKU count, or targets. In Set IPI Constraints view, check the Create IPI Assortment box and run the Create IPI Assortment @ Cluster custom menu option. RCM produces a recommended assortment, which can be overridden.
Example 3 shows a simple example of constraining the items using their final, blended IPI score. Only the core constraint is set in this example; optional constraints could be applied as well. The Core Cutoff value was arrived at based on the need for seven items in the assortment, and selecting a score that correlated to the score of the item ranked seventh. While the desired IPI score is 1.00, the Core Cutoff Index is set to .99 to account for rounding. Note that the items have been resorted, based on their final ranks and IPI scores, to better illustrate applying the assortment constraints.
WP IPI Core Cutoff Index - 0.99
The previous example illustrates using IPI thresholds to create an IPI assortment. Note that, as shown in the following figure, assortment constraints can be defined using SKU count and targets option as well.
At the category level, the IPI score should be equal to 1.00 (or close to that if attribute weights are used). If it is not, here are some things to look for in the settings for weights:
Be sure weights add up to 100%. Look at all of the different weights and aggregation levels - measure, location, product, consumer segment.
Exception: Attribute name weights and attribute value weights will average to 1.0 (they are expressed as a number rather than a percent).
Be sure that the consumer segment weights are set, regardless of which focus area weights are being used.
If using the Attribute focus area weight, confirm that metric weights are set for the Attribute focus area attribute. Additional weights need to be set when considering attributes, in order to specify which attributes should get additional emphasis and then which of those attributes get the emphasis. This would be done using the attribute name weights and attribute value weights, both of which need to be non-zero.
If using the Loyalty focus area weight, confirm that metric weights are set for the Loyalty focus area attribute.
If using the Market Basket focus area weight, confirm that metric weights are set for the Market Basket Focus Area attribute.
If using the Performance focus area weight, confirm that metric weights are set for the Performance focus area attribute.
After creating an assortment using IPI, Market Coverage, or Incremental Curve, Demand Transference (DT) provides visibility that can be used to improve sales and margin within the assortment.
Demand Transference looks at the substitutability and uniqueness of the SKUs in the assortment in relationship to each other. It can be used to assess if there are more sales and/or margin that could be gained by swapping items in or out of the assortment.
Demand Transference is used in two ways in RCM:
Assortment Generation. Demand Transference can be applied at the time of assortment generation while constraining it to set financial targets, SKU count or IPI thresholds. Demand Transference is applied to the assortment with every addition of SKU to meet the set assortment targets.
Assortment range review using an Incremental Curve. An incremental curve based on demand transference science depicts the point at which cumulative incremental sales flatten out for an assortment, resulting in very marginal increase in assortment sales with addition of new SKUs to it. This helps in deciding upon an optimum assortment range for the category.
Performing Assortment What Ifs. Demand Transference is used to fine-tune an assortment, which has been generated by any of the available methods, in order to maximize sales and/or margin. Within the context of the current assortment, it breaks down each item's demand into that which is Incremental and that which is Substitutable.
Assortment Improvement. Assortment Improvement feature is also referred to as Assortment Optimization and is based on the concept of demand transference. It's an attempt to automate application of demand transference to the assortment and increasing its scope to include all eligible SKUs in improving the assortment. It can be used to improve the assortment on SKU count, sales, gross profit and to align the assortment to set targets from Category Planning (CP) and Merchandise Financial Planning (MFP). Refer to the section Improve IPI Assortment Tab under Manage IPI Assortment Step in Chapter 8 for more details.
Substitutability and Incrementality are the two main concepts within Demand Transference:
Substitutable demand can be transferred to another SKU (or several SKUs). If the SKU is removed from the assortment, its Substitutable demand is transferred to other SKUs in the assortment and not lost.
Incremental, or unique, demand is specific to a SKU in the assortment. If that SKU is removed from the assortment, the Incremental demand is lost.
The foundational information to run Demand Transference (which produces Substitutability and Incrementality) comes from Oracle Retail Advanced Science Engine (ORASE), which uses historical data to assess the similarity of the SKUs. Similarity, as the name implies, is used to quantify how similar a SKU is to other SKUs. Demand Transference uses the similarity values when calculating the substitutability and incrementality of each item in the assortment.
After running Demand Transference, which considers the context of the current assortment, the overall assortment demand will update to account for the impact that the items in the assortment have on each other, and each item's demand is broken out into its Substitutable and Incremental demand. The values for the Substitutable and Incremental demand inform the user about which items could be good candidates to drop from the assortment, or keep in the assortment. Demand Transference can also be used to assess the financial impact of swapping SKUs in and out of the assortment (what if analysis).
Following are the benefits of Demand Transference in Category Management:
Provides insight into the uniqueness of a SKU's demand.
Used to derive a system-recommended assortment based on Incremental Curve.
Provides optimal fine-tuning of assortments to get the right mix of merchandise.
Provides an insight into whether the assortment is over-assorted (too many similar SKUs), under-assorted (too few SKUs), or has the right number of SKUs.
Assists with adherence to merchandise buying budgets and space constraints.
Aids the assortment planning decision-making process and facilitates the best trade-off decisions.
Assists the Assortment Planner with the challenging decision of whether or not to keep a SKU or a set of SKUs in the assortment.
The following diagrams present a simple example of using the insight provided by Demand Transference, Substitutable Demand, and Incremental Demand to make assortment decisions.
The Assortment Planner has created an assortment containing 17 items, and needs to drop three items from the assortment based on available space. Each bar in the chart in Figure A-17 represents an item that made it into an IPI assortment. The height of the bar represents planned sales. Without the benefit of understanding the Substitutable and Incremental demand of the items, the user would only be able to consider the planned sales. In this example, the user is likely to drop the items with the lowest planned sales, which are items 15, 16, and 17.
However, with the insight of Demand Transference, the Assortment Planner can take a more scientific approach to editing the assortment. The next step is to not just look at the planned sales of the items in the assortment, but at how much of that demand is substitutable or will be retained in the overall assortment if an item is dropped, and how much of the demand is incremental or unique to an item. Consider Figure A-18. While the total planned sales of item 2 are very high, the majority of those sales are substitutable, or would be transferred to other items in the assortment if item 2 is dropped. Only a small portion of item 2's sales are incremental, or unique to that item. Similarly, items 13 and 14 also have very high substitutable sales relative to their total planned sales. Those items' incremental sales are the lowest ones in the overall assortment.
In Figure A-19, the assortment is resorted based on incremental sales. The assortment planner has now decided that the three items with the lowest incremental sales, items 2, 14, and 13, are the best ones to drop from the assortment.
After dropping the items, the assortment planner reruns Demand Transference, which will transfer the substitutable sales to the similar substitutable SKUs that remain in the assortment.
Demand Transference can be applied in Category Management when creating an assortment or after creating an assortment. Demand Transference is used to fine-tune the assortment. It facilitates decision-making when it comes to deciding upon the items to be added or dropped from the assortment. Demand Transference calculations are dynamic; they are derived by considering the assortment context.
These prerequisites are required before Demand Transference can be applied to an assortment:
Admin:
Set DT SKU CutOff %, found in the Category Management Administration task/Assign DT SKU CutOff step.
Set the consumer segment distribution, found in the Category Management Administration task/Consumer Segment Setup step.
Other consideration: The Science parameters from ORASE should be configured and loaded into Category Management. This is typically done during initial product implementation.
User:
The WP plan needs to be seeded in the Assortment Setup step.
An LY, LP, or CP assortment should be in place, which is used as a reference assortment for Keep, Add, and Drop decisions.
At least of the following system-recommended assortments:
IPI-based assortment
Market Coverage based assortment
Incremental Curve based assortment
Store IPI assortment
Manually created assortment
This section provides an overview of how to apply and use demand transference in assortment planning. The measure names will vary depending on which assortment creation method was used (IPI versus Market Coverage). The measure names listed in the following steps are generic and do not include the assortment creation descriptions.
Option 1: Apply DT During Assortment Creation
Specify whether or not to apply Demand Transference, using the Apply DT measure in Set Constraints.
If creating the assortment for the first time, the reference assortment, specified using the DT K/A/D measure, should be set to WP/LY. If there is already a CP assortment, then either WP/CP or WP/LY can be used.
Run the custom menu to create the assortment.
Option 2: Apply DT After Assortment Creation
Select a reference assortment using the picklist in the DT K/A/D Input measure, which is used to derive Keep/Add/Drop decisions in demand transference calculations.
Run the appropriate custom menu option to apply Demand Transference to the working plan assortment.
Review DT Results
Review the updated measures, DT affected sales and gross profit, against the respective baseline measures to understand the DT impact. Key measures:
Asst Compare to LY or CP - see which items are Keep/Add/Drop.
Assort Sales/Margin versus DT Assort Sales/Margin - Compare the original assortment to the assortment where DT has been applied. The DT measures account for the sales gained/lost due to similar/dissimilar items in the assortment.
To make Keep/Drop decisions:
Review the Substitutable Demand measures to understand what portion of the demand would get transferred to other items in the assortment.
Review the Incremental Demand (Non-Substitutable Demand) measures to understand what demand will be lost if dropping the item from the assortment (this is the measure to represent the item's unique/ incremental demand).
Add/ Drop items by checking/ un-checking the boxes in the WP Core and WPOptn measures. Run the DT custom menu option as needed to reassess the assortment as items are added and dropped:
To check the transfer of substitutable demand to substitute SKUs in the assortment, in the DT Details view, use Product (LHS Hierarchy)to view the dropped SKU. The RHS Product SKUs that have values in the Demand Received measures are the recipient SKUs.
Monitor the impact on sales and gross profit measures after each DT run to evaluate DT impact and the assortment plan's alignment with the targets.
Incremental Curve (IC), based on cumulative incremental sales, is used to derive product assortments by looking for that point on the curve where the incremental sales are no longer increasing. It identifies the point at which new SKUs brought into the assortment start impacting the sales of existing SKUs in the assortment, because of their similarity, which results in an insignificant increase in overall sales of the assortment for each SKU added.
Incremental Curve is presented in a graph, which maps Cumulative Incremental Sales Units for all items in the assortment and corresponding revenue. The first bar, on the far left of the curve, represents the Incremental Sales Units for the first SKU in the assortment. The second bar, just to the right of the first, represents the Cumulative Incremental Sales Units for the first and second SKUs in the assortment. The third bar represents the Cumulative Incremental Sales Units of SKUs 1, 2 and 3, and so on. The SKUs in an incremental curve are ordered on the basis of IPI ranking for IPI assortments and market ranks (market sales based rank) for market coverage based assortments.
The following prerequisites are required for reviewing an assortment using the Incremental Curve method:
Admin:
Set Consumer Segment Distribution, found in the Category Management Administration task/Consumer Segment Setup step.
Other considerations: The Science parameters from ORASE should be configured and loaded into Category Management. This is typically done during initial product implementation.
User:
An IPI assortment or a Market Coverage assortment should be available.
An LY assortment should be in place, which is used as a reference assortment for Keep, Add, and Drop comparisons while calculating cumulative incremental sales.
Assortment plans can be reviewed using Incremental Curves. Incremental Curves facilitate ascertaining an optimum assortment range on the basis of cumulative incremental sales for the assortment and item ranking (IPI rank or Market ranks):
For IPI assortments, see Manage IPI Assortment - IPI Ordered Incremental Curve.
For Market Coverage assortments, see Manage Market Coverage Assortment - Market Coverage Ordered Incremental Curve Incremental Curves are most easily viewed in a graph.
This glossary is application-centric, in that it defines terms used in this document and measures found in the RCM application that are not previously referenced. Table A-4 provides definitions of the terms and measures.
Table A-4 Demand Transference Glossary
| Measure/Term | Definition |
|---|---|
|
Baseline Demand |
Baseline Demand is represented by the assortment sales and profit, before making any changes to the assortment or applying Demand Transference. The measures showing the baseline demand are: XYZ Assort Sales U/R and XYZ Assort Gross Profit R/% (XYZ equals IPI, Market Coverage, or IC). See the glossary entry: Updated Demand (DT) |
|
Demand |
Demand is the amount that customers want to buy over a period of time. It is not constrained by real-world factors such as availability of inventory. It is typically expressed in units and/or revenue. |
|
Demand Received (Demand Sales Received) |
Refers to the total units of a SKU that would get transferred to its substitute SKUs, if the SKU were dropped from the assortment. Demand Received shows total Demand Transferred to substitute SKUs, identifies the substitute SKUs after a SKU is dropped, and shows how much of the Demand is received by each substitute SKU. |
|
Demand Transference |
Refers to the concept of demand getting transferred when SKUs are added to or dropped from the assortment, to other SKUs in the assortment. The calculations, which are done in sales units in RCM, are always based on the assortment of which a SKU is a part. If the assortment changes, the Demand Transference values also change. The measures that reflect the assortment after Demand Transference has been applied are preceded with the letters DT. DT Assort Sales U and DT Assort Sales R measures reflect the updated total demand after Demand Transference has been applied. |
|
Demand Transferred % |
Highlights the percentage of a SKU's Demand that would transfer to other SKUs within the assortment if that SKU was dropped. This measure shows Substitutable Demand of the SKU expressed as a percentage. Demand Transferred % = Substitutable Demand U/DT Assort Sales U |
|
DT SKU Cut-Off % |
Administrative measure. This threshold value is defined as a percentage of Substitutable Demand, and is used to calculate the No. of Significant Substitute SKUs. It can be used to remove SKUs with very low Substitutable Demand from the No. of Significant Substitute SKUs measure's count. The default value is 100%. |
|
Incremental Demand (Incremental Demand Sales U/R) |
Refers to the unique demand which a SKU brings to an assortment. When dropping the SKU from the assortment, the Incremental Demand reflects the irreplaceable amount of the Demand that does not get transferred to other SKUs in the assortment. In other words, Incremental Demand is the lost demand component of the overall demand. For example, the Assortment Planner needs to drop one ground decaffeinated coffee SKU from the assortment. The SKU from Brand X has a lower Incremental Demand (30%) than the one from Brand Y (75%), so that is a good candidate to drop. If dropped, 30% of the item from Brand X's demand is lost when that SKU is removed from the assortment. The demand measures are linked to each other as follows: Total Demand = Substitutable Demand + Incremental Demand. See the glossary entry: Substitutable Demand (Substitutable Demand Sales U/R) |
|
Keep/ Add/ Drop |
Application terminology used to indicate assortment changes done by the Assortment Planner. In the RCM application, assortment changes are done by checking or unchecking the Core and Optional SKU Flag measure. RCM will compare the updated assortment to a reference assortment (LY/LP/CP assortment) to come out with the Keep, Add, and Drop values. |
|
No. of Significant Substitute SKUs |
Substitutable Demand gets absorbed by similar SKUs in the assortment, when a SKU is dropped. This measure refers to the count of other SKUs which can absorb the Substitutable Demand when the SKU is dropped. |
|
Reference Assortment |
Provides an option to the user to decide the assortment with which the comparison should be done to calculate Keep, Add, or Drop values. A reference assortment is required when running Demand Transference or creating an Incremental Curve assortment. The reference assortment is chosen in the measures labeled XYZ K/A/D Input (XYZ equals IPI, Market Coverage, or IC). |
|
Substitutable Demand (Substitutable Demand Sales U/R) |
Refers to the replaceable portion of demand of a SKU if it is dropped from the assortment. The Substitutable Demand gets transferred to other similar SKUs in the assortment. The associated measures can be used to assess whether or not a SKU should be dropped from the assortment. A SKU with a high Substitutable Demand (as a percentage to total Demand, or in relation to other SKUs in the assortment) is a likely candidate to drop should a SKU need to be dropped from the assortment, since the majority of that Demand will go to other SKUs in the assortment. Conversely, a SKU with low Substitutable Demand (as a percentage to total Demand, or in relation to other SKUs in the assortment) is a good candidate to retain in the assortment. For example, the Assortment Planner needs to drop one ground decaffeinated coffee SKU from the assortment. The SKU from Brand X has a higher Substitutable Demand (70%) than the one from Brand Y (25%), so that is a good candidate to drop. When dropping that SKU, the Substitutable Demand amount of its Demand will be transferred to other similar SKUs that remain in the assortment. The demand measures are linked to each other as follows: Total Demand = Substitutable Demand + Incremental Demand |
|
Updated Demand (DT) |
Updated Demand measures are labeled with the letters DT, and are used to understand the impact of DT after it has been applied. After performing assortment adds and drops, run the DT custom menu option to show the Updated Demand. The measures showing the Updated Demand are: XYZ DT, Assort Sales U/R, and XYZ DT Gross Profit R/% (XYZ equals IPI, Market Coverage, or IC). The demand measures are linked to each other as follows: Total Demand = Substitutable Demand + Incremental Demand See the glossary entry: Baseline Demand |