Debugging a Project
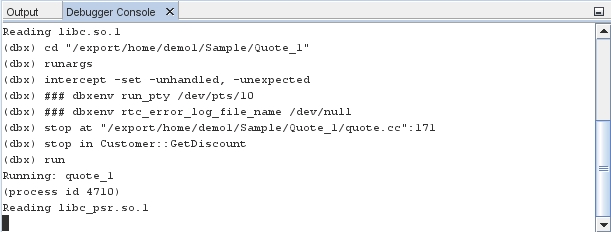
When you start a debugging session, the IDE starts the debugger in the project's associated tool collection (by default, the dbx debugger), then runs the application inside the debugger. The IDE automatically opens debugger windows and prints debugger output to the Debugger Console window.
Starting a Debugging Session
Start a debugging session for the Quote_1 project by right-clicking one of the project nodes and selecting Debug. The debugger begins to run the application and the Debugger Console windows open.

-
Open the Variables window by choosing Window > Debugging > Variables (Alt+Shift-1).
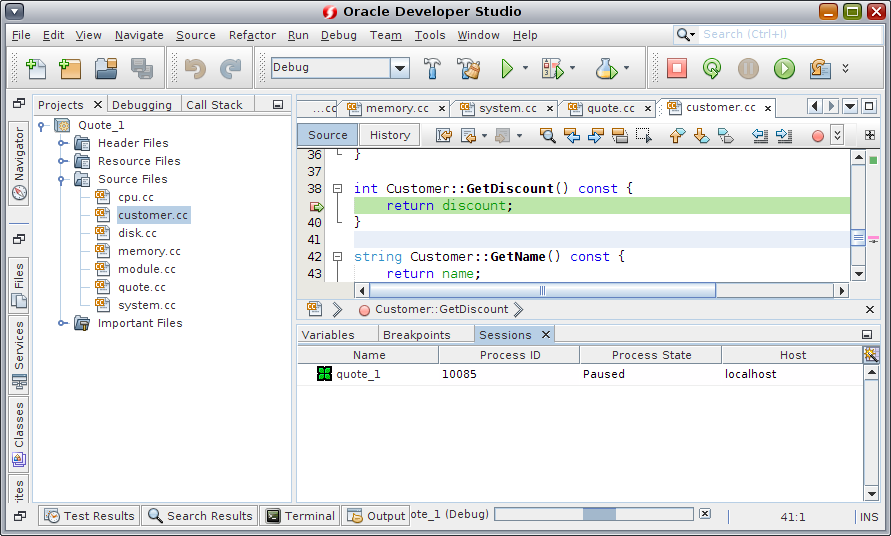
Open the Sessions window by choosing Window > Debugging > Sessions (Alt+Shift-6). The debugging session is shown in this window.

Inspecting the State of the Application
The Quote_1 application prompts you for input in the Output window. Enter a customer name after the Enter customer name: prompt.
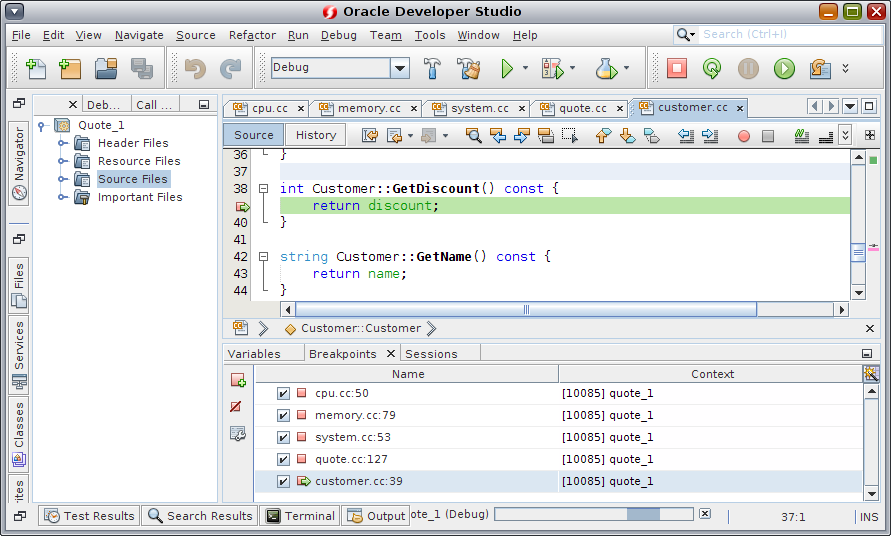
In the customer.cc file, the green program counter arrow appears on top of the breakpoint icon on the first line of the GetDiscount function.

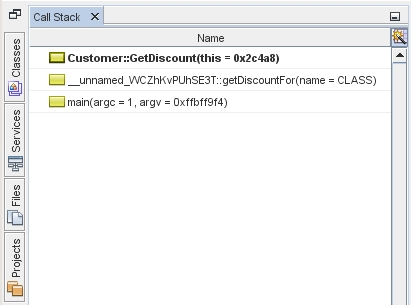
Open the Call Stack window (Alt+Shift-3). The call stack shows three frames.

Click the Variables window and note that one variable is displayed. Click the nodes to expand the structure.

Click the Continue button. The GetDiscount function is executed, printing the customer discount to the Output window. Then you are prompted for input.
Enter the input in response to the prompts. The program stops at the next breakpoint, the line breakpoint you set earlier. Click the Variables window and note the long list of local variables.

Look at the Call Stack window and note that there is only one frame in the stack.
Click Continue
 and continue entering input in response to the prompts in the Output window until the program is completed. When you enter the last input to the program, your debug session ends. To end the debug session before the execution of the program was complete, you could right-click the session in the Sessions window, and choose Finish.