Examining the Hardware Counter Profiling Experiment for mttest
This section shows how to explore the data in the experiment you created from the mttest sample code in the previous section.
Start Performance Analyzer from the mttest directory and load the experiment as follows:
% analyzer test.1.er
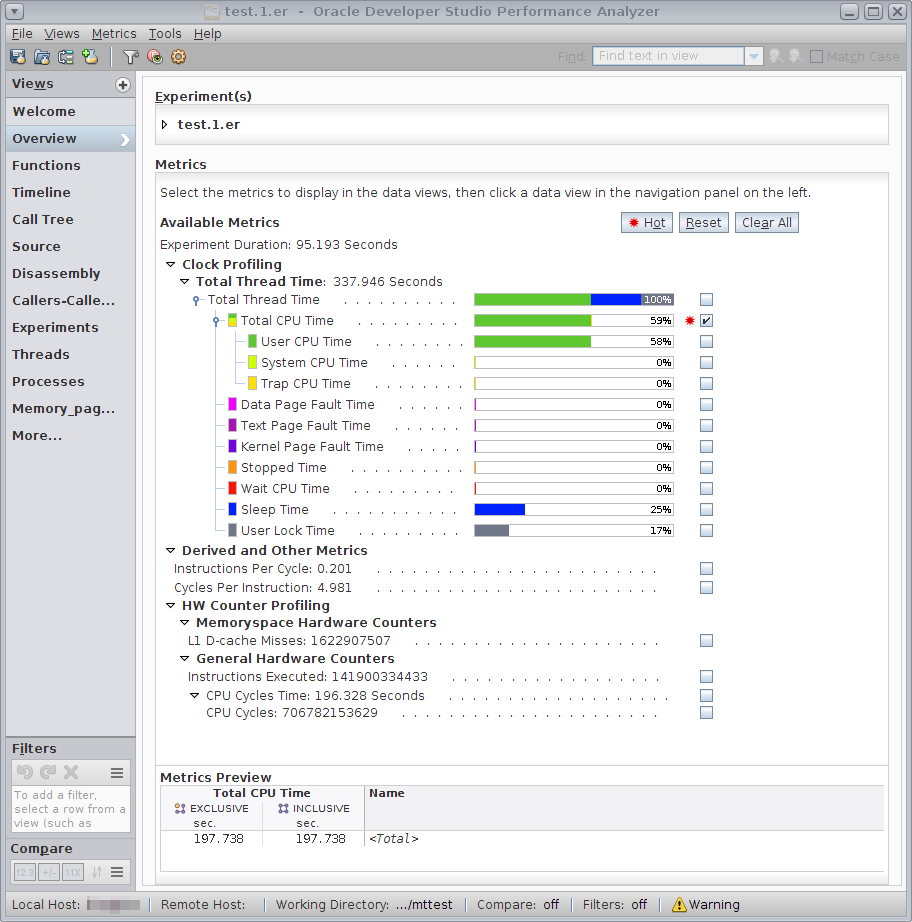
When the experiment opens, Performance Analyzer shows the Overview page.

If the application was run on Oracle Solaris, the Clock Profiling metrics are shown first and include colored bars. Most of the thread time is spent in User CPU Time. Some time is spent in Sleep Time or User Lock Time.
If the application was run on Linux, the Clock Profiling section will include only Total CPU Time.
The Derived and Other Metrics group is present if you have recorded both cycles and insts counters. The derived metrics represent the ratios of the metrics from those two counters. A high value of Instructions Per Cycle or a low value of Cycles Per Instruction indicates relatively efficient code. Conversely, a low value of Instructions Per Cycle or a high value of Cycles Per Instruction indicates relatively inefficient code.
The HW Counter Profiling group shows two subgroups in this experiment, Memoryspace Hardware Counters and General Hardware Counters. The Instructions Executed counter (insts) is listed under General Hardware Counters. If the data you collected included the cycles counter, CPU Cycles is also listed under General Hardware Counters. If counters were enabled that support memoryspace profiling, they will be listed under Memoryspace Hardware Counters. In the previous example, L1 D-cache Misses is such a counter. On Linux, memoryspace profiling is not supported.. For more information about memoryspace profiling, see Dataspace Profiling and Memoryspace Profiling in Oracle Developer Studio 12.6: Performance Analyzer.
Your system will likely have different default counters and metrics. You can edit the Makefile to choose other counters.
You will explore these metrics and their interpretation in the following sections of the tutorial.