Understanding the Java Garbage Collector Behavior
This procedure shows you how to use the Timeline view and the affect of the view mode setting on the Timeline, while examining the activities that trigger Java garbage collection.
-
Set the view mode to User Mode and select the Timeline view in the navigation panel to reveal the execution detail of this hybrid Java/native application, jsynprog.
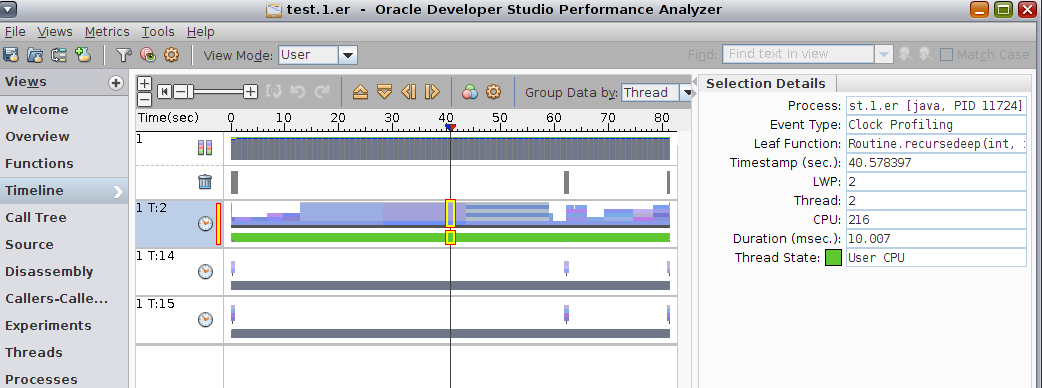
You should see the Process-Wide Resource-Utilization Samples bar at the top and profile data for three threads. In the screen shot you can see data for Process 1, Threads 2, 14, 15. The numbering and the number of threads you see might depend on the OS, the system, and the version of Java you are using.
If the application was run on Oracle Solaris, rows showing thread data will also include the thread's state. For example, only the main user thread, labeled as T:2 in the example, shows a green bar, indicating the thread was in User CPU. The other two threads, T:14 and T:15 show grey bars, which indicates User Lock time, part of the JVM synchronization.
-
Set the view mode to Expert Mode.
The Timeline view should now show more threads although the user thread T:2 appears almost unchanged.
-
Zoom the time axis to better view callstacks with Routine.memalloc(), now in red. You can do this using one of the following methods:
-
Double-click on the callstacks in red.
-
Drag the cursor in the ruler to adjust vertical time markers, then press Enter.
-
Use the + or - icons in the toolbar.
-
Press the plus (+) and minus (-) keys to further adjust the zoom.
-
-
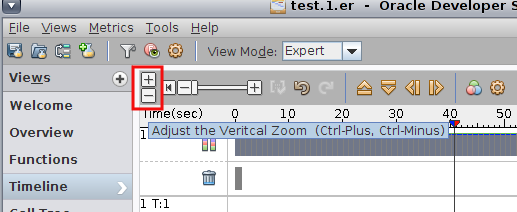
Click the minus (-) button to reduce the height of the thread rows until you can see all twenty threads.
The vertical zoom control is outlined in red in the following screen shot.
-
Click the Call Stack Function Colors icon
 in the Timeline tool bar to set the color of the function
Routine.memalloc() to red.
in the Timeline tool bar to set the color of the function
Routine.memalloc() to red.In the Function Colors dialog, select the Routine.memalloc() function in the Legend, click a red box in Swatches and click Set Selected Functions.
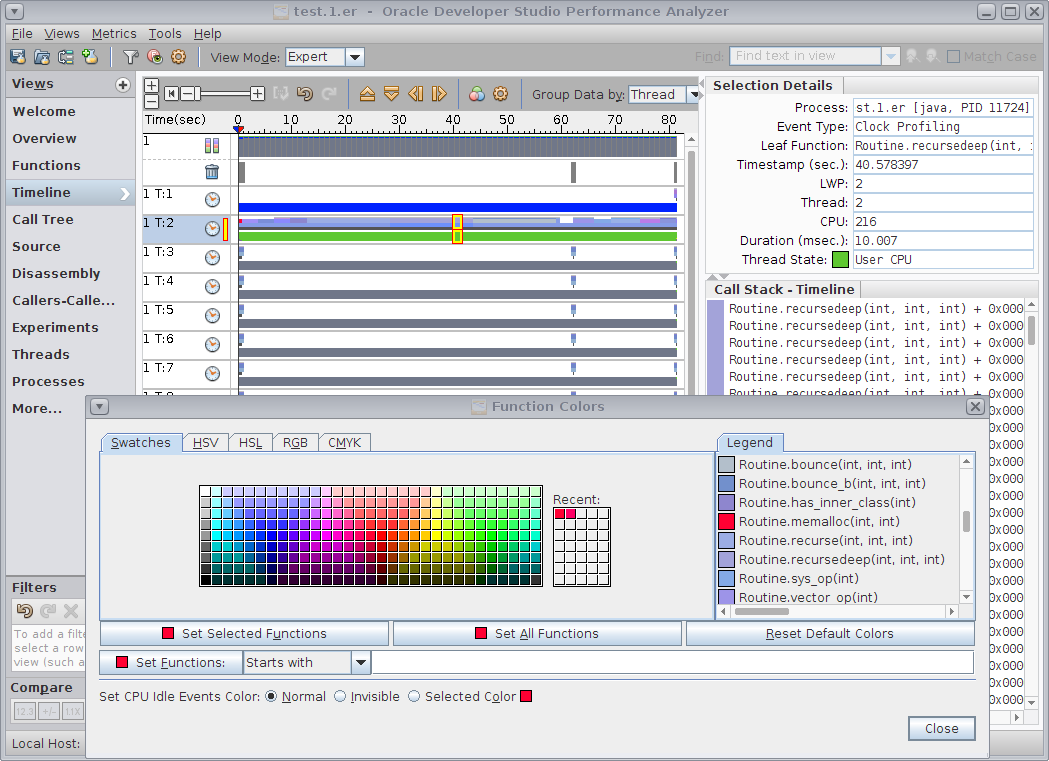
Note that Thread 2 now has a bar of red across the top of its stack. That area represents the portion of time where the Routine.memalloc() routine was running.
You might need to zoom out vertically to see more frames of the callstack, and zoom in horizontally to the region of time that is of interest.
-
Zoom in close enough to see individual events in thread T:2. You can use one of the following methods:
-
Double-click on the area of interest.
-
Drag the cursor in the ruler to adjust vertical time markers, then press Enter.
-
Use the + or - icons in the toolbar.
-
Press the plus (+) and minus (-) keys to further adjust the zoom.

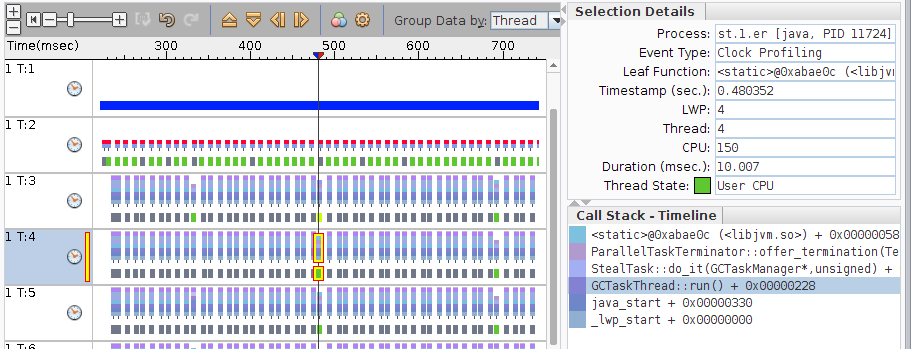
For each active thread of the application, the timeline will show one or more rows of data. The upper portion of each row shows color-coded representations of the thread's callstacks. If you click on a callstack, the function details will be shown in the Call Stack panel. In addition, if an application was profiled on Oracle Solaris, Timeline will show the thread state just below the callstack. In this example, thread T:1 shows predominantly dark blue, representing Sleep. Thread T:2 shows predominantly green, representing User CPU. Thread T:3 shows mostly dark gray, representing Lock.
Notice however that all of those threads 3 through 12 have many events clustered together arriving at the same time as the user thread T:2 is in Routine.memalloc, the routine shown in red.
-
-
Zoom in to the Routine.memalloc region, which have the callstacks with the red bar, and filter to include only that region by doing the following:
-
In the T:2 bar, locate and click on calls to Routine.memalloc().
-
In the timeline ruler, the area showing the timescale below the toolbar, click and drag the cursor to set time markers that enclose the calls to Routine.memalloc().
-
Right-click and select Zoom → To Selected Time Range.
-
With the range still selected, right-click and select Add Filter: Include only events intersecting selected time range.
-
-
Click on any of the events on threads 3-12 and you see in the Call Stack panel that each thread's events include GCTaskThread::run() in the stack.
Those threads represent the threads that the JVM uses to run garbage collection. The GC threads do not take a great amount of User CPU Time and only run while the user thread is in Routine.memalloc.
-
Go back to the Functions view and click on the Incl. Total CPU column header to sort by inclusive Total CPU Time.
You should see that one of the top functions is the GCTaskThread::run() function. This leads you to the conclusion that the user task Routine.memalloc is somehow triggering garbage collection.
-
Select the Routine.memalloc function and switch to the Source view.
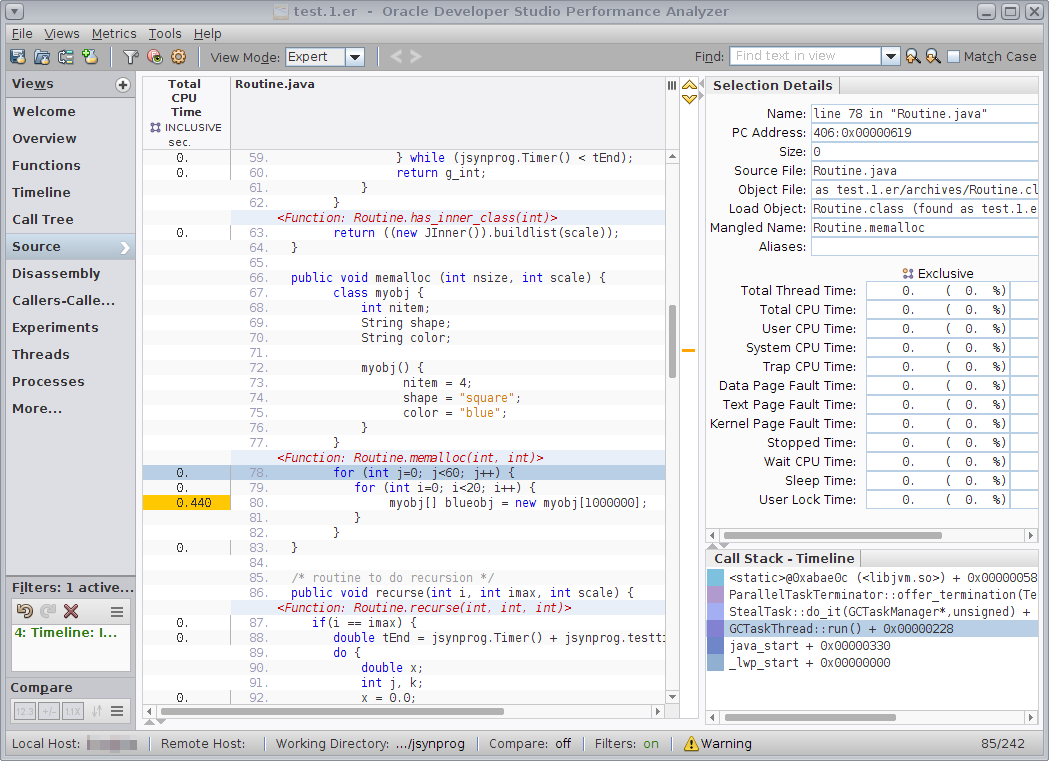
From this fragment of source code it is easy to see why garbage collection is being triggered. The code allocates an array of one million objects and stores the pointers to those objects in the same place with each pass through the loop. This renders the old objects unused, and thus they become garbage.
Continue to the next section.