Examining the Synchronization Tracing Experiment for mttest
This section shows how to explore the data in the experiments you created from the mttest sample code in the previous section.
Start Performance Analyzer from the mttest directory and load the first experiment as follows:
% analyzer test.1.er
When the experiment opens, Performance Analyzer shows the Overview page.
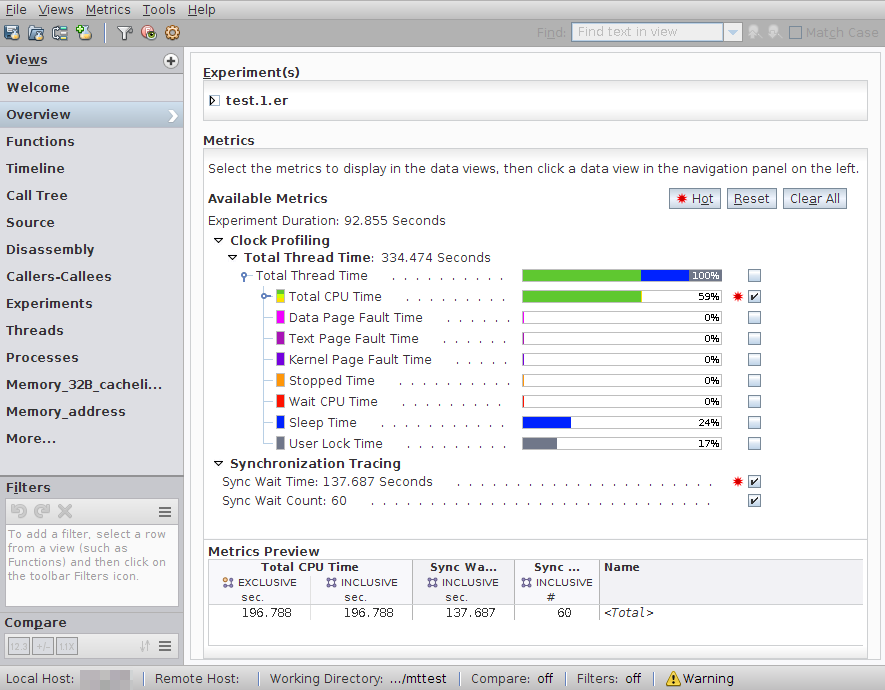
Clock Profiling metrics are shown first. On Oracle Solaris, Clock Profiling will show colored bars. Most of the thread time is spent in User CPU Time. Some time is spent in Sleep Time or User Lock Time. On Linux, only Total CPU time is shown.
Synchronization Tracing metrics are shown in a second group that includes two metrics, Sync Wait Time and Sync Wait Count.
Note - If you do not see the Sync Wait Time and Sync Wait Count metrics, you might have to scroll to the right to see the columns. You can move any column in a more convenient location by right-clicking the metric column header, selecting Move This Metric, and choosing a convenient location for you to see the metrics in relation to the other metrics.
The following example moves the Name column after the Sync Wait Count metric.

You can explore these metrics and their interpretation in the following sections of the tutorial.
Understanding Synchronization Tracing
This section explores the synchronization tracing data and explains how to relate it to clock-profiling data.
-
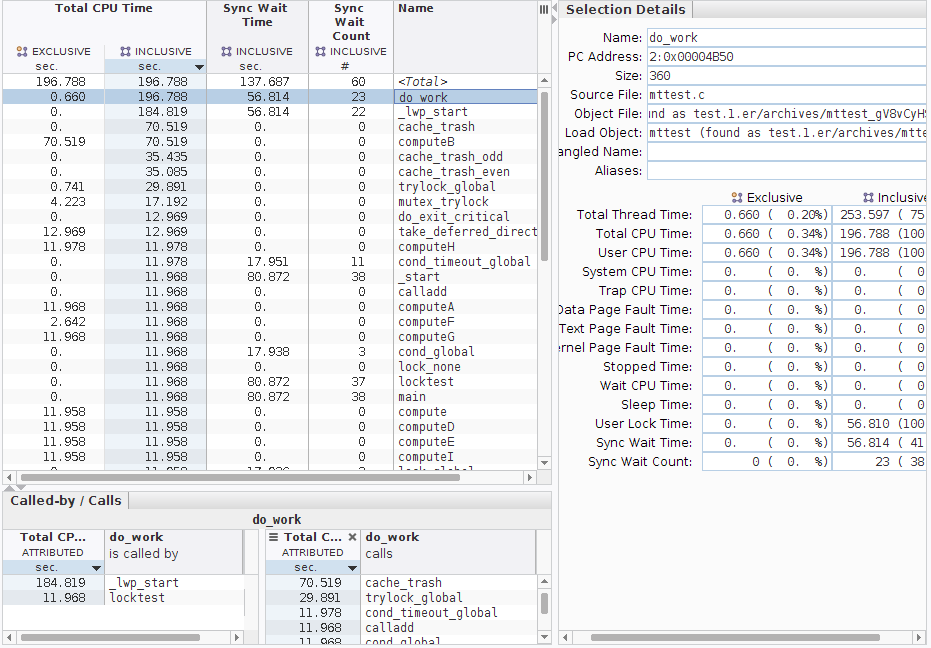
Go to the Functions view and sort according to inclusive Total CPU Time by clicking the column header Inclusive Total CPU.
-
Select the do_work() function at the top of the list.
-
Look at the Called-by/Calls panel at the bottom of the Functions view and note that do_work() is called from two places, and it calls ten functions.
Most often, do_work() is called when a thread to process the data is created, and is shown as called from _lwp_start(). In one case, do_work() calls one single-threaded task called nothreads() after being called from locktest().
The ten functions that do_work() calls represent ten different tasks, and each task uses a different synchronization method that the program executed. In some experiments created from mttest you might see an eleventh function which uses relatively little time to fetch the work blocks for the other tasks. This function fetch_work() is displayed in the Calls panel in the preceding screen shot.
Note that except for the first two of the callees in the Calls panel, all callees show approximately the same amount of time (~10.6 seconds) of Attributed Total CPU.
-
Switch to the Callers-Callees view.
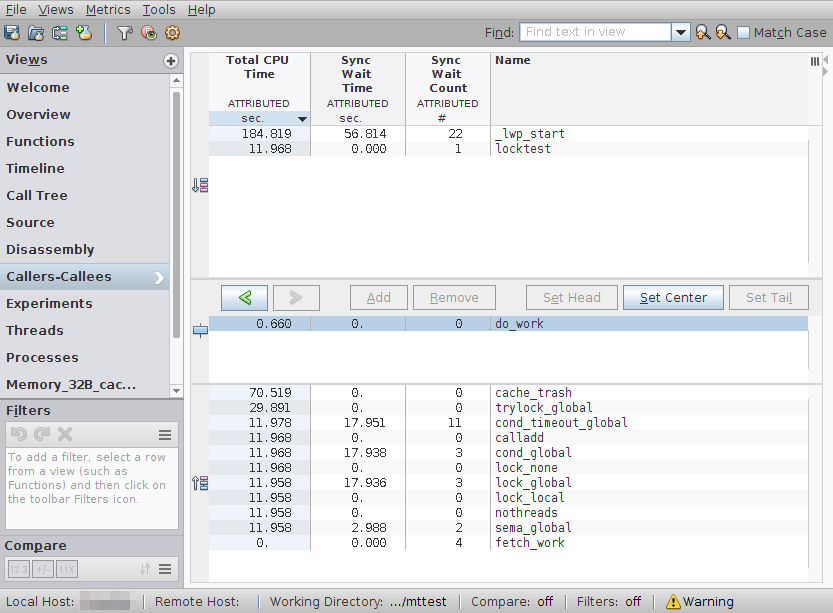
Callers-Callees view shows the same callers and callees as the Called-by/Calls panel, but it also shows the other metrics that were selected in the Overview page, including Attributed Sync Wait Time.
Look for the two functions lock_global() and lock_local(), and note that they show about the same amount of Attributed Total CPU time, but very different amounts of Attributed Sync Wait Time.
-
Select the lock_global() function and switch to Source view.
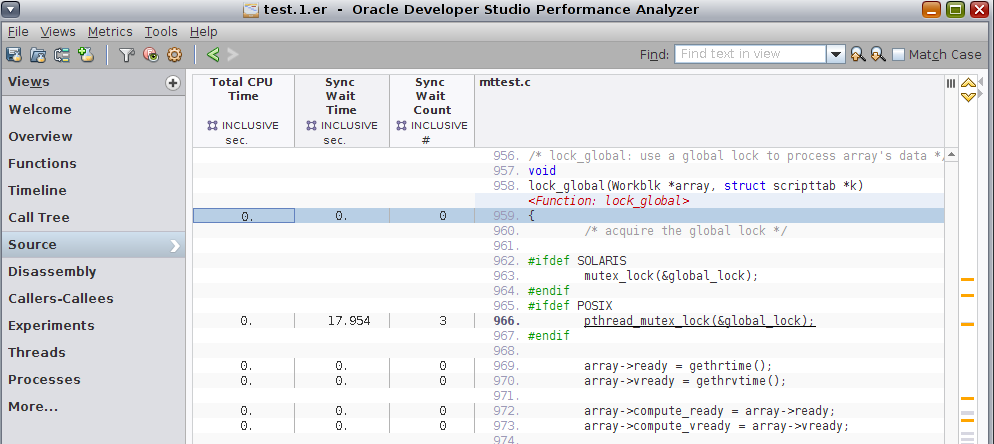
Note that all the Sync Wait time is on the line with the call to pthread_mutex_lock(&global_lock) which has 0 Total CPU Time. As you might guess from the function names, the four threads executing this task all do their work when they acquire a global lock, which they acquire one by one.
-
Go back to the Functions view and select lock_global(), then click the Filter icon
 and select Add Filter: Include only stacks containing the selected functions.
 -
Select the Timeline view and you should see four threads.
-
Zoom into the areas of interest by highlighting the region in the timeline where the events happen, right-clicking, and selecting Zoom → Zoom to Selected Time Range.
-
Examine the four threads and the times spent waiting versus computing.
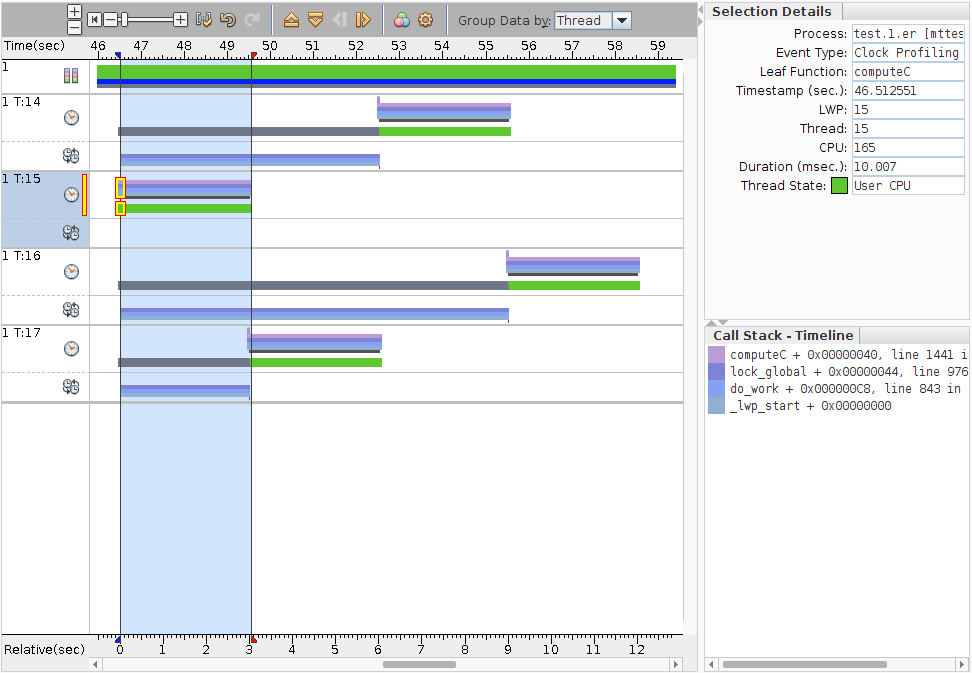
Note - Your experiment might have different threads executing and waiting at different times.The first thread to get the lock (T:15 in the screen shot) works for ~2.97 seconds, then gives up the lock. If your application was run on Oracle Solaris, you can see that the thread state bar was spent in User CPU Time (green), with none in User Lock Time (grey). Notice also that the second bar for Synchronization Tracing Call Stacks marked with the
 show no call stacks for this thread.
The second thread (T:17 in the screen shot) has waited 2.99 seconds in User Lock Time, and then it computes for ~2.90 seconds and gives up the lock. The Synchronization Tracing Call Stacks coincide with the User Lock Time.
The third thread (T:14) has waited 5.98 seconds in User Lock Time and it then computes for ~2.95 seconds, and gives up the lock.
The last thread (T:16) has waited 8.98 seconds in User Lock Time, and it computes for 2.84 seconds. The total computation was 2.97+2.90+2.95+2.84 or ~11.7 seconds.
The total synchronization wait was 2.99 + 5.98 + 8.98 or ~17.95 seconds, which you can confirm in the Functions view (which reports 17.954 seconds).
-
Remove the filter by clicking the X in the Active Filters panel.
-
Go back to the Functions view, select the function lock_local(), and switch to the Source view.
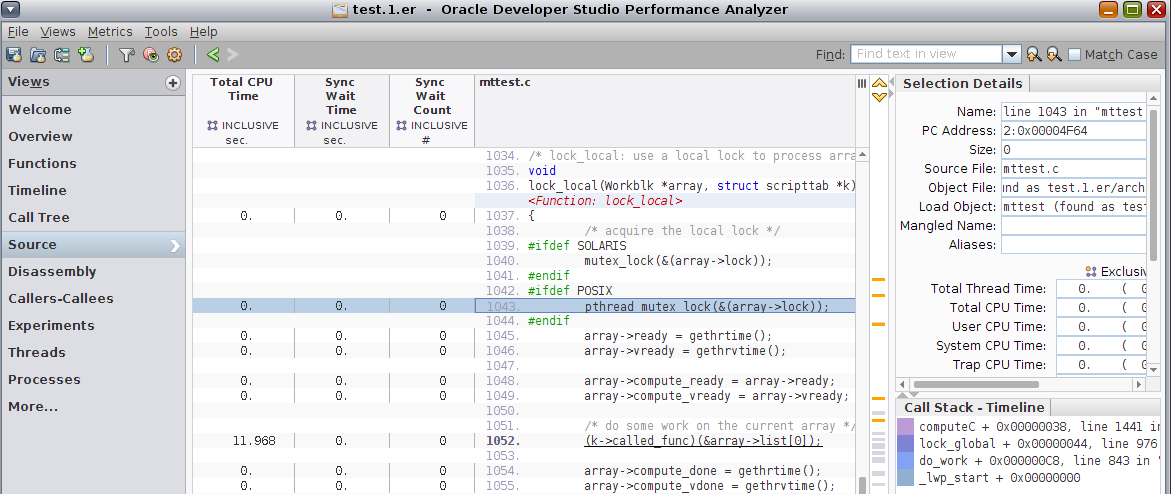
Note that the Sync Wait Time is 0 on the line with the call to pthread_mutex_lock(&array->lock), line 1043 in the screen shot. This is because the lock is local to the workblock, so there is no contention and all four threads compute simultaneously.
The experiment you looked at was recorded with a calibrated threshold. In the next section, you compare to a second experiment which was recorded with zero threshold when you ran the make command.
Comparing Two Experiments with Synchronization Tracing
In this section you compare the two experiments. The test.1.er experiment was recorded with a calibrated threshold for recording events, and the test.2.er experiment was recorded with zero threshold to include all synchronization events that occurred in the mttest program execution.
-
Click the Compare Experiments button
 on the tool bar or choose File → Compare Experiments.
 The Compare Experiments dialog box opens.
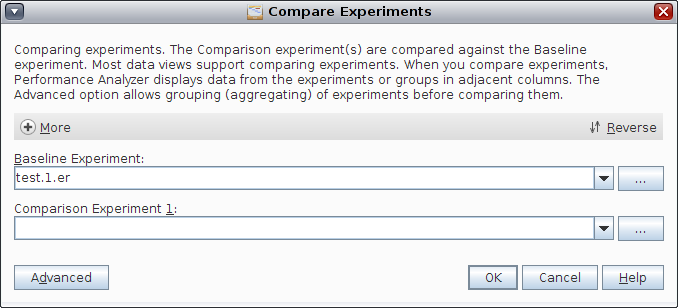
The test.1.er experiment that you already have open is listed in the Baseline group. You must add experiments to compare to the baseline experiment in the Comparison Group panel.
For more information about comparing experiments and adding multiple experiments to compare against the baseline, click the Help button in the dialog box.
-
Click the ... button next to Comparison Experiment 1, and open the test.2.er experiment in the Select Experiment dialog.
-
Click OK in the Compare Experiments dialog to load the second experiment.
The Overview page reopens with the data of both experiments included.
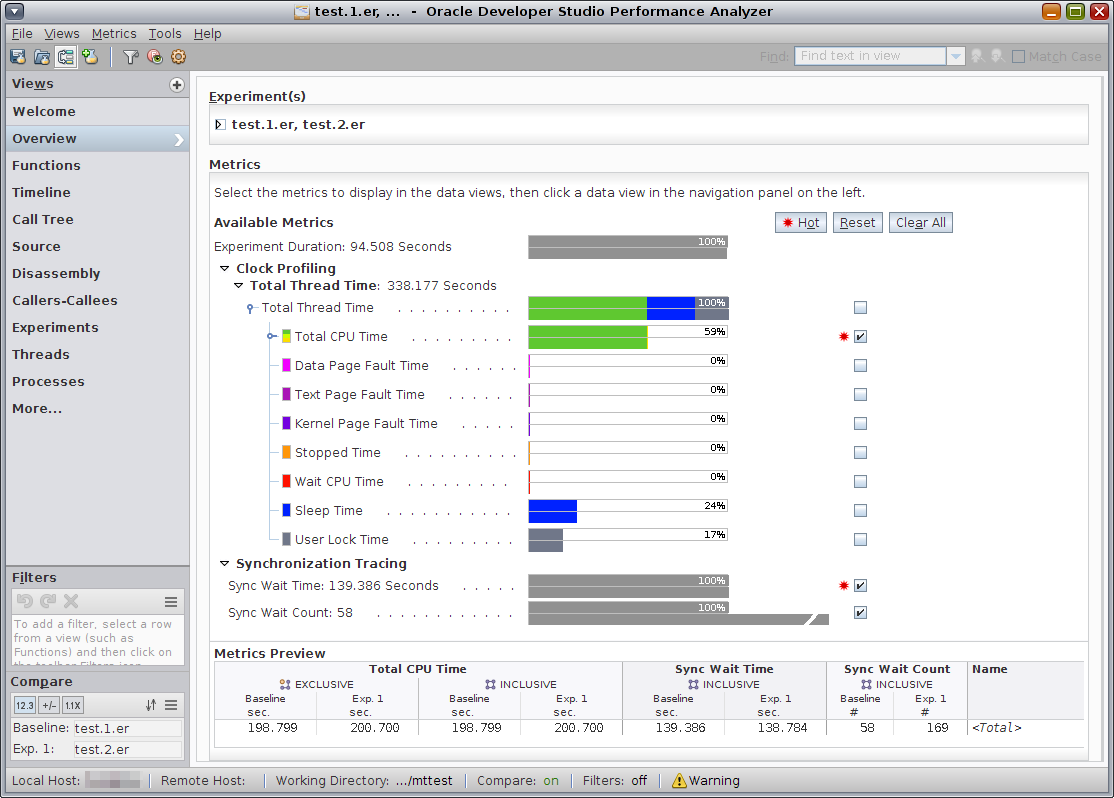
The Clock Profiling metrics display two colored bars for each metric, one bar for each experiment. The data from the test.1.er Baseline experiment is on top.
If you move the mouse cursor over the data bars, pop-up text shows the data from the Baseline and Comparison groups and difference between them in numbers and percentage.
Note that the Total CPU Time recorded is a little larger in the second experiment, but there are almost three times as many Sync Wait Counts.
-
Switch to the Functions view, and click the subcolumn header labeled Baseline under the Inclusive Sync Wait Count column to sort the functions by the number of events in the first experiment.
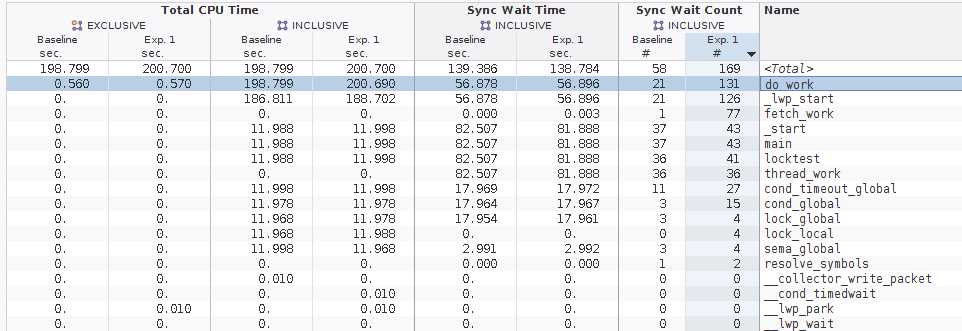
The largest discrepancy between test.1.er and test.2.er is in do_work(), which includes the discrepancies from all the functions it calls, directly or indirectly, including lock_global() and lock_local().
Tip - You can compare the discrepancies even more easily if you change the comparison format. Click the Settings button in the tool bar, select the Formats tab, and choose Deltas for the Comparison Style. After you apply the change, the metrics for test.2.er display as the + or - difference from the metrics in test.1.er. In the preceding screen shot, the selected pthread_mutex_lock() function would show +88 in the test.2.er Incl Sync Wait Count column. -
Select Callers-Callees view.
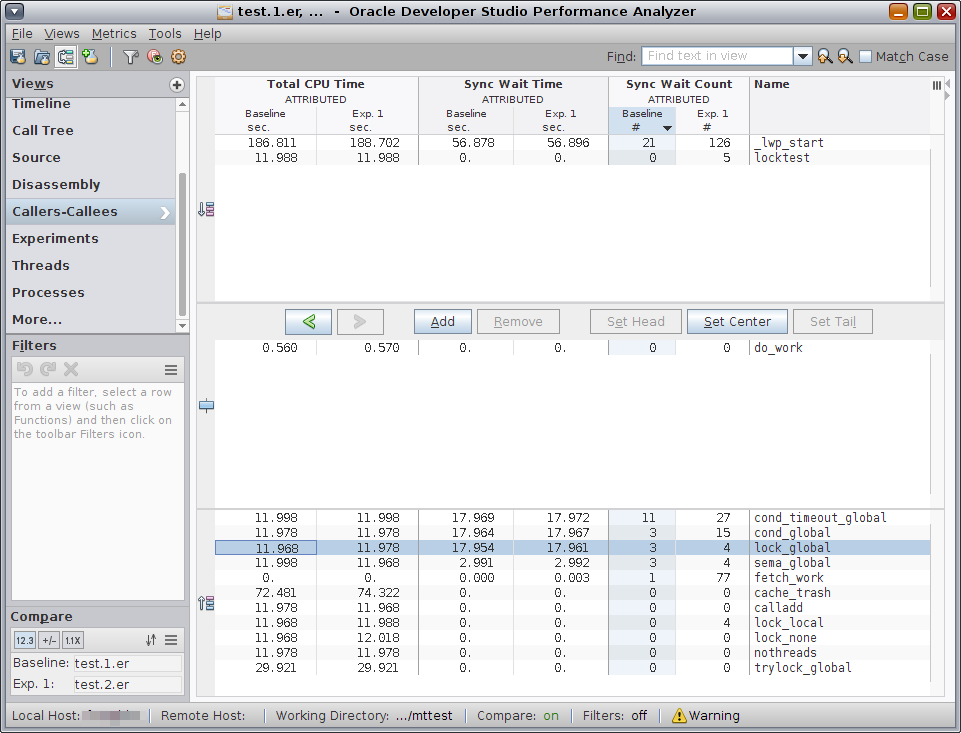
Look at two of the callers, lock_global() and lock_local().
The lock_global() function shows 3 events for Attributed Sync Wait Count in test.1.er, but 4 events in test.2.er. The reason is that the first thread to acquire the lock in the test.1.er was not stalled, so the event was not recorded. In the test.2.er experiment the threshold was set to record all events, so even the first thread's lock acquisition was recorded.
Similarly, in the first experiment there were no recorded events for lock_local() because there was no contention for the lock. There were 4 events in the second experiment, even though in aggregate they had negligible delays.