Understanding Cache Contention and Cache Profiling Metrics
This section and the rest of the tutorial requires an experiment with data from the precise dcm hardware counter. If your system does not support the precise dcm counter, the remainder of the tutorial is not applicable to the experiment you recorded on the system.
The dcm counter is counting cache misses, which are loads and stores that reference a memory address that is not in the cache.
An address might not be in cache for any of the following reasons:
-
Because the current instruction is the first reference to that memory location from that CPU. More accurately, it is the first reference to any of the memory locations that share the cache line.
-
Because the thread has referenced so many other memory addresses that the current address has been flushed from the cache. This is a capacity miss.
-
Because the thread has referenced other memory addresses that map to the same cache line which causes the current address to be flushed. This is a conflict miss.
-
Because another thread has written to an address within the cache line which causes the current thread's cache line to be flushed. This is a sharing miss, and could be one of two types of sharing misses:
-
True sharing, where the other thread has written to the same address that the current thread is referencing. Cache misses due to true sharing are unavoidable.
-
False sharing, where the other thread has written to a different address from the one that the current thread is referencing. Cache misses due to false sharing occur because the cache hardware operates at a cache-line granularity, not a data-word granularity. False sharing can be avoided by changing the relevant data structures so that the different addresses referenced in each thread are on different cache lines.
-
This procedure examines a case of false sharing that has an impact on the function computeB().
-
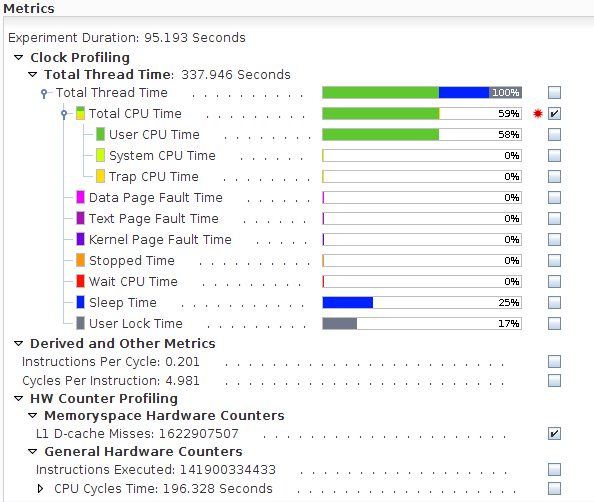
Return to the Overview, and enable the metric for L1 D-cache Misses, and disable the metric for Cycles Per Instruction.

-
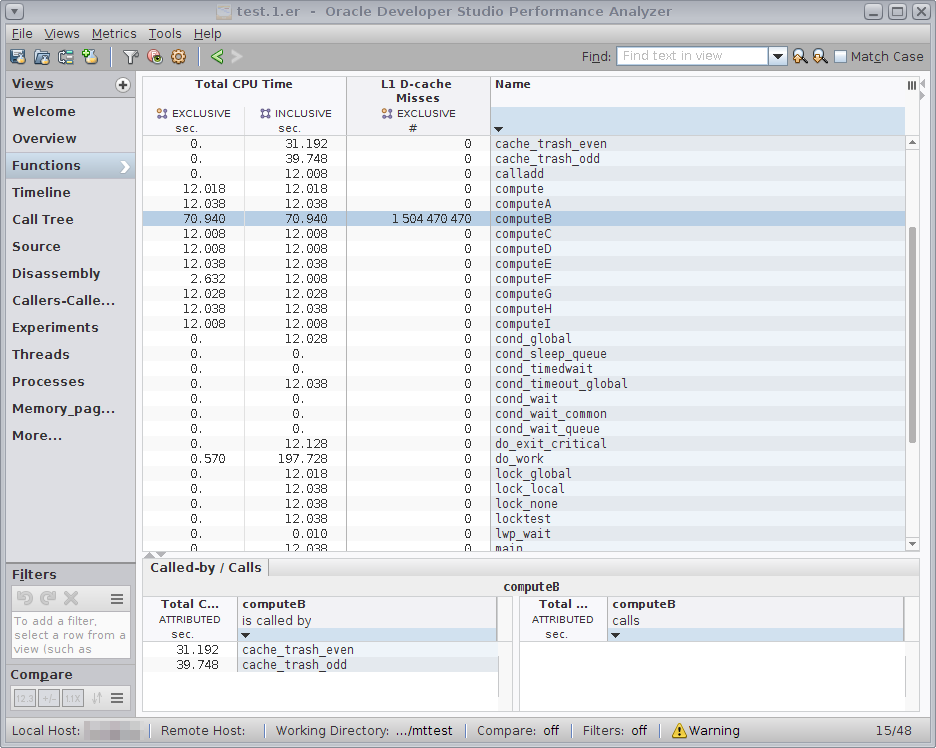
Switch back to the Functions view and look at the compute*() routines.

Recall that all compute*() functions show approximately the same instruction count, but computeB() shows higher Total CPU Time and is the only function with significant counts for Exclusive L1 D-cache Misses.
-
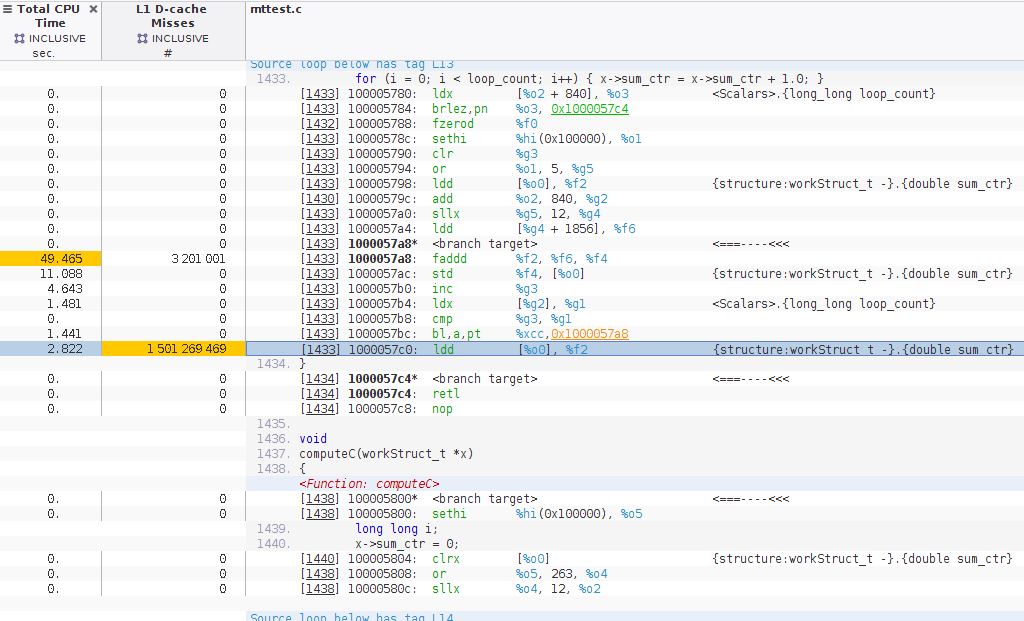
Go back to the Source view and note that in computeB() the cache misses are in the single line loop.
-
If you don't already see the Disassembly tab in the navigation panel, add the View by clicking the + button next to the Views label at the top of the navigation panel and selecting the check box for Disassembly.
Scroll the Disassembly view until you see the line with the load instruction with a high number of L1 D-Cache Misses.
Tip - The right margin of views such as Disassembly include shortcuts you can click to jump to the lines with high metrics, or hot lines. Try clicking the Next Hot Line down-arrow at the top of the margin or the Non-Zero Metrics marker to jump quickly to the lines with notable metric values.
On SPARC systems, if you compiled with –xhwcprof, loads and stores are annotated with structure information showing that the instruction is referencing a double word, sum_ctr in the workStruct_t data structure. You also see lines with the same address as the next line, with <branch target> as its instruction. Such lines indicate that the next address is the target of a branch, which means the code might have reached an instruction that is indicated as hot without ever executing the instructions above the <branch target>.
On x86 systems, the loads and stores are not annotated and <branch target> lines are not displayed because the –xhwcprof is not supported on x86.
-
Go back and forth between the Functions and Disassembly views, selecting various compute*() functions.
Note that for all compute*() functions, the instructions with high counts for Instructions Executed reference the same structure field.
You have now seen that computeB() takes much longer than the other functions even though it executes the same number of instructions, and is the only function that gets cache misses. The cache misses are responsible for the increased number of cycles to execute the instructions because a load with a cache miss takes many more cycles to complete than a load with a cache hit.
For all the compute*() functions except computeB(), the double word field sum_ctr in the structure workStruct_t which is pointed to by the argument from each thread, is contained within the Workblk for that thread. Although the Workblk structures are allocated contiguously, they are large enough so that the double words in each structure are too far apart to share a cache line.
For computeB(), the workStruct_t arguments from the threads are consecutive instances of that structure, which is only one double-word long. As a result the double-words used by the different threads will share a cache line, which causes any store from one thread to invalidate the cache line in the other threads. That is why the cache miss count is so high, and the delay refilling the cache line is why the Total CPU Time and CPU Cycles Metric is so high.
In this example, the data words being stored by the threads do not overlap although they share a cache line. This performance problem is referred to as "false sharing". If the threads were referring to the same data words, that would be true sharing. The data you have looked at so far do not distinguish between false and true sharing.
The difference between false and true sharing is explored in the last section of this tutorial.