Artifacts that may cause performance issues and that should be modified are yellow, and those that will cause performance issues and must be redesigned are red. Use the pie graphs as follows:
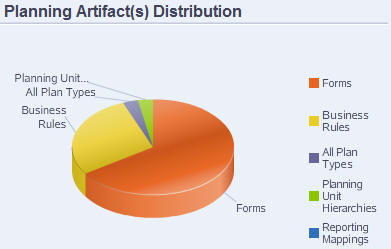
Planning Artifacts Distribution —Depicts how much of your application is comprised of various artifact types. Place your mouse over portions of the graph to view how many artifacts of each type were analyzed by the application monitor. For example, if you mouse over forms and the pop-up value is 55, then 55 forms were analyzed. Click each portion of the graph to view the compliance status of each artifact type. This displays another pie graph that represents how many artifacts of each type are in acceptable, warning, or error status.
Artifact Distribution Graph:
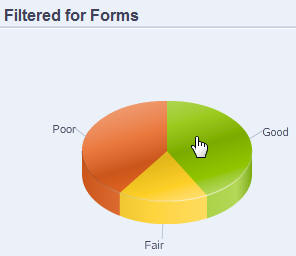
Filtered For <Artifact>—Click the graph portions that represent the artifact status, and to view and drill down on artifacts with a particular status. For example, to view information for only planning unit hierarchies in error status, click the red portion of the graph.
Filtered Graph: