Identify connections in data and perform graph analytics using Oracle Autonomous Database
Graph databases and graph analytics are integral to Oracle's converged database offering. Using the graph capabilities built into the Oracle Database eliminates the need for a separate, single-purpose database and replicating your data. Analysts and developers can perform comprehensive analyses to find connections in data that give insights like customer trends or fraud detection or improve traceability in smart manufacturing. They can perform these analyses while gaining enterprise-grade security, ease of data ingestion, and support for multiple kinds of data workloads.
Oracle Autonomous Database (ADB) provides an integrated, one-click provisioning self-service tool called Graph Studio that automates and simplifies modeling, managing, analyzing, and visualizing graphs across a data lifecycle. Graph Studio provides access to a comprehensive set of graph analytics, including more than 60 prebuilt graph algorithms and a SQL-like declarative language called Property Graph Query Language (PGQL). Graph Studio supports notebooks, which enable data enthusiasts and developers to perform a step-by-step analysis while using an in-memory graph analytics engine (PGX) for the highest performance.
Graphs are a very intuitive way of modeling data and focus on the connections between data entities as most of the data is connected. Graphs make it easier to navigate between connected data entities, explore links, and draw new conclusions. The main components of graphs are vertices (or nodes) and edges, which connect two vertices. Typical examples of graphs are social networks, money flows, bills of materials, or data lineage.
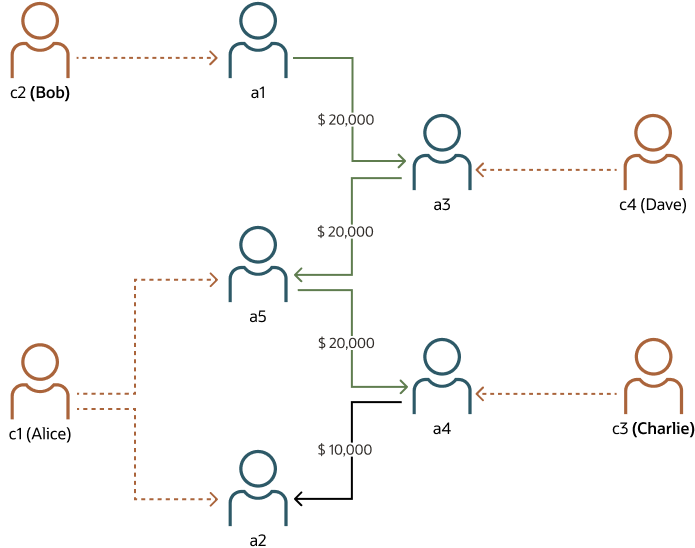
The following example image illustrates how graph analysis is a good fit for identifying fraud in financial transactions.

Description of the illustration graph-analysis-example.png
To make fraud detection simpler, you can create a graph from transactions between entities as well as entities that share some information, including the email addresses, passwords, addresses, and more. Once a graph is created, running a simple query will find all customers with accounts who have similar information, and reveal which accounts are sending money to each other.
For more information and typical examples of graphs, see eBook "17 Use Cases for Graph Databases and Graph Analytics". You can find it in the "Explore More" section at the end of this reference architecture.
- Execute graph algorithms
Graph algorithms analyze paths and distances between vertices, the importance of vertices, or the clustering of vertices. They are beneficial for:
- Detecting communities (e.g. Louvain, Label Propagation)
- Detecting connected components (e.g. Strongly Connected Components, Weakly Connected Components)
- Evaluating structures (e.g. Cycle Detection, Triangle Counting, Reachability)
- Predicting links (e.g. Whom-to-follow), ranking and walking nodes in a graph (e.g. PageRank, Degree Centrality, Closeness Centrality, SALSA)
- Finding paths (e.g. Bellman-Ford, Dijkstra, Fattest Path, Hop Distance)
- Run graph pattern matching queries
Graph pattern matching queries can detect patterns such as cycles or indirect dependencies among vertices and edges that match a specified set of constraints.
Architecture
This architecture uses Oracle Autonomous Data Warehouse as a centralized data warehouse with data loaded and curated from multiple enterprise repositories and departmental data sources.
It then uses Graph Studio to model data as graphs. Graph Studio's integrated notebook interface with interpreters for Java, PGQL, and Python enables you to quickly execute graph algorithms, query graphs and visualize results.This reference architecture helps you get started with graphs and creates a lab environment for graph analysis without the need for additional tools or software components. You can work with graphs containing millions of vertices and edges, including their properties.
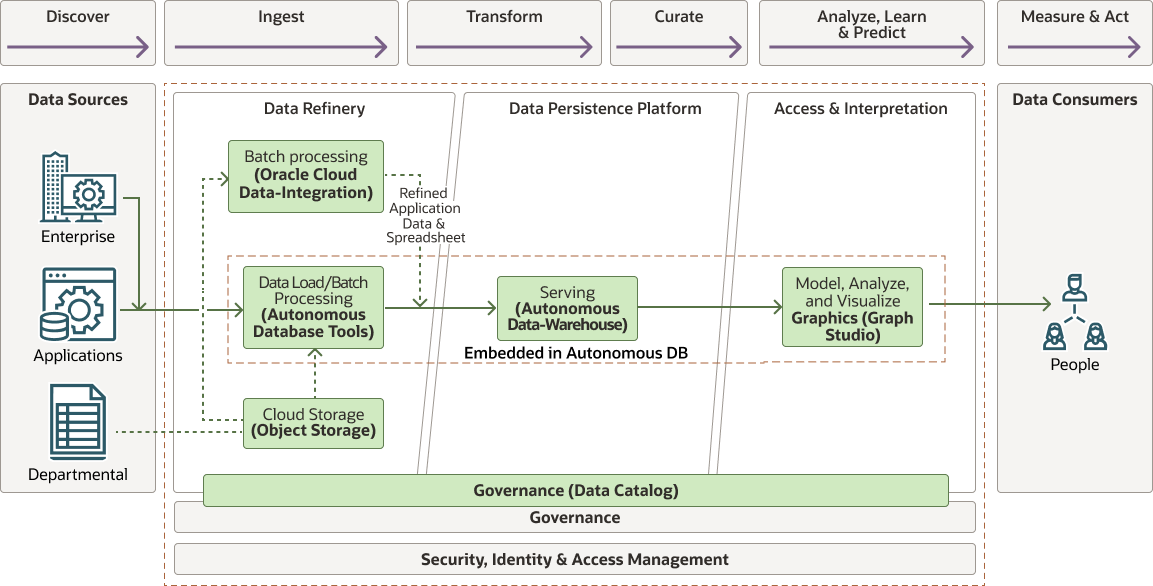
The following diagram is a functional representation of the reference architecture.
propertygraph-analysis-arch-oracle.zip
- Data refinery
Ingests and refines the data for use in each of the data layers in the architecture. The shape is intended to illustrate the differences in processing costs for storing and refining data at each level and moving data between them.
- Data persistence platform (curated information
layer)
Facilitates access and navigation of the data to show the current business view. This layer lets you create graph views or persistent graph structures from relational data.
- Access and interpretation
Abstracts the logical business view of the data for the consumers. This abstraction facilitates agile approaches to data analysis, providing a single analytics layer for your curated data.
The architecture has the following components:
- Data integration
Oracle Autonomous Database has the embedded tools necessary to acquire, load, and transform your data for many departmental scenarios and specific advanced use cases. Autonomous Data Warehouse includes the capability to load data from local or object storage quickly. Also included are Autonomous Data Transforms, which allow you to connect to data from many different source types and access EL-T type functionality.
The Oracle Cloud Infrastructure Data Integration Cloud service is for more advanced use cases. It is a fully managed, serverless, native cloud service. The service lets you design and perform tasks to extract, load, and transform (ETL) data from different sources.
- Object storage
Oracle Cloud Infrastructure Object Storage is an internet-scale, high-performance storage platform that offers reliable and cost-efficient data durability. Oracle Cloud Infrastructure Object Storage can store an unlimited amount of unstructured data of any content type, including analytic data. You can safely retrieve, for example, departmental data and hold those in an Object Storage bucket. You can then use the Data Load tools of the Autonomous Database to load data from a bucket into the Autonomous Database.
- Autonomous Database (ADW, ATP)
Oracle Autonomous Database is a self-driving, self-securing, self-repairing database service optimized for data warehousing workloads. You do not need to configure or manage any hardware or install any software. Oracle Cloud Infrastructure handles creating the database and backing up, patching, upgrading, and tuning the database. With Autonomous Data Warehouse, you have the flexibility to load data into multiple formats, including structured, JSON, XML, Graph, and Spatial. Bundled with this service are the Autonomous Tools that allow you to load data into tables and do light ETL work efficiently.
- Graph Studio
Graph Studio is a feature of Oracle Autonomous Database on Shared Infrastructure. It is built into Autonomous Transactional Processing (ATP) and Autonomous Data Warehouse (ADW). It provides tooling for developers, analysts, data engineers, and data scientists working with graphs.Graph Studio contains a low-code user interface that automates graph modeling graphs from existing relational tables in your data warehouse, performing graph analysis, developing graph applications, and visualizing and sharing results. The Autonomous Database and Graph Studio combination gives you a complete graph database platform deployable in minutes with one-click provisioning, integrated tooling, and security. It does not require you to be a database expert or graph specialist to get started and be productive.
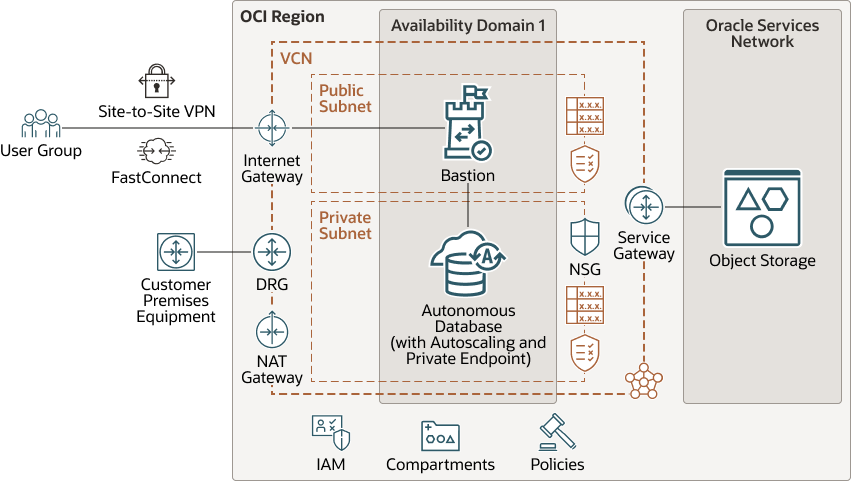
The following diagram shows a mapping of the architecture above to services provided in Oracle Cloud Infrastructure using best practices with regard to security.

Description of the illustration oci-adb-graph-studio-arch.png
oci-adb-graph-studio-arch-oracle.zip
This reference architecture has the following main components:
- Virtual cloud network (VCN) and subnet
A VCN is a customizable, software-defined network that you set up in an Oracle Cloud Infrastructure region. Like traditional data center networks, VCNs give you complete control over your network environment. A VCN can have multiple non-overlapping CIDR blocks that you can change after you create the VCN. You can segment a VCN into subnets, which can be scoped to a region or to an availability domain. Each subnet consists of a contiguous range of addresses that don't overlap with the other subnets in the VCN. You can change the size of a subnet after creation. A subnet can be public or private.
- Availability domain
Availability domains are standalone, independent data centers within a region. The physical resources in each availability domain are isolated from the resources in the other availability domains, which provides fault tolerance. Availability domains don’t share infrastructure such as power or cooling, or the internal availability domain network. So, a failure at one availability domain is unlikely to affect the other availability domains in the region.
- Bastion host
The bastion host is a compute instance that serves as a secure, controlled entry point to the topology from outside the cloud. The bastion host is provisioned typically in a demilitarized zone (DMZ). It enables you to protect sensitive resources by placing them in private networks that can't be accessed directly from outside the cloud. The topology has a single, known entry point that you can monitor and audit regularly. So, you can avoid exposing the more sensitive components of the topology without compromising access to them.
- Network address translation (NAT) gateway
A NAT gateway enables private resources in a VCN to access hosts on the internet, without exposing those resources to incoming internet connections.
- Internet gateway
The internet gateway allows traffic between the public subnets in a VCN and the public internet.
- Service gateway
The service gateway provides access from a VCN to other services, such as Oracle Cloud Infrastructure Object Storage. The traffic from the VCN to the Oracle service travels over the Oracle network fabric and never traverses the internet.
- Autonomous Database with autoscaling
In this architecture, the Oracle Autonomous can be either Autonomous Data Warehouse (ADW) or Autonomous Transactional Processing (ATP) configured with autoscaling and private endpoint. It is used for storing application-specific data as well as modeling, creating, maintaining, querying, and visualizing graphs. An access control list (ACL) limits network access to the Autonomous Database. It has a pre-created application user with necessary rights granted to develop and maintain graphs and to use Graph Studio as embedded tool of the Autonomous Database. Sample data are pre-loaded into the database user schema to have an easy start with Graph Studio.
Recommendations
- Data Refinery
Autonomous Database Tools is functionality embedded in Oracle Autonomous Data Warehouse that provides the capabilities to load, transform, catalog, gain insights and even develop business models in a simple, straightforward fashion.
- Graph StudioBefore you connect to Graph Studio, we recommend:
- Creating a database user with the necessary permissions.
- Using the Graph Size
Estimator to estimate the size of your graph. The maximum
in-memory representation allowed for a graph loaded into the Graph
Studio memory is 109 GB.
Note:
If your graph is estimated to consume more than 109 GB, consider deploying Oracle Graph Server and Clients tools from Oracle MarketPlace into a compute VM with the required memory. VM.Standard.E3.Flex and VM.Standard.E4.Flex shapes can have up to 1024 GB of memory.
Considerations
When loading and configuring data from multiple databases and file sources into a centralized data warehouse enabled for graph analysis, consider the following implementation options:
| Guidance | Data Refinery | Data Persistence Platform | Access & Interpretation |
|---|---|---|---|
| Recommended | Oracle Autonomous Database Tools | Oracle Autonomous Database (ADW or ATP) | Oracle Graph Studio |
| Other Options |
|
|
|
- Data gravity:
Keep your graph analysis operations close to your data to limit the high cost of data movement.
Deploy
The Terraform code for this reference architecture is available as a sample stack in Oracle Cloud Infrastructure Resource Manager. You can also download the code from GitHub, and customize it to suit your specific requirements.
- Deploy using the sample stack in Oracle Cloud Infrastructure Resource
Manager:
- Click

If you aren't already signed in, enter the tenancy and user credentials.
- Select the region where you want to deploy the stack.
- Follow the on-screen prompts and instructions to create the stack.
- After creating the stack, click Terraform Actions, and select Plan.
- Wait for the job to be completed, and review the plan.
To make any changes, return to the Stack Details page, click Edit Stack, and make the required changes. Then, run the Plan action again.
- If no further changes are necessary, return to the Stack Details page, click Terraform Actions, and select Apply.
- Click
- Deploy using the Terraform code in GitHub:
- Go to GitHub.
- Clone or download the repository to your local computer.
- Follow the instructions in the
READMEdocument.
Explore More
Review the following resources to learn more about the features of this architecture.
- Product page: Oracle Graph Database and Graph Analytics
- E-book: 17 Use Cases for Graph Database and Graph Analytics
- Technical feature overview: Oracle Graph Technologies
- Documentation: Oracle Property Graph
- LiveLabs workshop: Get started with Graph Analytics on Oracle Autonomous Database
- YouTube channel: Oracle Spatial and Oracle Graph
- Project page: Property Graph Query Language (PGQL)
- Oracle Labs project page: Parallel Graph AnalytiX (PGX)
