| Oracle® Java Micro Edition Embedded Client Customization Guide Release 1.1 E23815-01 |
|
 Previous |
 Next |
| Oracle® Java Micro Edition Embedded Client Customization Guide Release 1.1 E23815-01 |
|
 Previous |
 Next |
This chapter describes how to use runtime options to adjust the performance of the compiler, heap, and class verification to fit your deployment's characteristics and requirements.
This chapter includes the following topics:
This section shows how to use cvm command-line options that control the behavior of the Oracle Java Micro Edition Embedded Client Java virtual machine's dynamic compiler for different purposes:
Optimizing a specific application's performance.
Configuring the dynamic compiler's performance for a target device.
Exercising run-time behavior to aid the porting process.
Using these options effectively requires an understanding of how a dynamic compiler operates and the kind of situations it can exploit. During its operation the Oracle Java Micro Edition Embedded Client virtual machine instruments the code it executes to look for popular methods. Improving the performance of these popular methods accelerates overall application performance.
The following subsections describe how the dynamic compiler operates and provides some examples of performance tuning. For a complete description of the dynamic compiler-specific command-line options, see the Oracle Java Micro Edition Embedded Client Architecture Guide.
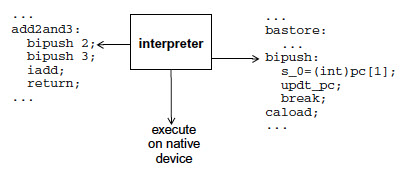
The Oracle Java Micro Edition Embedded Client virtual machine offers two mechanisms for method execution: the interpreter and the dynamic compiler. The interpreter is a straightforward mechanism for executing a method's bytecodes. For each bytecode, the interpreter looks in a table for the equivalent native instructions, executes them and advances to the next bytecode. Shown in Figure 4-1, this technique is predictable and compact, yet slow.
Figure 4-1 Interpreter-Based Method Execution

The dynamic compiler is an alternate mechanism that offers significantly faster run-time execution. Because the compiler operates on a larger block of instructions, it can use more aggressive optimizations and the resulting compiled methods run much faster than the bytecode-at-a-time technique used by the interpreter. This process occurs in two stages. First, the dynamic compiler takes the entire method's bytecodes, compiles them as a group into native code and stores the resulting native code in an area of memory called the code cache as shown in Figure 4-2.
Then the next time the method is called, the run-time system executes the compiled method's native instructions from the code cache as shown in Figure 4-3.
The dynamic compiler cannot compile every method because the overhead would be too great and the start-up time for launching an application would be too noticeable. Therefore, a mechanism is needed to determine which methods get compiled and for how long they remain in the code cache.
Because compiling every method is too expensive, the dynamic compiler identifies important methods that can benefit from compilation. The Oracle Java Micro Edition Embedded Client Java virtual machine has a run-time instrumentation system that measures statistics about methods as they are executed. cvm combines these statistics into a single popularity index for each method. When the popularity index for a given method reaches a certain threshold, the method is compiled and stored in the code cache.
The run-time statistics kept by cvm can be used in different ways to handle various application scenarios. cvm exposes certain weighting factors as command-line options. By changing the weighting factors, cvm can change the way it performs in different application scenarios. A specific combination of these options express a dynamic compiler policy for a target application. An example of these options and their use is provided in Managing the Popularity Threshold.
The dynamic compiler has options for specifying code quality based on various forms of inlining. These provide space-time tradeoffs: aggressive inlining provides faster compiled methods, but consume more space in the code cache. An example of the inlining options is provided in Managing Compiled Code Quality.
Compiled methods are not kept in the code cache indefinitely. If the code cache becomes full or nearly full, the dynamic compiler discards compiled code to obtain memory for a new compilation. A method whose compiled code has been released is interpreted when next invoked. An example of how to manage the code cache is provided in Managing the Code Cache.
The cvm application launcher has a group of command-line options that control how the dynamic compiler behaves. These options form dynamic compiler policies that target application or device-specific needs. The most common are space-time tradeoffs. For example, one policy might cause the dynamic compiler to compile early and often while another might set a higher threshold because memory is limited or the application is short-lived.
The cvm Reference appendix in the Architecture Guide lists the dynamic compiler command-line options (-Xjit) and their defaults. These defaults provide the best overall performance based on experience with a large set of applications and benchmarks and should be useful for most application scenarios. They might not provide the best performance for a specific application or benchmark. Finding alternate values requires experimentation, a knowledge of the target application's run-time behavior and requirements in addition to an understanding of the dynamic compiler's resource limitations and how it operates.
The following examples show how to experiment with these options to tune the dynamic compiler's performance.
When the popularity index for a given method reaches a certain threshold, it becomes a candidate for compiling. cvm provides four command-line options that influence when a given method is compiled: the popularity threshold and three weighting factors that are combined into a single popularity index:
climit, the popularity threshold. The default is 20000.
bcost, the weight of a backwards branch. The default is 4.
icost, the weight of an interpreted to interpreted method call. The default is 20.
mcost, the weight of transitioning between a compiled method and an interpreted method and vice versa. The default is 50.
Each time a method is called, its popularity index is incremented by an amount based on the icost and mcost weighting factors. The default value for climit is 20000. By setting climit at different levels between 0 and 65535, you can find a popularity threshold that produces good results for a specific application.
The following example uses the -Xjit:option command-line option syntax to set an alternate climit value:
% cvm -Xjit:climit=10000 MyTest
Setting the popularity threshold lower than the default causes the dynamic compiler to more eagerly compile methods. Since this usually causes the code cache to fill up faster than necessary, this approach is often combined with a larger code cache size to avoid thrashing between compiling and discarding compiled methods.
The dynamic compiler can choose to inline methods for providing better code quality and improving the speed of a compiled method. Usually this involves a space-time trade-off. Method inlining consumes more space in the code cache but improves performance. For example, suppose a method to be compiled includes an instruction that invokes an accessor method returning the value of a single variable.
public void popularMethod() {
...
  int i = getX();
...
}
public int getX() {
  return X;
}
getX() has overhead like creating a stack frame. By copying the method's instructions directly into the calling method's instruction stream, the dynamic compiler can avoid that overhead.
cvm has several options for controlling method inlining, including the following:
maxInliningCodeLength sets a limit on the bytecode size of methods to inline. This value is used as a threshold that proportionally decreases with the depth of inlining. Therefore, shorter methods are inlined at deeper depths. In addition, if the inlined method is less than value/2, the dynamic compiler allows unquick opcodes in the inlined method.
minInliningCodeLength sets the floor value for maxInliningCodeLength when its size is proportionally decreased at greater inlining depths.
maxInliningDepth limits the number of levels that methods can be inlined.
For example, the following command-line specifies a larger maximum method size.
% cvm -Xjit:inline=all,maxInliningCodeLength=80 MyTest
In one experiment, reducing code quality reduced the usage of code cache memory by about 40% while reducing performance by about 5%. The values used were:
maxInliningDepth=3 (default 12)
maxInliningCodeLength=26 (default 64)
climit=60000 (default 20000)
On some systems, the benefits of compiled methods must be balanced against the limited memory available for the code cache. cvm offers several command-line options for managing code cache behavior. The most important is the size of the code cache, which is specified with the codeCacheSize option.
Increasing the default code cache size from the default 512KB is beneficial to many applications. On the other hand, when minimizing dynamic memory usage is paramount, you can reduce the code caches size. For example, the following command-line specifies a code cache that is half the default size.
% cvm -Xjit:codeCacheSize=256k MyTest
A smaller code cache causes the dynamic compiler to discard compiled method code more frequently. Therefore, you might also want to use a higher compilation threshold in combination with a lower code cache size.
The -Xjit:maxWorkingMemorySize command-line option sets the maximum working memory size for the dynamic compiler. The 512 KB default can be misleading. Under most circumstances the working memory for the dynamic compiler is substantially less and is furthermore temporary. For example, when a method is identified for compiling, the dynamic compiler allocates a temporary amount of working memory that is proportional to the size of the target method. After compiling and storing the method in the code buffer, the dynamic compiler releases this temporary working memory.
The average method needs less than 30 KB but large methods with lots of inlining can require much more. However since 95% of all methods use 30 KB or less, this is rarely an issue. Setting the maximum working memory size to a lower threshold should not adversely affect performance for the majority of applications.
This section provides an overview of how the Java virtual machine manages memory, and the options that you can set to improve performance.
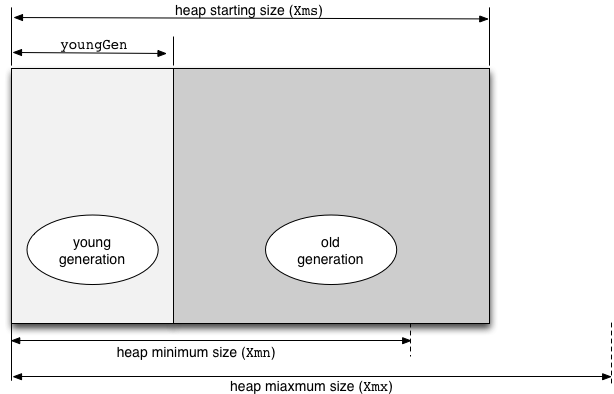
The virtual machine uses the native platform's memory allocation mechanism to create the Java heap, which is where it stores Java objects. The heap is divided into two areas called the young and old generations as shown in Figure 4-4. The names refer to the relative age of objects in the heap. Classifying objects by age is an optimzation technique for garbage collection, which is described in Garbage Collection. Functionally, the heap is a single storage area for objects.
Figure 4-4 Young and Old Java Heap Generations at Startup

When you launch the virtual machine with the cvm command (described in the Architecture Guide), you can specify heap size options that trade memory consumption for performance.
Heap options:
-Xmssize: The starting size of the heap, which is the space available for object storage, default 2M (megabytes).
-Xgc:youngGen=size: The size of the young generation region within the heap, default 1M.
-Xmxsize: The maximum size of the heap, default 7M. During execution, as necessary, the virtual machine expands the old generation region to this maximum. The young generation region does not expand. If the heap is at its maximum size and there is insufficient memory for a new object, the result is an OutOfMemoryError exception.
-Xmnsize: The minimum size of the heap, default 1M. During execution, when demand for heap space is low, the virtual machine returns old generation memory to the operating system, down to this minimum size.
Heap usage is highly application-specific. Use profiling (described in the Developer's Guide) to monitor heap usage. You can also use the statistics produced by the cvm command's -Xgc:stat option.
When a Java application creates an object, the virtual machine allocates memory for the object in the Java heap. After the object is no longer needed, the VM reclaims the object's memory so it can be allocated to new objects. The VM's automatic garbage collection (GC) system frees the application developer from the responsibility of manually allocating and freeing memory, which is a major source of bugs with conventional application platforms. GC has some additional costs, including run-time pauses and memory footprint overhead. However, these costs are usually small in comparison to the benefits of application reliability and developer productivity.
Because garbage collection suspends application execution, it is important to set heap-related options so garbage collection does not violate application performance or resource consumption requirements.
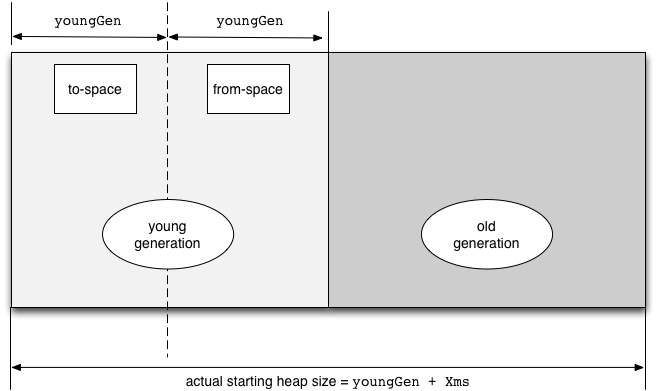
The division of the heap into young and old generations of objects is a performance optimization based on the observation that most objects "die young". Young generation garbage collection uses a technique called copy semispace. It is fast and productive and can be run frequently with little noticeable application slowdown. The cost of fast collection is doubling the memory space required to store the young generation (see Figure 4-5).
Figure 4-5 Young Generation From-space and To-space

As shown in Figure 4-5, when the the virtual machine creates the heap, it prepends a region that is equal in size to youngGen. The expanded young generation region consists of a from-space and a to-space. During execution, only the from-space is active; new objects are allocated there. The to-space is only used during garbage collection.
When the from-space fills, the young generation garbage collector copies live objects to the to-space, updates references to the live objects, and switches its to-space and from-space pointers, making the old from-space into the to-space. Under typical "most objects die young" conditions, few objects are copied during garbage collection and much of the old from-space is reclaimed. Young objects that survive a small number of garbage collections are assumed to be long-lived, and are promoted to the old generation to prevent further fruitless copying.
For the young generation to work effectively, youngGen must be large enough for a substantial number of recently allocated objects to die before the from-space fills. If youngGen is too small, the from-space will fill frequently, and the young generation garbage collector will run frequently and reclaim a small percentage of the space. In addition, some objects that will soon die will be promoted to the slower-to-collect old generation. As a starting point, you can make youngGen about 1/8 of -Xmssize, but understanding and profiling your application is the best practice for optimizing heap options.
The old generation does not have the space overhead of a to-space, but its garbage collector runs more slowly and reclaims fewer objects. The trigger for running the old generation collector is a young generation collection that does not reclaim sufficient space. For the best user experience, the old generation collector should run infrequently, which can be realized by making youngGen large enough. The old generation collector marks live objects, compacts them starting at the young generation boundary, and updates references to refer to the new object locations.
The virtual machine expands the old generation when, following an old generation garbage collection, the region occupied by old objects is larger than the "high water mark". The high water mark indicates how much heap space was previously used by live objects. Old generation expansion stops at the bound set by -Xmxsize.
Each Java thread has two stacks, one for Java code and one for native code. The size of native stacks is affected by the following options, whose defaults should be changed only if memory is an extremely scarce resource:
-Xopt:stackMinSize
-Xopt:stackMaxSize
-Xopt:stackChunkSize
The Architecture Guide gives the default and permitted values of these options.
By default, the native stack size is set by the target operating system, typically to 1MB. For Linux operating systems, the limit command can change the default. A 1MB stack is much larger than most threads need, but neither is it as wasteful as might appear. On most target devices, unused stack space consumes only page table entries. A 64KB native stack size is reasonable for applications whose native code does not recursively enter Java code.
Depending on the target platform's operating system, you can also change the native default stack size with the -Xsssize option. On some operating systems, this option has no effect. The default value of -Xss is 0, which means the operating system sets the native stack size.
By default, Java class verification is performed at class loading time to insure that a class is well-behaved. For large, trusted applications, you can disable Java class verification as follows:
% cvm -Xverify:none -cp MyApp.jar MyApp
Disabling verification reduces both load time and security. Use it with caution.