| Oracle® Java Micro Edition Software Development Kit Developer's Guide Release 3.2 for Windows E24265-04 |
|
 Previous |
 Next |
| Oracle® Java Micro Edition Software Development Kit Developer's Guide Release 3.2 for Windows E24265-04 |
|
 Previous |
 Next |
The Oracle Java ME SDK supports performance profiling for Java ME applications. The profiler keeps track of every method in your application. For a particular emulation session, it figures out how much time was spent in each method and how many times each method was called.
The SDK supports offline profiling. Data is collected during the emulation session. After you close the emulator you can export the data to a .nps file you can load and view later. As you view the snapshot you can investigate particular methods or classes and save a customized snapshot (a .png file) for future reference.
You can start a profiling session from the NetBeans IDE, as described in Section 9.1, "Collecting and Saving Profiler Data in the IDE", or from the command line, as discussed in Section 14.3.4, "Command Line Profiling". It is important to understand that profiling data produced from the command line has a different format (*.prof) than data produced from the NetBeans profiler (a.nps file).
|
Note: This feature might slow the execution of your application. |
Profiling data from Oracle Java ME SDK projects is displayed in a tab in the IDE. The NetBeans IDE has a Profiling window (Window > Profiling > Profiler) but it is not discussed here. Because only performance profiling is supported, the Profiler window has limited usefulness for Java ME applications.
This procedure describes interactive profiling. (To run profile an application from the command line, see Section 14.3.4, "Command Line Profiling".)
|
Note: The profiler maintains a large amount of data, so profiled MIDlets place greater demands on the heap. To increase the Heapsize property, see Section 6.4, "Setting Device Properties". |
In the Projects widow, right-click on the project you want to profile and select Profile.
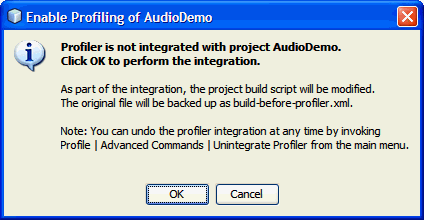
If this is the first time profiling this project you are prompted to integrate the profiler. Click Yes to perform the integration.

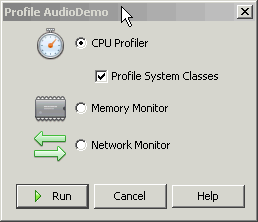
The profiler attaches. You are prompted for the running options.

Choose the CPU Profiler, and optionally check Profile System Classes. Press Run.
The emulator opens with your application running.
Interact with the application MIDlet(s) as you normally would.
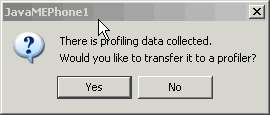
Exit the MIDlet. You are prompted to display the saved data in a profiler:

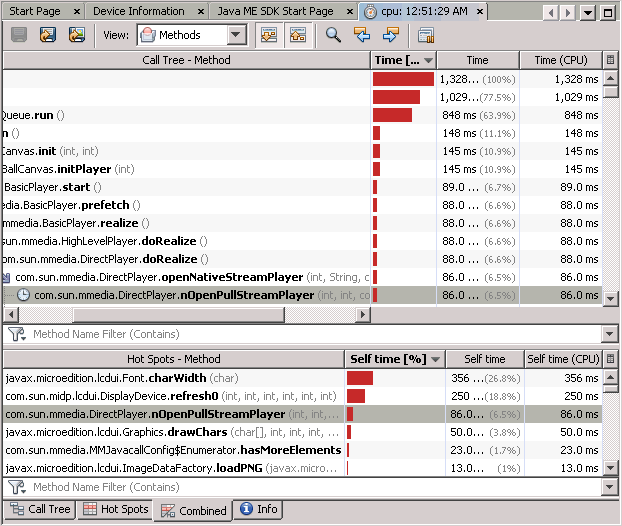
If you choose Yes the profile data is automatically displayed in a tab labeled cpu:time, where time is the time the data was displayed.

To export the profile data, press the Export icon and supply a .nps file name and location. This data can be reloaded at a later time. See Section 9.2, "Loading a .nps File".

To the save the current view to a .png file, press the "Save current view to image" icon and supply a file name and location.

A previously exported .nps file (Section 9.1, "Collecting and Saving Profiler Data in the IDE") can be loaded at a later time.
Follow these steps to retrieve profile data:
Select Profile > Load Snapshot...
Choose the .nps file.
The Profiler opens in its own tab labeled cpu:filename. Click the Info tab at the bottom of the Method table to view the snapshot.
|
Note: The profiling values obtained from the emulator do not reflect actual values on a real device. |
A .prof file created from the command line (Section 14.3.4, "Command Line Profiling") can be loaded from the NetBeans IDE. A command line profiling session command might look like:
emulator.exe -Xdevice:JavaMEPhone1
-Xdescriptor:"C:\Documents and Settings\user\My Documents\NetBeansProjects\UIDemo\dist\Games.jad" -Xprofile:file=C:\temp\UIDemo.prof
Files created from the command line are formatted differently from the .nps files created as described in Section 9.1, "Collecting and Saving Profiler Data in the IDE".
Follow these steps to retrieve command line profile data from the IDE:
Select Profile > Java ME > Import CPU Profiler Snapshot...
Choose the .prof file.
The Profiler displays the data in its own tab labeled cpu:filename.
When the file has been loaded it can be saved in the .nps format. Click the Export to... icon and supply a file name and location.