10 Monitoring Oracle Fusion Middleware
This chapter describes how to monitor Oracle Fusion Middleware using Fusion Middleware Control, Oracle WebLogic Server Administration Console, and the command line.
It describes the following sections:
10.1 Monitoring the Status of Oracle Fusion Middleware
Monitoring the health of your Oracle Fusion Middleware environment and ensuring that it performs optimally is an important task for the administrator.
Oracle Fusion Middleware provides the following methods for monitoring the status of your environment:
-
Fusion Middleware Control: You can monitor the status of Oracle WebLogic Server domains, clusters, servers, Java components, system components, and applications. Navigate to the entity's home page, for example, to the home page for an Oracle HTTP Server instance.
-
Oracle WebLogic Server Administration Console: You can monitor the status of Oracle WebLogic Server domains, clusters, servers, Java components, and applications. From the Administration Console, navigate to the entity's page. See "Overview of the Administration Console" in Understanding Oracle WebLogic Server for information on monitoring using the console.
-
The command line: You can monitor the status of your environment using the WLST state command.
To monitor the status of Java components, use the WLST
statecommand, with the following format:state(name, type)
For example, to get the status of the Managed Server server1, use the following command:
wls:/mydomain/serverConfig> state('server1','Server')
Current state of "server1": SUSPENDED
To monitor the status of system components, use the WLST
statecommand, with the following format:state('component_name')]For example, to view the status ohs1, use the following command:
state('ohs1')]
Most of the monitoring tasks in this chapter describe how to monitor using Fusion Middleware Control or the command line.
The following topics provide more detail:
10.1.1 Monitoring an Oracle WebLogic Server Domain
You can view the status of a domain, including the servers, clusters, and deployments in the domain from the domain home page of Fusion Middleware Control:
-
From the WebLogic Domain menu, select Home.
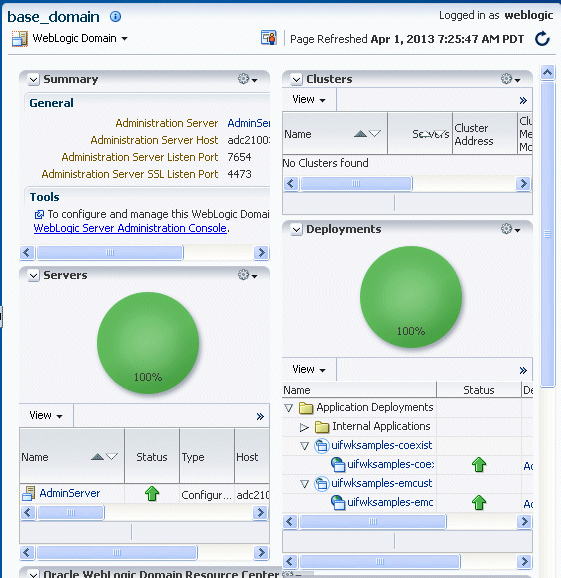
The domain home page is displayed, as shown in the following figure:
Description of the illustration domainpage.gif
This page shows the following:
-
A general summary of the domain, along with a link to the Oracle WebLogic Server Administration Console
-
Information about the servers, both the Administration Server and the Managed Servers, in the domain
-
Information about the clusters in the domain
-
Information about the deployments in the domain
-
A Resource Center, which provides links to more information
For information about monitoring an Oracle WebLogic Server domain using the Oracle WebLogic Server Administration Console, see "Overview of the Administration Console" in the Understanding Oracle WebLogic Server. The Administration Console provides details about the health and performance of the domain.
10.1.2 Monitoring an Oracle WebLogic Server Administration or Managed Server
You can view the status of a WebLogic Server Administration Server or Managed Server in Fusion Middleware Control:
-
From the navigation pane, expand the domain.
-
Select the server.
The server home page is displayed.
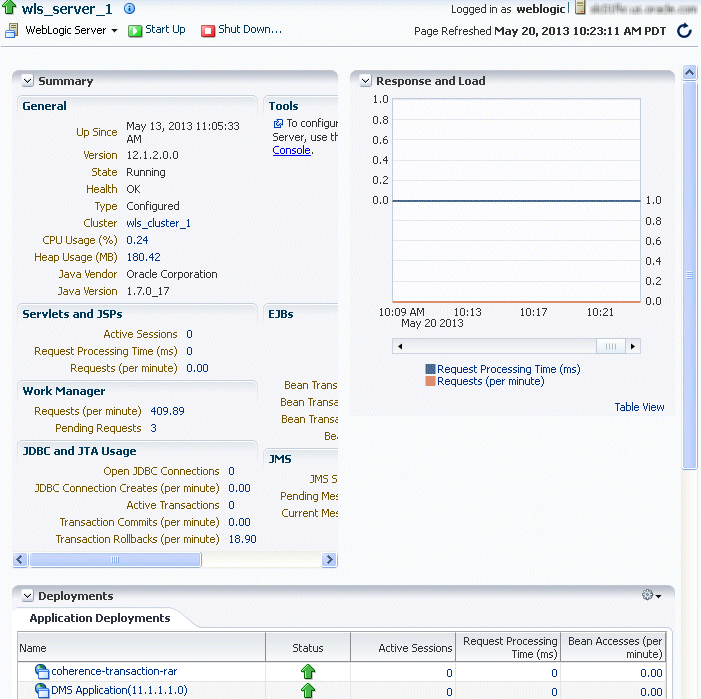
The following figure shows the home page for a Managed Server:
Description of the illustration serverpage.gif
This page shows the following:
-
A general summary of the server, including its state, and information about the servlets, JSPs, and EJBs running in the server
-
Response and load
-
Information about the applications deployed to the server
For information about monitoring servers using the Oracle WebLogic Server Administration Console, see "Overview of the Administration Console" in Understanding Oracle WebLogic Server. The Administration Console provides details about the health and performance of the server.
10.1.3 Monitoring a Cluster
You can view the status of a cluster, including the servers and deployments in the cluster using Fusion Middleware Control:
-
From the navigation pane, expand the domain.
-
Select the cluster.
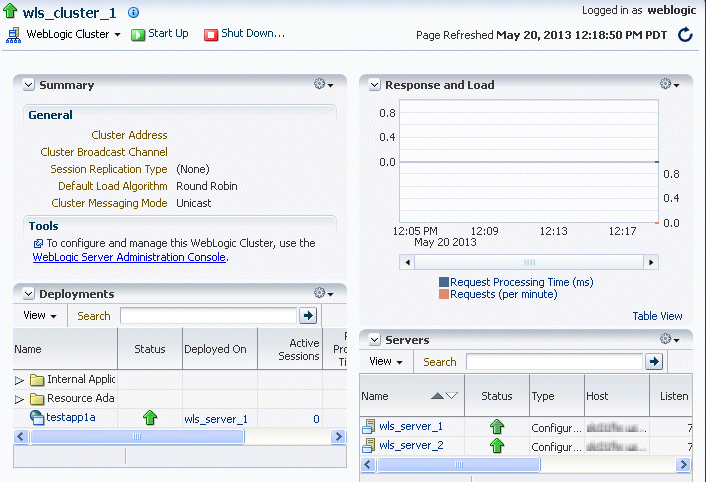
The cluster page is displayed, as shown in the following figure:
Description of the illustration cluster.gif
This page shows the following:
-
A general summary of the cluster, including the broadcast channel, if appropriate, the load algorithm, and the messaging mode
-
A response and load section, which shows the requests per minute and the request processing time
-
A deployments section with information about the applications deployed to the cluster
-
A servers section, with a table listing the servers that are part of the cluster
-
See Also:
"Overview of the Administration Console" in the Understanding Oracle WebLogic Server for information about monitoring a cluster using Oracle WebLogic Server Administration Console. The Administration Console provides details about the health and performance of the cluster.10.1.4 Monitoring a System Component
To monitor a system component, such as Oracle HTTP Server:
-
From the navigation pane, expand Web Tier.
-
Select the component, such as ohs1.
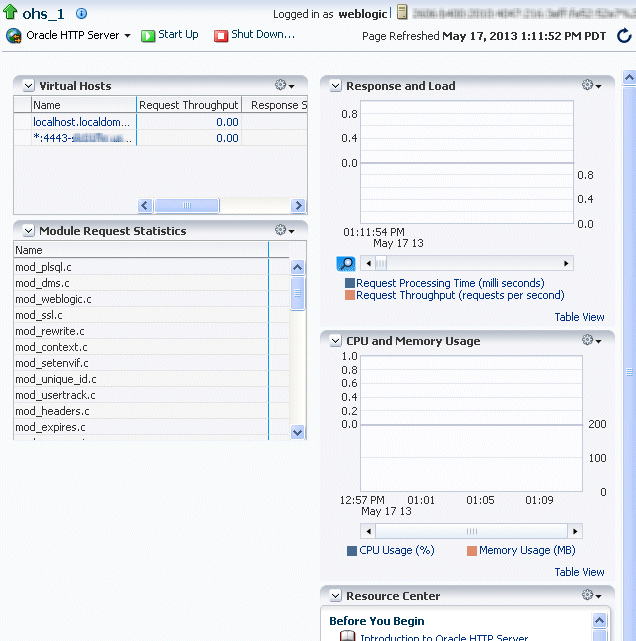
The component home page is displayed, as shown in the following figure:
Description of the illustration ohs_home.gif
This page shows the following:
-
A response and load section, which shows the requests per second and the request processing time
-
CPU and memory usage
-
The virtual hosts, with their names, request throughput and response size.
-
Module request statistics, with a list of modules and the throughput for each.: A table listing the processing time for each module
-
A Resource Center with links to relevant documentation
10.1.5 Monitoring Java EE Applications
To monitor a Java EE application using Fusion Middleware Control:
-
From the navigation pane, expand Application Deployments, then select the application to monitor.
The application's home page is displayed.
-
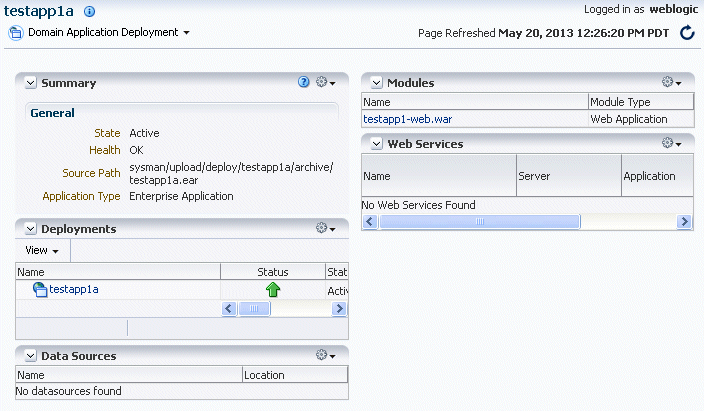
In this page, you can view a summary of the application's status, entry points to the application, Web services and modules associated with the application, and the response and load.
The following figure shows a portion of the application's home page:
Description of the illustration app_home.gif
This page shows the following:
-
A summary of the application, including its state, the Managed Server on which it is deployed, and information about active sessions, active requests, and request processing time
-
A Deployments section, with the application and its status.
-
A list of modules with the type of module for each
-
Response and load, which shows the requests per minute and the request processing time
-
A list of most requested servlets, JSPs, and Web services
10.1.6 Monitoring ADF Applications
To monitor an ADF application:
-
From the navigation pane, expand Application Deployments, then select the application to monitor.
The application's home page is displayed.
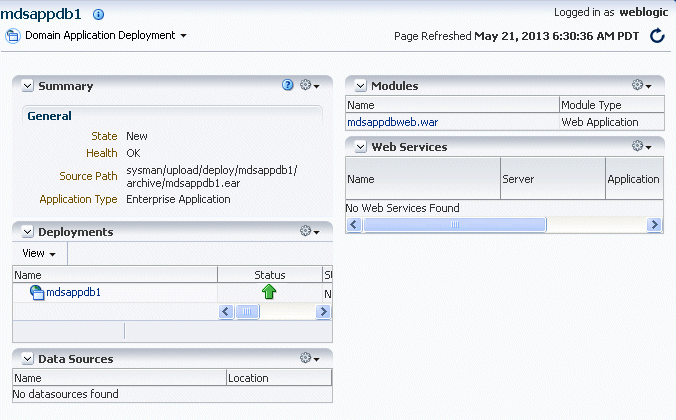
The following figure shows a portion of the application's home page:
Description of the illustration adfapp.gif
-
A summary of the application, including its state, the Managed Server on which it is deployed, and information about active sessions, active requests, and request processing time
-
Deployments, which lists the servers on which the application is deployed.
-
A list of modules with the type of module for each
-
A list of data sources
-
-
To view health of the environment, from the Application Deployments menu choose Monitoring, then Environment Monitoring. The Environment Monitoring page is displayed.
It contains tabs for Health, Query Caching, Workload, and Coherence.
10.1.7 Monitoring Applications Deployed to a Cluster
If you deploy an application to a cluster, Oracle Fusion Middleware automatically deploys the application to each Managed Server in the cluster. As a result, there is an instance of the application on each server.
There are times when you want to monitor the performance of the application on an individual server, and times when you want to monitor the overall performance of the application across all the servers in the cluster.
For example, normally, you would manage the overall performance of the application to determine if there are any performance issues affecting all users of the application, regardless of which instance users access. If you notice a performance problem, you can then drill down to a specific instance of the application to determine if the problem is affecting one or all of the application instances in the cluster.
Fusion Middleware Control provides monitoring pages for both of these scenarios:
-
From the navigation pane, expand Application Deployments.
Fusion Middleware Control lists the applications deployed in the current domain.
-
If an application has been deployed to a cluster, expand the application in the navigation pane. Fusion Middleware Control shows that it is deployed to the cluster application to indicate that it represents more than one instance of the application on the cluster:

Description of the illustration fmc_nav_cluster_app.gif
-
Monitor the overall performance of the application on the cluster by clicking the cluster application, or monitor the performance of the application on a single server by clicking one of the application deployment instances.
10.2 Viewing the Performance of Oracle Fusion Middleware
If you encounter a problem, such as an application that is running slowly or is hanging, you can view more detailed performance information, including performance metrics for a particular target, to find out more information about the problem.
Oracle Fusion Middleware automatically and continuously measures run-time performance. The performance metrics are automatically enabled; you do not need to set options or perform any extra configuration to collect them.
Note that Fusion Middleware Control provides real-time data. If you are interested in viewing historical data, consider using Oracle Enterprise Manager Grid Control.
For example, to view the performance of an Oracle WebLogic Server Managed Server:
-
From the navigation pane, expand the domain.
-
Select the server to monitor.
The Managed Server home page is displayed.
-
From the WebLogic Server menu, choose Monitoring, then Performance Summary.
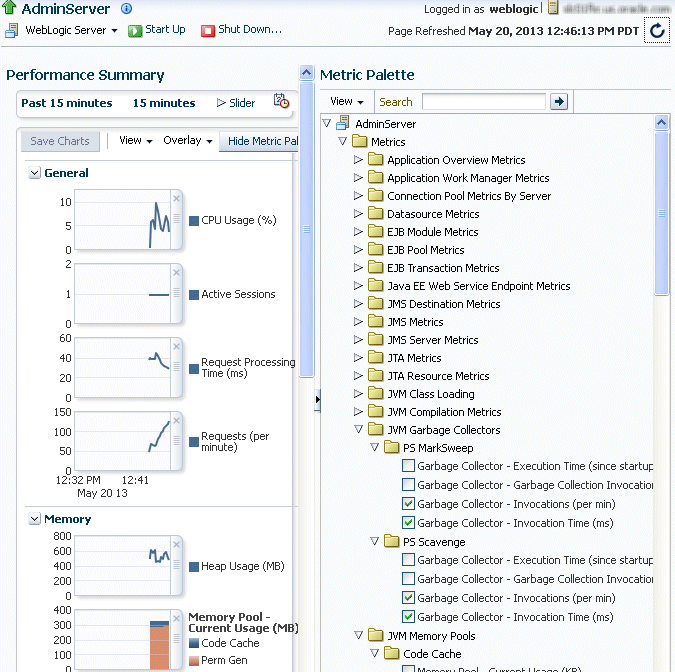
The Performance Summary page is displayed. It shows performance metrics, as well as information about response time and request processing time for applications deployed to the Oracle WebLogic Server.
-
To see additional metrics, click Show Metric Palette and expand the metric categories.
The following figure shows the Performance Summary page with the Metric Palette displayed:
Description of the illustration metrics.gif
-
Select a metric to add it to the Performance Summary.
-
To overlay another target, click Overlay, and select the target. The target is added to the charts, so that you can view the performance of more than one target at a time, comparing their performance.
-
To customize the time frame shown by the charts, you can:
-
Click Slider to display a slider tool that lets you specify that more or less time is shown in the charts. For example, to show the past 10 minutes, instead of the past 15 minutes, slide the left slider control to the right until it displays the last 10 minutes.
-
Select the calendar and clock icon. Then, enter the Start Time and End Time. If there is no data available for those times, a confirmation message displays, explaining the timeline will be automatically adjusted to the time period for which the data is available.
-
You can also view the performance of a components, such as Oracle HTTP Server. Navigate to the component and select Monitoring, then Performance Summary from the dynamic target menu.
10.3 Viewing the Routing Topology
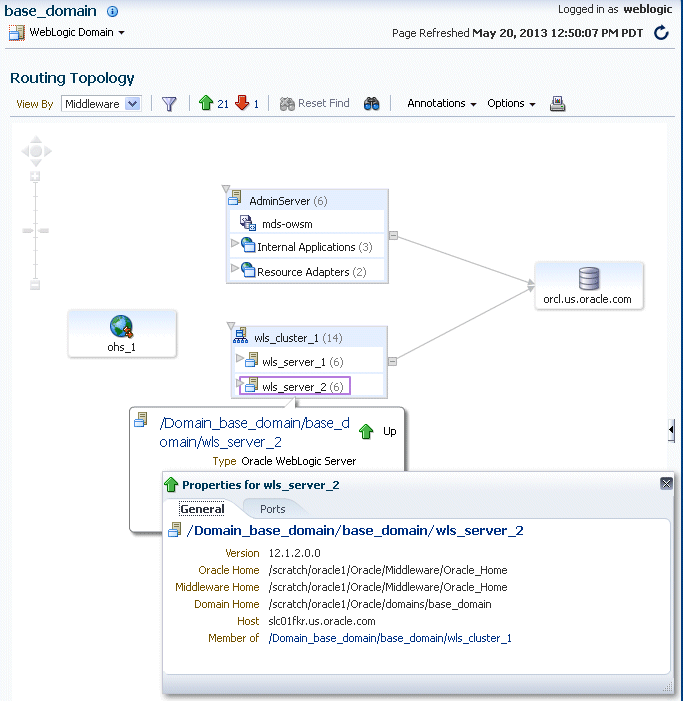
Fusion Middleware Control provides a Topology Viewer for the domain. The Topology Viewer is a graphical representation of routing relationships across components and elements of the domain You can easily determine how requests are routed across components. For example, you can see how requests are routed from Oracle HTTP Server, to a Managed Server, to a data source.
Note:
To view relationships between Oracle WebLogic Server and Oracle HTTP Server, each target must be running and show its status as Up.The Topology Viewer enables you to easily monitor your Oracle Fusion Middleware environment. You can see which entities are up and which are down.
You can also print the topology.
To view the topology:
-
From the WebLogic Domain menu, click Routing Topology.
The Routing Topology page is displayed.
-
The following shows the Routing Topology page with information about the Managed Server:
Description of the illustration topoview.gif
With Topology Viewer, you can also:
-
Choose how to group the routing. From the View menu, you can choose to group by Middleware, host, or application.
-
View the targets by status. Click the green up arrow or the red down arrow at the top of the page. A list of the targets with the specified status is shown.
-
Search for a target within the topology. This makes it easier to find a target if you have many targets. Click the Toggle Find Toolbar. Then, enter the name in the Find box, and click Find.
The Find results box is displayed. Click the target name to highlight the target. The topology is repositioned so you can see the target if it was not previously visible in the viewing area.
You can also specify criteria for the search. From Find, choose the one or more types of Status or one or more of Target Type, or both.
-
Hide or show the status or metrics. From Annotations, click Status or Metrics.
If you select Metrics, one or more key performance metrics for the component are displayed. (You cannot change the metrics that are displayed.)
-
Reposition the topology and change its orientation:
-
To change the orientation, from the Options menu, choose Layout, then Left to Right or Top Down.
-
To reposition the topology, click in the topology, but not on a target or route. Drag the topology to position it.
-
To change what is visible in the topology view, click the arrow in the right-hand bottom corner Then, drag the shaded section in the navigator window, which is located in the bottom right.
-
-
Navigate to the home page of a target. Right-click the target, and select Home.
-
Perform operations directly on the target by right-clicking. The right-click target menu is displayed. For example, from this menu, you can start or stop an Oracle WebLogic Server or view additional performance metrics.
-
View the routing relationships between components. For example, you can view the routing from Oracle HTTP Server to Oracle WebLogic Server. Clicking on the line between the two targets displays the URLs used.