| Oracle Fusion Middleware Data Visualization Tools Tag Reference for Oracle ADF Faces 12c (12.1.3) E41655-01 |
UIComponent class: oracle.adf.view.faces.bi.component.gauge.UIStatusMeterGauge
Component type: oracle.dss.adf.gauge.StatusMeterGauge
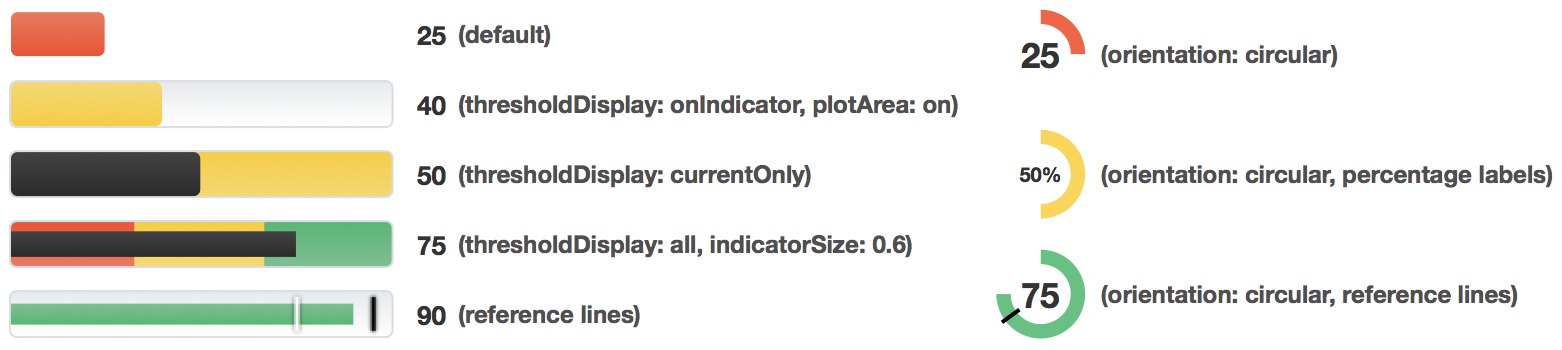
A gauge displaying a metric value, optionally plotted againsts a set of thresholds. The status meter gauge currently supports a horizontal or circular axis.
<dvt:statusMeterGauge value="23" minimum="0" maximum="100">
  <dvt:gaugeThreshold maximum="33"/>
  <dvt:gaugeThreshold maximum="67"/>
  <dvt:gaugeThreshold/>
</dvt:statusMeterGauge>
This component relies on HTML5 technologies available in modern browsers for animations and interactivity. When displayed in older browsers, such as IE8, a PNG image will be displayed. Animations and interactivity are not supported in these browsers.
Animations can be enabled on data change or on initial display by adding af:transition as a child of this component. The following trigger types and transitions are supported:
dataChange: none (default), autodisplay: none (default), autoThe gauge metric label can be configured using dvt:gaugeMetricLabel. For circular status meters, the label size will be optimized to fit within the indicator.
Number formatting options are available through dvt:gaugeMetricLabel.
The plot area displaying the axis extents can be enabled using the plotArea attribute. While the plot area is not necessary when the bounds of the gauge are clearly established, such as when contained within a table cell, it is recommended for all other horizontal status meters.
Reference lines can be added to the status meter gauge using dvt:referenceLine. Reference lines can be used in conjunction with thresholds to display trend information, such as the previous value, and target information at the same time.
<dvt:statusMeterGauge value="23" minimum="0" maximum="100">
  <dvt:referenceLine color="#880000" value="45"/>
</dvt:statusMeterGauge>
Thresholds can be added to the gauge using dvt:gaugeThreshold. The value of the last threshold is automatically specified to be the maximum value of the gauge. The thresholdDisplay attribute can be used to customize how and where the thresholds are shown, such as on the indicator or in the plot area.
Visual effects such as gradients and overlays can be disabled to achieve a flatter look using the visualEffects attribute.
Note: As mentioned in the browser support section, the interactivity features are not supported in older browsers, such as IE8.
Popups and context menus can be displayed using af:showPopupBehavior.
The readOnly attribute can be set to false enabling the end user to change the metric value of the gauge. The value change can be processed using valueChangeListener on the server or the valueChange and input event types on the client.
| Type | Phases | Description |
|---|---|---|
| org.apache.myfaces.trinidad.event.AttributeChangeEvent | Invoke Application, Apply Request Values |
Event delivered to describe an attribute change. Attribute change events are not delivered for any programmatic change to a property. They are only delivered when a renderer changes a property without the application's specific request. An example of an attribute change event might include the width of a column that supported client-side resizing. |
| Name | Type | Supports EL? | Description |
|---|---|---|---|
| attributeChangeListener | javax.el.MethodExpression | Only EL | a method reference to an attribute change listener. Attribute change events are not delivered for any programmatic change to a property. They are only delivered when a renderer changes a property without the application's specific request. An example of an attribute change events might include the width of a column that supported client-side resizing. |
| binding | oracle.adf.view.faces.bi.component.gauge.UIStatusMeterGauge | Only EL |
Specifies a binding reference to store a specific instance of UIStatusMeterGauge from a backing bean. Set this attribute only to access code in a backing bean. For example, to reference a gauge component in the sample managed bean, use the following code: |
| borderColor | String | Yes | Specifies the border color of the gauge indicator. Valid values are RGB hexadecimal. |
| color | String | Yes | Specifies the fill color of the gauge indicator. Valid values are RGB hexadecimal. |
| emptyText | String | Yes | The text of the component when empty. |
| id | String | No | Specifies the identifier for the component |
| indicatorSize | Number | Yes | Default Value: 1.0 The relative size of the indicator. Valid values are between 0 and 1 (default). |
| inlineStyle | String | Yes | Style of the outer element (enclosing div) of the component |
| maximum | Number | Yes | The maximum value for the gauge. |
| minimum | Number | Yes | The minimum value for the gauge. |
| orientation | String | Yes | Valid Values: horizontal, circular Default Value: horizontal Specifies the orientation of the statusmeter:
|
| partialTriggers | String[] | Yes | The IDs of the components that should trigger a partial update. This component will listen on the trigger components. If one of the trigger components receives an event that will cause it to update in some way, this component will request to be updated too. |
| plotArea | String | Yes | Valid Values: auto, on, off Default Value: auto Specifies whether the plot area is displayed:
|
| readOnly | boolean | Yes | Default Value: true Specifies whether the value of the gauge can be changed by the end user. |
| rendered | boolean | Yes | Default Value: true Specifies whether the component is rendered. |
| shortDesc | String | Yes | The short description of this component. This is used to customize the tooltip text. |
| styleClass | String | Yes | Sets a CSS style class to use for this component. |
| thresholdDisplay | String | Yes | Valid Values: onIndicator, currentOnly, all Default Value: onIndicator Specifies the way in which the thresholds are displayed:
|
| value | Number | Yes | The metric value for the gauge. |
| valueChangeListener | javax.el.MethodExpression | Only EL | A method reference to a value change listener |
| visualEffects | String | Yes | Valid Values: none, auto Default Value: auto Specifies whether visual effects such as gradients and overlays are enabled. Valid values are "none" and "auto" (Default). |
