8 Oracle MapViewer Editor
This chapter describes the Oracle MapViewer Editor, also referred to as the Map Editor. It contains essentially the same information as is available in the online help available when you use Oracle Map Editor.
To see the online help, click the Help (question mark) icon in the Map Canvas area toolbar:
MapViewer Editor Concepts and Usage
8.1 MapViewer Editor Concepts and Usage
The Related Topics cover important MapViewer Editor concepts and include a suggested typical workflow to help you get started editing spatial data.
Getting Started: A Typical Workflow
8.1.1 About the MapViewer Editor
Effective with Release 12.1.3, Oracle Map Editor is shipped as a JAR file (mapeditor.jar). You can run it as a standalone Java application if you have a J2SE JDK (Java Development Kit) 1.5 or later installed, by going to the directory containing mapeditor.jar and entering the following command:
% java –jar mapeditor.jar
The MapViewer Editor is a web-based spatial data editing tool. It is distributed as part of the MapViewer EAR file, and can be launched as a Java applet from any web browser once the MapViewer server is up and running. The MapViewer Editor supports multiuser, multisession online data editing capabilities across an enterprise.
The MapViewer Editor assume that the spatial data to be edited consists of two-dimensional (2D) geometries of type SDO_GEOMETRY. Oriented points are supported. However, editing of 3D and LRS (Linear Referencing System) geometries is not fully supported, and editing operations on these objects may produce unknown results (that is, such data might be able to be visualized, but editing operations might not work).
To use the MapViewer Editor effectively, you must understand the concepts explained in the "Spatial Data Types and Metadata" chapter in Oracle Spatial and Graph Developer's Guide.
8.1.2 MapViewer Editor Main Window
The MapViewer Editor has the main window shown in Figure 8-1.
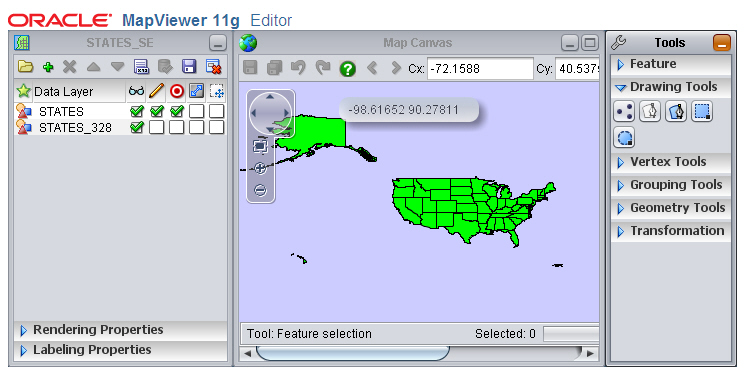
The MapViewer Editor main window has three major areas:
-
The Edit Session Area on the left side (labeled in the figure as
STATES_SE, the current editing session name) enables you to specify operations and settings for the session and data layers, and to override the default rendering and labeling properties. The Rendering Properties and Labeling Properties panels can be expanded and collapsed. -
The Map Canvas Area in the middle is where the map is displayed. The content of this area changes to reflect properties or preferences that you set, tools that you select, and data editing operations that you perform.
-
The Tools Area on the right side contains a set of collapsible panels, each containing a set of tools grouped according to their functions. The panels are for Feature Tools, Drawing Tools, Vertex Tools, Grouping Tools, Geometry Tools, and Transformation Tools.
8.1.3 Editing Sessions
With the MapViewer Editor, an editing session (also referred to as just a session) defines a personal workspace where you, the MapViewer Editor user, can edit spatial data. Each session can contain at least the following information:
-
Name of the session (specified when you create a new session)
-
List of data layers, including background layers and editable tables with spatial geometry data
-
Data table display styles
-
Name of the user that created the session (that is, the session owner)
The session definition is stored persistently in the database where edits for that session will occur. A user can have multiple editing sessions at any given time.
Within each session, you typically add one or more background layers (each of which can be any predefined theme, base map, or tile layer), plus one or more editing layers. The editing layers usually come from the same MapViewer data source (the database schema) or from published features of Web Feature Servers (WFS).
Editing sessions are stored in the USER_SDO_EDIT_SESSIONS view. Before you use the MapViewer Editor, a DBA must run the sdedefinition.sql script, as explained in Section 8.1.4.1, "Installing the USER_SDO_EDIT_SESSIONS View".
8.1.3.1 Editing Mode
To edit spatial data, you just perform certain basic steps as explained in Section 8.1.4, "Getting Started: A Typical Workflow", one of which is to enable editing mode for the session editable layer.
The editable data tables in a session may be rendered differently depending on whether the session editable layer is in editing mode. When you create or reopen a session, the layer is generally not in editing mode. When not in editing mode, the data layers are rendered by the MapViewer server, and the editor application simply displays an image generated by the server.
When you switch the layer session into editing mode, the editable data tables are rendered differently from the other layers (which are still rendered at the server side). These tables are rendered as live vector features ready to be edited. A good practice is to not set to editable mode when too many features are visible, because the application will try to load them on the client side. For editing it is recommended that you work on small areas to avoid bringing too much information to the client.
Any edits made within a session can be saved, and the saved changes, while persisted in the database, are only visible within the same session unless the session is being edited in LIVE workspace. If another user creates a new session that operates on the same data table but on a workspace that is not LIVE, that session will not see the changes made in the first session, and vice versa. Changes are only visible to others when a session with a workspace other than LIVE is merged.
When a session is merged, all the edits made within that session are published to the live data tables, and are visible by any user that queries the table. The session is effectively completed, but it is still stored in the database (for future editing), and it can be purged later.
If a session has saved edits but has not been merged, the editor can reopen it anytime from anywhere, and continue to make edits. It is typical for a session to be kept open for multiple days or even longer.
8.1.3.2 Security and Multiuser Editing Considerations
The MapViewer Editor is designed to be used by multiple users across an organization. The editor itself relies on the MapViewer server for user management and security. When a user launches the editor from the MapViewer home page, that user must be logged in to the server as a Java EE or middleware user with the map_edit_role role. New users can be added to the Java EE container by your administrator, and the required map_edit_role role must be granted. (The map_admin_role role also enables a user to log in and use the MapViewer Editor.)
Each user must create or reopen an editing session, where that user can make changes to the data tables. In a multiuser environment, conflicts between edits across sessions may be unavoidable unless all users coordinate their work and follow clear rules.
8.1.4 Getting Started: A Typical Workflow
This topic describes a typical workflow example that involves making some edits to a spatial data table, using the MVDEMO sample data schema. The basic steps are:
These basic steps illustrate a typical work flow where you create a new session, load an existing geometry table, make a few edits then end the session and merge the changes to the live table if session is versioned.
(Alternatively, after creating a new session, you can also create a new table by clicking on the tree node to create a new geometry layer. You can then add a few background layers and start digitizing new features for your new table.)
8.1.4.1 Installing the USER_SDO_EDIT_SESSIONS View
This one-time task, which must be performed by a DBA, installs the USER_SDO_EDIT_SESSIONS system view that is required by the MapViewer Editor. To perform this installation, run the SQL script file sdedefinition.sql, which is in the MapViewer WEB-INF/admin directory.
The definitions of all editing sessions are stored in the USER_SDO_EDIT_SESSION view. Each session has the following attributes:
-
name: name of the session. -
description: description of the session. -
editor: name of the owner of the session. This name is not the user schema name, but can be any name that identifies the person doing the editing. -
area: name of the area for the session (not currently used). -
workspace: name of then underlying Oracle workspace. The workspace name is automatically assigned when the session is created. If the session is not versioned, the name LIVE is assigned; if the session is versioned, the name is a combination of<editor-name>_<session-name>_<data-source-name>. -
definition: XML description of the session, including the general session attributes and the layer descriptions.
8.1.4.2 Making a MapViewer Data Source Editable
The MapViewer Editor will only load data sources that have been made editable. To make a data source editable, you must modify the <map_data_source> element of the MapViewer configuration file to specify editable="true". For example:
<map_data_source name="mvdemo"
                 jdbc_host="yourhost.com"
                 jdbc_sid="lbsmain"
                 jdbc_port="37407"
                 jdbc_user="mvdemo"
                 jdbc_password="!mvdemo"
                 jdbc_mode="thin"
                 number_of_mappers="3"
                 allow_jdbc_theme_based_foi="true"
                 editable="true"
 />
The default value for the editable attribute is false, which means that the data source is not editable.
8.1.4.3 Allowing Map Data Server Data Streaming
Editable data is streamed from the MapViewer Map Data Server to the client. By default any data source does not allow Map Data Server to stream data from it. In order to allow data to be streamed from a data source, you must modify the <mds_config> element of the MapViewer configuration file and define the subelement <data_source> with values equal to true for data source themes. For example:
<mds_config>

  <data_source name="mvdemo">
     <allow_predefined_themes>true</allow_predefined_themes>
     <allow_dynamic_themes>true</allow_dynamic_themes>
  </data_source>

</mds_config>
8.1.4.4 Launching the MapViewer Editor and Logging In
Before using the MapViewer Editor, ensure that MapViewer is deployed and the mvdemo data source is defined.
-
Go to the MapViewer home page, typically
http://<host>:<port>/mapviewer. -
Click the Editor link in the upper-right corner (between Admin and Help).
-
Log in as the administrative user for the application server (for example,
weblogicfor WebLogic Server).
A loading screen is displayed with a large Java icon. After the loading is complete, the MapViewer Editor Main Window is displayed.
8.1.4.5 Selecting a Data Source and Creating a New Session
Select a data source and create a new editing session.
-
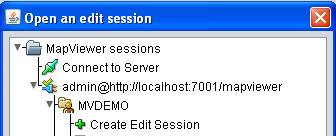
In the Session and Data Layer Operations Toolbar on the left in the Edit Session Area, click the Open an edit session icon to display a dialog box with the editable data sources for this MapViewer server, shown in Figure 8-2.
-
To select a data source on a displayed available server, click it. For example, in the data sources display tree, under
MVDEMO, click the Create Edit Session node. -
In the Create Edit Session dialog box, enter the appropriate information:
Name: Name for the editing session. Example:
STATES_LIVEDescription: Optional descriptive text about the session. Example:
Edit US states dataVersion Enabled: If this option is checked, a new workspace will be created for this session, and any changes can be merged later. If this option is not selected, the session edits will be applied directly to
LIVEdata without any version control. For versioned sessions (notLIVE), the workspace name will be on the form<EDITOR_NAME>_<SESSION_NAME>_<DATASOURCE>, so each versioned session will have its own workspace.Note:
Versioned sessions involve tables that have been version-enabled using Oracle Workspace Manager. For more information, see Oracle Database Workspace Manager Developer's Guide.
If the data source is not on a displayed available server, you can click Connect to Server to display the dialog box shown in Figure 8-3.
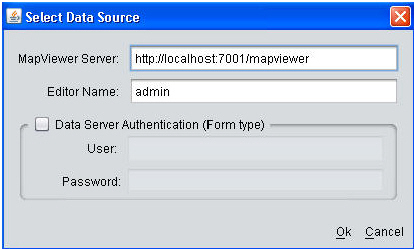
In the Select Data Source dialog box, enter the appropriate information:
-
MapViewer Server: URL of the MapViewer server for the data source.
-
Editor Name: Name of the session owner (to be used to filter the sessions to be displayed).
-
Data Server Authentication (Form Type): If the MapViewer server is a secured server.(with form authentication), check this option and enter the User and Password information.
After you click OK, all edit session names on the specified this server associated with the specified editor name will be loaded into the tree.
8.1.4.6 Adding Data Layers to a Session
Add one or more data layers to the editing session.
-
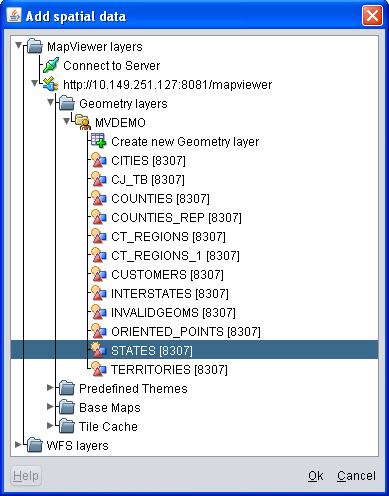
In the Session and Data Layer Operations Toolbar on the left in the Edit Session Area, click the Add spatial data icon to display the Add Spatial Data dialog box.
-
In this dialog box, shown in Figure 8-4, click the desired server, then Geometry layers, then the desired data source (MVDEMO in this example), and then the desired layer (STATES in this example).
[8307] next to each layer indicates that the layer is based on SRID 8307, that is, the WGS 84 longitude-latitude coordinate system. All data used in an editing session must be based on the same SRID.
After you click OK, the MapViewer Editor sets an area for the map based on the metadata information for the layer table, retrieves the area covered by the data, and sets a subset area as the current map area. (If the map area does not contain data, enter other values on the map canvas, such as center X, center Y, and height or scale, and press the Refresh button to redraw the map.)
8.1.4.7 Changing Data Layer Properties
For editable layers based on Oracle tables, you must ensure that Key Column is correctly set for this data, and that it is not ROWID.
When the editable layer is added in the Edit Session Area, the MapViewer Editor automatically checks if the layer table has a primary key, and it sets the Key Column property with this value. If Key Column is set to ROWID, the MapViewer Editor cannot edit the data. In this case, you must set the Key Column property to another column in the table that contains unique values. (It does not have to be the primary key of the table, but it must contain unique values.)
To change the Key Column value:, in the Session and Data Layer Operations Toolbar on the left in the Edit Session Area, click Edit session properties to display a dialog box for editing Session and Layer Preferences.
-
In the Session and Data Layer Operations Toolbar on the left in the Edit Session Area, click Edit session properties to display a dialog box for editing Session and Layer Preferences
-
In the dialog box, for Key Column select a text column that contains unique values. For example, for
STATESthe key column could beSTATE_ABRV(the two-character state abbreviation).
8.1.4.8 Navigating the Map and Enabling Editing Mode
You can use the Navigation Panel in the upper-left corner of the map canvas area to pan the map and to perform zoom (marquee, in, out) operations.
You can use the Data Layers panel in the Edit Session Area on the left to control layer visibility, make layers editable, specify or change the target layer on which editing operations are applied, and make other selections that affect the editing session behavior.
Some suggested steps:
-
Pan to the specific map area that you want to edit and optionally zoom, using the Navigation Panel in the upper-left corner of the map canvas area.
-
For the desired data layer, check the Layer is editable (pencil) icon in the Data Layers panel to enter in editing mode for the layer.
If the session is versioned and a data layer is made editable, the MapViewer Editor checks that the layer base table is versioned using Oracle Workspace Manager; and if it is not versioned, you will need to specify the table's primary key for versioning (if no primary key is defined).
-
For the desired data layer, check the Current editing target (target) icon in the Data Layers panel to specify that any editing will be applied to this layer.
-
Perform some editing operations using the tools in the Tools Area. (See also Selecting a Feature for Editing.)
8.1.4.9 Selecting a Feature for Editing
When the session is in editing or selection mode, as you mouse over the map area, the features are highlighted. When you click on a feature, it becomes selected (with an animated border and transparent interior area), for example, as the U.S. state of Florida is in Figure 8-5.
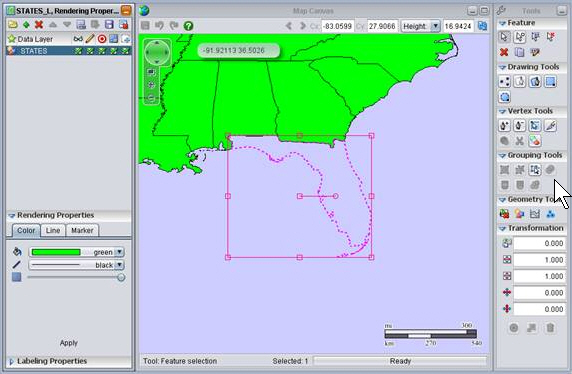
The rendering of the data layer is determined by the choices made in the Rendering Properties panel. The labeling is determined by the choices made in the Labeling Properties panel. Dynamic styles are created based on the choices made in those properties panels.
The MBR (minimum bounding rectangle) of the selected feature (Florida in the preceding figure) has a manipulator around it, with nine squares that you can use to drag and resize this feature. You can also use the small red circle to rotate the feature.
The Tools Area panels in the right side of the window have tools for selection, drawing, vertex editing, grouping, and other operations.
8.1.4.10 Saving and Merging Session Edits
After you have made desired edits, save them by clicking one of these buttons on the Map Canvas Area toolbar:
-
Save edited data in the target layer applies unsaved changes that have been made in the current target layer
-
Save all edited data applies all unsaved changes that have been made in the current session.
It is recommended that you save edits frequently while in editing mode. When a save is requested, the edited data is sent back to server to be committed.
For a versioned session, remember that your edits so far are visible only in your own versioned session; they are not visible to any other users (or sessions).
Note:
Versioned sessions involve tables that have been version-enabled using Oracle Workspace Manager. For more information, see Oracle Database Workspace Manager Developer's Guide.If you are completely done with a versioned session, and ready to make the changes visible to the world, you will need to merge the session by clicking the Merge session visible layers icon in the Session and Data Layer Operations Toolbar near the top in the Edit Session Area on the left. (Only versioned layers are processed; therefore, if you have many layers in the session to be merged, you can work individually on layers by making them visible, while leaving edits on other (non-visible) layers for later.)
For a versioned editing session, once changes are saved, the editable layers base tables can be merged with LIVE data. For a merge, the editable layer the edit session workspace data is compared with current LIVE data; and if a conflict occurs, the Resolve Conflicts dialog box is displayed. For example, Figure 8-6 shows that the large feature in red has a conflict for the GEOMETRY and NAME columns.
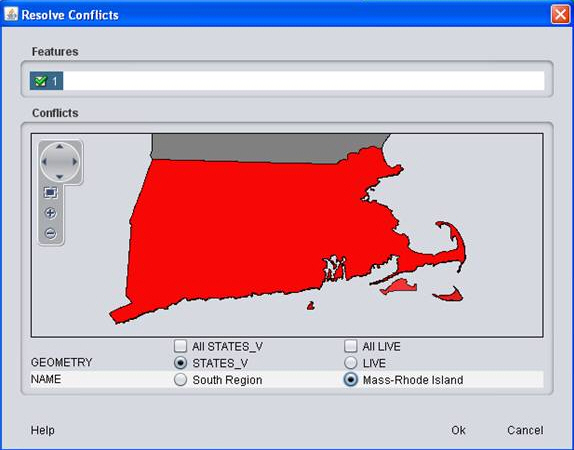
Define how to resolve the conflicts by selecting the version attribute to be used as LIVE data. Note that a feature can have conflicts on both spatial and nonspatial attributes, and you can select values from the different data to resolve the conflicts. In the preceding figure, conflicts are resolved using the GEOMETRY value from the STATES_V editing session and the NAME value from the LIVE data.
When the merge process is executed and finished, the versioned edit session features will have the values selected to resolve the conflicts. The versioned editing session will still exist, but it can be purged later after final merge.
If the layer has many conflicts, you do not need to resolve all of them at once. Every time you work in the Resolve Conflicts dialog box and click OK, the affected conflicts to be resolved are processed in the server; but if the data still has one or more other conflicts, then the merge operation is not executed until all conflicts have been resolved for the layer.
Click Yes to confirm that you want the changes to be merged to the live data table that is visible to all users on the map data. If there are conflicts between versioned data and LIVE data, a merge tool dialog is displayed for resolving the conflicts and for merging the data.
8.2 MapViewer Editor Reference
The reference topics provide information about MapViewer Editor preferences (properties) and the areas of the main window.
MapViewer Editor Concepts and Usage
8.2.1 Session and Layer Preferences
You can edit certain preferences for session and layer properties, to specify the default values for the associated properties. The properties for which you can set preferences are in the following categories:
<session-name> Properties
Control Layer Properties
  Feature Selection
  Drawing Tools
  Vertex Tools
  Background Layer
  Scale Bar Layer
  Manipulator Layer
Data Layer Properties
  <data-layer-name> (one for each data layer)
If you make any changes in any pane and if you want to save these changes, you must click Apply before you switch to another pane or before you click Close to close the Edit Preferences dialog box.
8.2.1.1 <session-name> Properties
Includes options for the editing session.
Logging Level: Level of information for logging: info for basic (limited) information or finest for detailed information. (finest provides more information, but takes longer and requires more disk storage.)
HTTP Timeout: Maximum time in seconds to wait for a response from an HTTP request (for example, when accessing the capabilities of a WFS server).
Use HTTP Proxy: If checked, specifies the host and port of the HTTP proxy server to be used.
8.2.1.2 Control Layer Properties
Includes options for the visual aspects of the editing session, such as colors and sizes for various objects.
For color-related options, click the small box that shows the current default color to display the Choose Color dialog box, in which you can specify a new color using one of several ways: Swatches, HSV, HSL, RGB, or CMYK. For each specification that you make, the Preview area of the dialog box shows how it will appear. To save a specification, click Apply.
8.2.1.2.1 Feature Selection
Mouse over feature color: Color to be displayed for the feature under the mouse location.
Target feature color: Color of selected features of a target layer.
Non-target feature color: Color of selected features of a layer that is not a target layer
Feature element color: Color to highlight geometry elements of a feature. Used for validating and viewing feature geometries.
8.2.1.2.2 Drawing Tools
Cursor center color: Cross marker color inside cursor symbol when drawing.
Cursor border color: Boundary color of cursor symbol when drawing.
Cursor point size: Cursor symbol size in pixels.
Snap point center color: Cross marker color inside cursor symbol when mouse location snaps with a snap layer.
Snap point border color: Boundary color of cursor symbol when mouse location snaps with a snap layer.
Line segment color: Segment color between points when digitizing lines or polygons.
Line segment width: Segment width between points when digitizing lines or polygons.
Rubberband segment color: Line segment color when moving the mouse to digitize points of lines or polygons.
Rubberband segment width: Line segment width when moving the mouse to digitize points of lines or polygons.
8.2.1.2.3 Vertex Tools
Show vertices: Highlights selected feature vertices when moving the mouse around a feature boundary.
Vertex box color: Color of the rectangles representing the vertices.
Vertex box size: Size in pixels of the rectangles representing the vertices.
8.2.1.2.4 Background Layer
Background color for the displayed map area.
8.2.1.2.5 Scale Bar Layer
Show scale bar: Displays the Map Scale Bar.
8.2.1.2.6 Manipulator Layer
Color: Boundary color of the manipulator rectangle.
Snap Highlight Color: Color to highlight a snap point. When a feature is selected and the manipulator rectangle is visible, right-clicking provides an option to set a snap point on the selected feature. This snap point can be used when moving the feature to snap at another location.
Changed Feature Color: Color of the boundary of the feature when it is being moved.
Handle Size: Size in pixels of the manipulator rectangle corner markers.
Hide When Obstructed: Hides the manipulator rectangle when it is covered by another panel.
8.2.1.3 Data Layer Properties
For each data layer, the properties for which you can set preferences depend on the type of data layer:
8.2.1.3.1 Geometry Layer Properties
Contains the Data Set and Rendering tabs.
Data Set tab:
MapViewer Server: URL of the MapViewer server where the layer is defined.
Key Column: Layer key column for editable features. Does not need to be the primary key, but the data values must be unique.
Geometry Column: Name of the geometry column associated with this layer.
Query Condition: Optional condition for filtering the layer features (SQL WHERE clause without the WHERE keyword).
Live Scale: (Not currently used.)
Label Column: If checked, specify the column containing text data to be used to label features.
Shared Boundary: Applies editing operations on other geometry objects that share a boundary with the object being edited.
For example, assume that two property lots share a boundary. If this option is checked and if you edit one property lot to make it larger by modifying the shared boundary, then the other property lot's definition is modified and its size becomes correspondingly smaller. If this option is not checked, then the second lot's definition is not changed (and the two lots' definitions will overlap spatially).
Create Sequence: Creates a new sequence on the MapViewer server.
Rendering tab:
Render in MapViewer when not editable: Displays the layer in MapViewer even when it is not editable. If this option is not checked, the layer is displayed only when it is editable.
8.2.1.3.2 WFS Layer Properties
Key Column: Layer key column for editable features. Does not need to be the primary key, but the data values must be unique. Always FID for WFS 1.0.0 layers,
Geometry Column: Name of the spatial attribute of the WFS feature type.
Label Column: If checked, specify the column containing text data to be used to label features.
Polygon outer ring orientation: Specifies the polygon outer ring orientation. For Oracle Spatial and Graph data, the outer ring orientation is counterclockwise, but for external data served by WFS servers this orientation may be different. This value will be considered when building new polygons. If the polygon outer boundary digitizing has a different orientation than this value, then the coordinates will be automatically reoriented.
Shared Boundary: Applies editing operations on other features that share a boundary with the feature being edited.
For example, assume that two property lots share a boundary. If this option is checked and if you edit one property lot to make it larger by modifying the shared boundary, then the other property lot's definition is modified and its size becomes correspondingly smaller. If this option is not checked, then the second lot's definition is not changed (and the two lots' definitions will overlap spatially).
Capabilities GET URL: URL on the WFS server for GetCapabilities requests.
Version: WFS server version. (Currently only 1.0.0 is supported.)
Authentication: Specifies whether to apply Basic-type Authentication (for a secured WFS server).
8.2.2 Edit Session Area
The Edit Session area on the left side of the MapViewer Editor window enables you to specify operations and settings for the session and data layers, and to override the default rendering and labeling properties. The Rendering Properties and Labeling Properties panels can be expanded and collapsed.
8.2.2.1 Session and Data Layer Operations Toolbar
At the top of the Edit Session area is a toolbar with icons for the following operations:
-
Open an edit session: Displays a dialog box in which you select the editing session to be opened.
-
Add spatial data layer: Displays a dialog box where you can add a spatial data layer to your session. Geometry layers from spatial tables can be edited; predefined themes, base maps, and tile layers are generally used as background layers and cannot be edited.
Expand the MapViewer layers or WFS layers hierarchy to find the desired data layer, then click OK.
-
Remove data layer: Removes the currently selected data layer from the Data Layers area.
-
Move data layer up: Moves the currently selected data layer up one level in the Data Layers area.
-
Move data layer down: Moves the currently selected data layer down one level in the Data Layers area.
-
Edit session properties: Displays a dialog box for editing Session and Layer Preferences.
-
Merge session visible layers (active only for versioned editing sessions) Merges merge layer workspace with LIVE workspace. (See Saving and Merging Session Edits.)
-
Save edit session definition: Saves the current session definition to the USER_SDO_EDIT_SESSIONS view. (See Editing Sessions and Installing the USER_SDO_EDIT_SESSIONS View.)
-
Delete current edit session: Removes the current session definition in the USER_SDO_EDIT_SESSIONS view.
For versioned sessions, this also removes the workspace associated with the session. However, as for versioned layer base tables, if the session layer base table has not been modified in any other workspace, a dialog box is displayed letting you choose whether to unversion the table; however, if the session layer base table has been modified in any other workspace, the table is kept versioned.
8.2.2.2 Data Layers
The Data Layers panel has a header row and a row for each spatial data layer that is available for editing (that has been added and not removed). The header row has columns with icons for each of the following operations, so that you can select and deselect options for individual layers.
-
Layer is visible (glasses icon): Controls whether the layer is visible on the map canvas or not.
-
Layer is editable (pencil icon): Controls whether the layer is editable (that is, is in editing mode for the current editing session).
A layer must be editable before you can modify its spatial data. One or more layers can be editable in a session. When you make a layer editable, the current features for the layer are loaded into the map area (if they are not already loaded) for editing.
-
Current editing target (target icon): Identifies the layer on which editing operations are to be applied.
Only zero or one layers can be the editing target, and a layer must be the editing target before you can modify its spatial data.
-
Snapping to this layer (snap icon): Controls whether the layer is a snap layer, namely, one that can be used to snap vertices when digitizing feature geometry points. In a snap layer, if the mouse pointer moves close enough to an existing vertex, the pointer automatically snaps over to that existing vertex.
Multiple layers can be used as snap layers.
-
Selection occurs on this layer (selection icon): Controls whether the layer is a selection layer.
Selection tools are used in selection layers. Features from one selection layer can be used to generate features in a different target layer, using operations such as union, intersection, and difference. One or more layers can be selection layers. When you make a layer a selection layer, the current features for the layer are loaded into the map area (if they are not already loaded) for selection.
You can use the Session and Data Layer Operations Toolbar to add and remove data layers and to move layers up and down in the display.
8.2.2.3 Rendering Properties
Rendering properties affect the rendering of editable data. Select an editable layer row in the data layer panel, and the contents of the Rendering Properties panel will reflect the current style used by the layer. You can view and modify Color, Line, and Marker properties using the appropriate tabs.
-
For Color, the attributes are fill color, stroke color, and color fill color transparency.
-
For Line, the attributes are fill/stroke color, line width, and fill/stroke color transparency.
-
For Marker, the attributes are marker type, fill color, stroke color, marker size, and fill color transparency.
8.2.2.4 Labeling Properties
Labeling properties affect the labeling of editable data. Select an editable layer row in the data layer panel, and the contents of the Labeling Properties panel will reflect the current style used by the layer.
For Labeling Properties, the attributes are text font, text color, text size, italics, and bold.
8.2.3 Map Canvas Area
The Map Canvas area in the middle of the window is where the map is displayed. The content of this area changes to reflect properties or preferences that you set, tools that you select, and data editing operations that you perform.
At the top of the Map Canvas area is a toolbar with icons for the following operations:
-
Save edited data in the target layer
-
Save all edited data
-
Undo last change
-
Redo last operation
-
Help (question-mark icon)
-
Draw previous map (not currently used)
-
Draw next map (not currently used)
-
Cx and Cy (map center X and Y coordinates in units of the spatial reference system, or SRID; for example, longitude and latitude for WGS 84 data)
-
Height (in units of the SRID) or Scale (in meters for geodetic data) of the Y-axis for the area represented in the map canvas area. For example, at a particular map canvas size and zoom level, and with WGS 84 (longitude/latitude) data, the Height value might be 5.2657 (degrees of latitude) and the corresponding Scale value might be 5,750,861 (meters).
-
Refresh the map preview
8.2.3.1 Navigation Panel
Below the Map Canvas area toolbar and on the left is a navigation panel, shown in Figure 8-7.

-
Use the circle (spinning wheel) to pan the map (rotate and click an arrowhead to move the display in that direction).
-
Use the rectangle to select (press, drag, release) an area to zoom to (sometimes called marquee zoom).
-
Use the plus sign (+) to zoom in.
-
Use the minus sign (-) to zoom out.
8.2.3.2 Map Scale Bar
If you have enabled the Show scale bar property for the Scale Bar Layer, then near the bottom of the map canvas area and on the right is a map scale bar that shows the distance in miles (mi) and kilometers (km) or meters (m) represented by various segments in the bar. Figure 8-8 shows an example.
The distances in the scale bar reflect the current zoom level.
8.2.4 Tools Area
The Tools area on the right side of the MapViewer Editor window contains a set of collapsible panels, each containing a set of tools grouped according to their functions. Specific panels and tools are enabled (visible and usable) depending on the application context. For example, if there is any active editable layer, the selection tools are enabled.
The Tools groups are:
-
Feature Tools (select, deselect, delete, duplicate, and edit feature's attributes)
-
Drawing Tools (create new features by drawing their shapes on the map)
-
Vertex Tools (manipulate individual vertices; split a polygon or perform void-related operations; break an existing line)
-
Grouping Tools (group and ungroup features)
-
Geometry Tools (validate, inspect, simplify, and add a buffer around a geometry)
-
Transformation Tools (scale, rotate, and translate features)
8.2.4.1 Feature Tools
Icons are available for the following tools:
-
Select a feature: Acts both as a generic pointer tool and a single selection tool (when clicking on a feature). When clicking on an area with no feature, it also deselects any currently selected features. When a feature is selected, its outlines become animated and (when the entire feature is within the map viewport) a set of manipulators (small squares) will be displayed around it. The Shift key can be used with the mouse click to deselect a feature if it is selected or to add it to selected list if it is not selected.
The manipulators are a set of markers that can be used to move, scale, or rotate the feature. To move a feature, press and drag the center square mark. To scale feature, press and drag one of the outside square marks. To rotate feature, press and drag the circle mark. Multiple operations can be performed, and then click anywhere outside the feature to effectively apply the changes, or use the Transformation Tools tools to apply the changes.
-
Select multiple features: Can be used to select multiple features by holding and dragging a rectangle on the map. Features that have any interaction with the rectangle are selected. The Shift key can be used with the mouse drag to deselect selected features or to add new selections to the existing selection set.
-
Select features by attribute values: Allows the selection of features based on an attribute value. Displays the Feature Selection by Attribute dialog box, where you can specify the layer base table, the attribute column, the attribute value to be used in selection, and whether to add the result to the existing selections (if any) or to replace the existing selections with the result.
-
Unselect (deselect) features: Deselects the currently selected features.
-
Delete selected features: Deletes the currently selected features.
-
Duplicate selected features: Duplicates selected features.
-
Edit feature attributes: Edits the attributes of the selected feature.
8.2.4.2 Drawing Tools
To make the drawing tools active, check on a layer to be editable and check on a target layer. When creating a new feature using one of these tools, first deselect any selected features if you want the new geometry to be a separate new feature. If you use a feature creation tool while a feature is selected, the default behavior is to append the new geometry to the selected feature.
Icons are available for the following tools:
-
Draw a point: Creates a new point feature. When you click on the map, a new point is created on the map, and a pop-up lets you enter the required key-column value, plus other attribute columns that you may want to populate. If a sequence name is assigned (can be changed in layers property panel), then the key value is automatically populated for the new feature.
-
Draw a line: Creates a new line string feature (one or more linear segment). Use the left mouse button to digitize points, and the right button to end the line string.
-
Draw a polygon: Creates a new polygon feature using linear segments. Use the left mouse button to digitize points, and the right button to end the polygon. The last point will be automatically linked to first point. To add holes (voids) to a polygon, use the corresponding tool under Grouping Tools.
-
Draw a rectangle: Creates a new rectangle feature. Press and drag to the diagonally opposite corner, then release to generate an optimized rectangle.
-
Draw a circle or ellipse: Creates a new circle or ellipse feature. Press and drag, then release to generate the circle or ellipse.
8.2.4.3 Vertex Tools
Vertex tools can be used to manipulate individual vertices. To make the vertex tools active, check on a layer to be editable and check on a target layer.
Icons are available for the following tools:
-
Add a vertex point to a line string: Adds a new vertex to an existing line segment. As you move pointer close to the target line segment, it automatically snaps onto the segment; the snapped highlighted circle is a valid location to add the vertex. Then click to add the new vertex.
-
Remove a vertex point from a line string: Removes an existing vertex. Move the mouse to the vertex (will be highlighted) and click to remove it. You also can press and drag to remove multiple vertices inside the dragging area.
-
Select and move vertex: Moves an existing vertex. Move the mouse to the vertex (snaps will highlight the vertex) and then press and drag the vertex to the new position.
-
Add a void polygon: Creates a new void in an existing polygon. Select a polygon feature and digitize the new void polygon inside the feature polygon. Use the left mouse button to digitize points, and the right button to end the polygon. The last point will be automatically linked to first point.
-
Remove a void from a polygon: Removes an existing void from a polygon. To remove the void, click anywhere inside the void boundary of the selected feature, or press and drag a rectangle that encloses the void polygon.
-
Break a line: Breaks an existing feature line string (simple line) into two lines and generates a new feature. Move the mouse over the line (snaps will highlight break points), and then click to break at the location. A dialog box is displayed for selecting which part will be a new feature and defining the new feature's attributes.
-
Split a polygon: Splits a polygon feature into two features. Move the mouse over polygon boundary (split point will be highlighted), click to get the split point (it turns blue), then click to the next split line points until you click on another boundary split point to end the split line (snaps shows the boundary point highlighted). If a polygon has void elements that are also in the split line path, when you get a split point at the void boundary, the next split line point must be at the same void element boundary. After ending the split, a dialog box is displayed for selecting which part will be a new feature and defining the new feature's attributes.
8.2.4.4 Grouping Tools
Grouping tools are used to perform operations on multiple features and elements. With some of these tools, the target layer may be different from the selection layer. Grouping tools use Oracle Spatial and Graph operations such as union, difference, and intersections.
Icons are available for the following tools:
-
Group features: Groups features. Select one or more features and click this button to group the selected features into a new feature. (A union operation is performed.)
-
Ungroup feature element: (Not currently used.)
-
Remove feature element: Removes one or more feature elements from within a features. To specify multiple elements, drag a rectangle that encloses them, and release.
-
Generate a feature from a union of features: Generates a new feature or updates an existing feature (in the target layer) based on a union of selected features. The selected features list must have features from a layer that is not the current target layer.
For example, assume that layer A is currently the target layer and you want to generate a new feature with the union of features from layer B.
-
Change the selection layer in Data layers panel on the left to layer B.
-
Select one or more features in layer B.
-
Click the Generate a feature from a union of features icon to perform the union operation between the selected features in layer B. If layer A also has a selected feature, then this feature will also be used in the union operation, and the target feature geometry will be updated.
-
-
Generate a feature from an intersection of features: Generates a new feature or updates an existing feature (in the target layer) based on an intersection of selected features. The selected features list must have features from a layer that is not the current target layer.
For example, assume that layer A is currently the target layer and you want to generate a new feature with the intersection of features from layer B.
-
Change the selection layer in Data layers panel on the left to layer B.
-
Select one or more features in layer B.
-
Click the Generate a feature from an intersection of features icon to perform the intersection operation between the selected features in layer B. If layer A also has a selected feature, then this feature will also be used in the intersection operation, and the target feature geometry will be updated.
-
-
Generate a feature from a difference of features: Generates a new feature or updates an existing feature (in the target layer) based on a difference of selected features. The selected features list must have features from a layer that is not the current target layer.
For example, assume that layer A is currently the target layer and you want to generate a new feature with the difference of features from layer B.
-
Change the selection layer in Data layers panel on the left to layer B.
-
Select one or more features in layer B.
-
Click the Generate a feature from a difference of features icon to perform the difference operation between the selected features in layer B. If layer A also has a selected feature, then this feature will also be used in the difference operation, and the target feature geometry will be updated.
-
-
Update target layer geometries with union of features: Updates features in the target layer with union of selected features from a different selection layer.
For example, assume there are two layers, one for States and another one for Counties, with each layer having its individual geometries. Each county feature has an attribute defining the State to which it belongs. You can make changes in county features, and then update the related state geometry with the union of the counties' changes. The results will include any necessary boundary adjustments in both geometry layers. Some sample steps:
-
Make Counties layer the target and the selection layer, and select all counties in State A.
-
Make some changes on these selected features (for example, scale all of them together).
-
Make the State layer the target layer and click the Update target layer geometries with union of features icon. A dialog box for defining the link attributes between the two layers is displayed, where you specify the target layer, target key attribute column, selection layer, and selection join attribute column.
After you click OK, the geometries of the target layer State will be updated with the union of selected features based on the selection join attribute.
-
8.2.4.5 Geometry Tools
Geometry tools are used to perform Oracle Spatial and Graph operations on geometry objects.
Icons are available for the following tools:
-
Validate selected geometries: Validates the selected feature geometries. If any invalid geometry is found, a dialog box is displayed with the invalid Oracle Spatial and Graph codes (For detailed information about geometry validation and error codes, see the reference material about the SDO_GEOM.VALIDATE_GEOMETRY_WITH_CONTEXT function in Oracle Spatial and Graph Developer's Guide.)
Selecting a table row in the dialog box highlights the geometry segment section related to the error. You may be able to use the available MapViewer Editor tools to fix any errors.
-
View geometry elements: Displays a dialog box showing the geometry elements of the selected feature. You can click on a geometry node or one of the elements will highlight its border. You cannot edit the geometry information in this dialog box.
-
Simplify selected geometries: Simplifies selected geometries. For polygon features, it first builds an internal topology to generate single edges between adjacent geometries. Depending on the number of selected geometries, this step may take a while for building the topology. A dialog box with two algorithm options is then shown, and you can simplify all edges or select a subset of edges to simplify. When selecting specific edges, you can also use the Shift key to deselect any previous selection. The available options depend on whether you select the Douglas-Peucker or Visvalingham-Whyatt algorithm.
For Douglas-Peucker (uses the SDO_UTIL.SIMPLIFY function, described in Oracle Spatial and Graph Developer's Guide):
-
Threshold: Minimum distance between vertices to be considered. For geodetic data, this value is in meters; otherwise, it is in data units. Use the bar to define a range of points to be removed. (However, this does not necessarily mean that the algorithm will remove precisely this amount of data.)
-
Simplify: Simplifies the selected geometries.
-
Reset: Undoes the last simplification operation.
-
o % Points: The percentage of original vertices retained after simplification.
For Visvalingham-Whyatt (uses the SDO_UTIL.SIMPLIFYVW function, described in Oracle Spatial and Graph Developer's Guide):
-
o % of points to remove: use bar to define a range of points to be removed. (However, this does not necessarily mean that the algorithm will remove precisely this amount of data.)
-
Taller triangles: Allows taller triangles when applying the flatness filter.
-
o % Points: The percentage of original vertices retained after simplification.
-
-
Generate a buffer feature from the selected feature: Generates a buffer feature around the selected feature. Enter the distance value to generate the buffer. If the data is geodetic, enter the value in meters; otherwise, enter the value in data units.
8.2.4.6 Transformation Tools
Icons are available for the following transformation tools:
-
Rotate selected geometries: Rotates the selected feature geometries with a specified value in degrees.
-
Scale selected geometries in X: Scales the selected feature geometry with a specified factor in the X direction.
-
Scale selected geometries in Y: Scales the selected feature geometry with a specified factor in the Y direction.
-
Translate selected geometries in X: Translates the selected geometries with a specified value in data units in X direction.
-
Translate selected geometries in Y: Translates the selected geometries with a specified value in data units in Y direction.
-
Apply transformation to selected features in target layer: Applies the current transformation to just the selected features of the target layer.
-
Apply transformation to all selected features: Applies the current transformation to all selected features.
-
Reset transformation: Clears the current transformation.