SQL Query Tuning
Query tuning is the most important step to improve performance of any report.
Explain plan, SQL Monitoring, SQL Trace facility with TKPROF are the most basic performance diagnostic tools that can help to tune SQL statements in applications running against the Oracle Database.
Oracle BI Publisher provides a mechanism to generate the explain plan and SQL monitoring reports and to enable SQL session trace. This functionality is applicable to SQL statements executing against Oracle Database only. Logical queries against BI Server or any other type of database are not supported.
Generate Explain Plan
You can generate an Explain plan at the data set level for a single query or at the report level for all queries in a report.
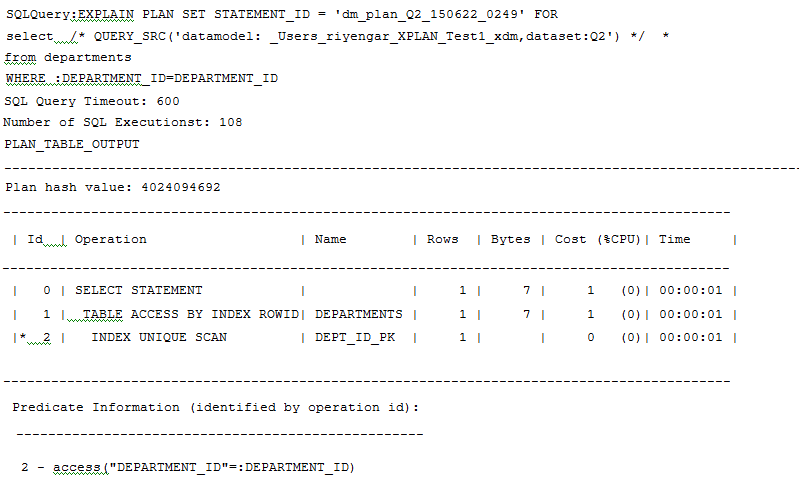
For more information about interpreting the explain plan, see Oracle Database SQL Tuning Guide.
Explain Plan for a Single Query
From the SQL data set Edit dialog you can generate an explain plan before actually executing the query. This provides a best guess estimation of a plan. The query will be executed binding with null values.
Click Generate Explain Plan on the Edit SQL Query dialog. Open the generated document in a text editor like Notepad or WordPad.
Explaining Plan for Reports
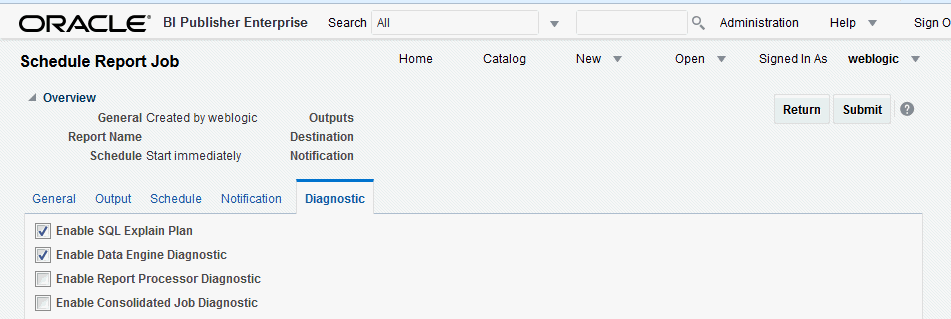
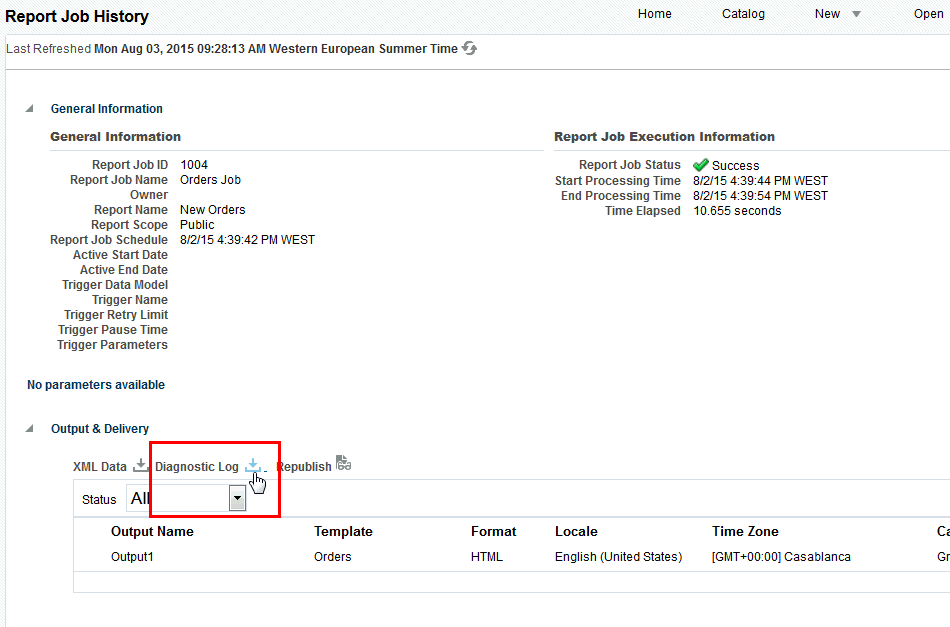
To generate an explain plan for a report, run the report through the Scheduler.
Guidelines for Tuning Queries
Tune queries by following a set of guidelines.
-
Analyze the explain plan and identify high impact SQL statements.
-
Add required filter conditions and remove unwanted joins.
-
Avoid and remove FTS (full table scans) on large tables. Note that in some cases, full table scans on small tables are faster and improve query fetch. Ensure that you use caching for small tables.
-
Use SQL hints to force use of proper indexes.
-
Avoid complex sub-queries and use Global Temporary Tables where necessary.
-
Use Oracle SQL Analytical functions for multiple aggregation.
-
Avoid too many sub-queries in where clauses if possible. Instead rewrite queries with outer joins.
-
Avoid group functions like HAVING and IN / NOT IN where clause conditions.
-
Use CASE statements and DECODE functions for complex aggregate functions.
Tips for Database Tuning
Follow best practices when tuning a database.
-
Work with your Database Administrator to gather statistics on the tables.
-
If the server is very slow, analyze network / IO / Disk issues and optimize the server parameters.
-
In some scenarios when you cannot avoid a large data fetch you may encounter PGA Heap size errors in the database. To resolve these issues, increase PGA heap size as a last resort. Use the following statement to increase heap size:
alter session set events '10261 trace name context forever, level 2097152'


