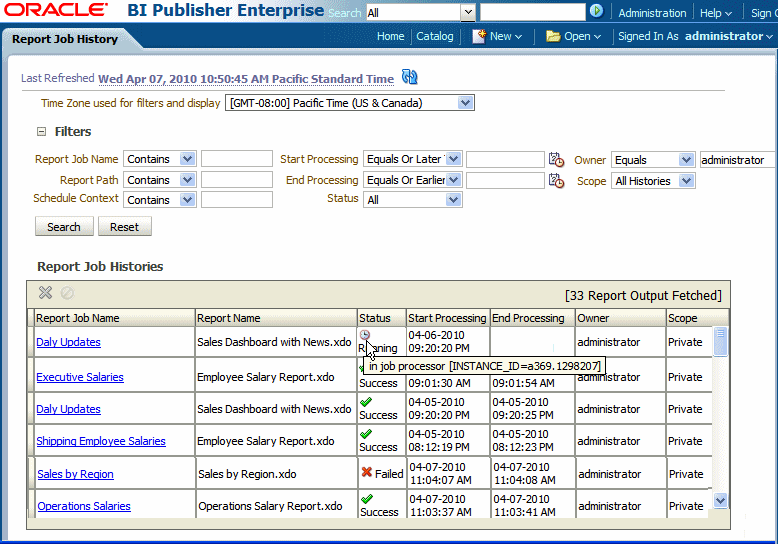
Monitoring Running Jobs
While a job is in running status, you can monitor the stages of the report processing.
To view the status of a job in running status, rest your cursor over the Running status indicator in the Report Job Histories table. The status displays with the instance ID of the cluster instance handling the processing.
Note:
The status does not automatically update while you are viewing the page. To check for updates to the status, refresh the page.
The table below lists the processing stages of a job.
| Processing Stage | Substages |
|---|---|
|
Job Processor |
Sending to Job Queue In job queue In job processor Job processor completed Job processor caused exception |
|
Data Fetching |
Fetching XML Data XML Data Fetched Before calling data model pre-trigger After calling data model pre-trigger Before calling data model post-trigger After calling data model post-trigger |
|
Fetching Bursting Control File (for bursting jobs only) |
Fetching bursting control XML Bursting control xml fetched |
|
Data Processor |
In data processor Parsing control file (applies only to bursting jobs) Control file parsed (applies only to bursting jobs) Cutting data based on split key (applies only to bursting jobs) Data cutting completed (applies only to bursting jobs) Total sub-jobs (applies only to bursting jobs) Data processor completed |
|
Report Processor Once the job reaches this stage, outputs can be viewed as they are completed by clicking the Report Job Name. |
In report processor Rendering report document Report document rendering completed Report processor completed Error rendering report document |
|
Delivery Processor The valid values for |
In Delivering to Document delivered to
|
