Scheduler Diagnostics
The Scheduler diagnostics page provides the runtime status of the scheduler. It provides status of its JMS configuration, JMS queues, Cluster instance status, Scheduler Database status, Toplink status, and Scheduler (Quartz) status.
The Diagnostics page displays how many scheduled report requests have been received by the JMS queues, how many of them have failed and how many are still running. The JMS status can be viewed at the cluster-instance level enabling you to decide whether to add more instances to scale up by one or more of these JMS processors.
For example, if there are too many requests queued up for the e-mail processor in one instance, you can consider adding another instance and enabling it to handle e-mail processing. Similarly, if there are very large reports being processed and showing in the Report Process queue in running status, then you can add another instance to scale up the Report Process capability.
Also, the Scheduler Diagnostics page reflects the status of each component to show if any component is down. You can see the connection string or JNDI name to the database, which cluster instance associates to which managed server instance, Toplink connection pool configuration, and so on.
If an instance shows a failed status, then you can recover the instance and with the failover mechanism of the JMS set up in the cluster, no jobs submitted are lost. When the server instance is brought back, it is immediately available in the cluster for service. The instance removal and addition reflects dynamically on the diagnostic page.
When an instance is added to the cluster, the Scheduler Diagnostics page immediately recognizes the new instance and displays the status of the new instances and all the threads running on that instance. This provides a powerful monitoring capability to the administrator to trace and resolve issues in any instance or any component of the scheduler.
The Scheduler Diagnostics page provides information on the following components:
-
JMS
-
Cluster
-
Database
-
Scheduler Engine
The JMS section provides information on the following:
-
JMS Cluster Config: This section provides configuration information for JMS setup:
-
Provider type (Weblogic / ActiveMQ)
-
WebLogic version
-
WebLogic JNDI Factory
-
JNDI URL for JMS
-
Queue names
-
Temporary directory
-
-
JMS Runtime: This provides runtime status of all JMS queues and topics, as shown in the table below.
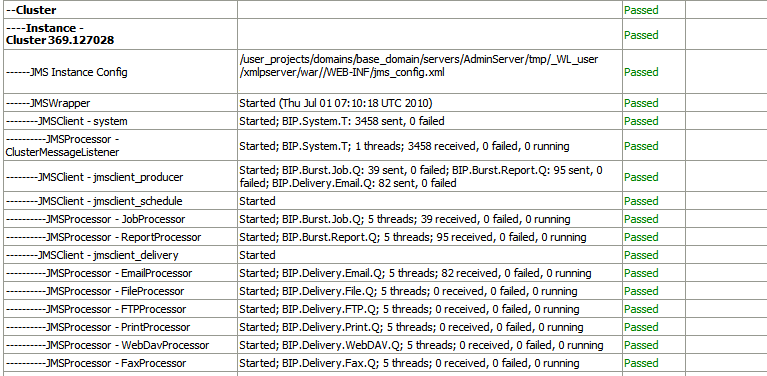
The Cluster section provides details on the cluster instance, as shown in the figure below. Use this information to understand the load on each processor.
-
JMS instance config
-
JMS Wrapper
-
JMS Client - System — Provides status of the BIP System topic. The scheduler diagnostic page is a subscriber to this topic.
-
JMS Client_producer — Not used in this release.
-
JMS Client_schedule — Provides status of the job processor and report processor, each processor showing number of active threads, number of messages received, number of messages failed, and number of messages running.
-
JMS Client_delivery — Provides status of different delivery processors as listeners, each delivery processor showing number of active threads, number of messages received, number of messages failed, and number of messages running.
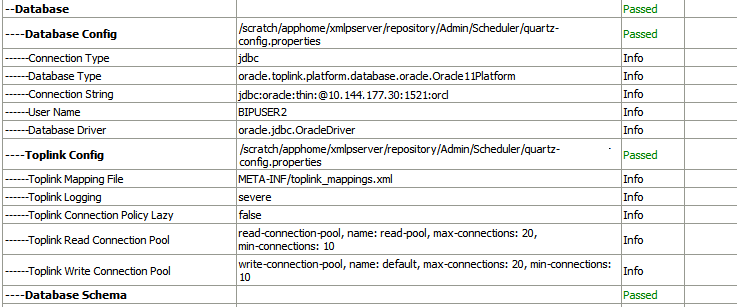
The Database section provides information on these components, as shown in the figure below.
-
Database Config — Connection type, JNDI Name, or connection string
-
Toplink Config — Connection pooling, logging level
-
Database Schema
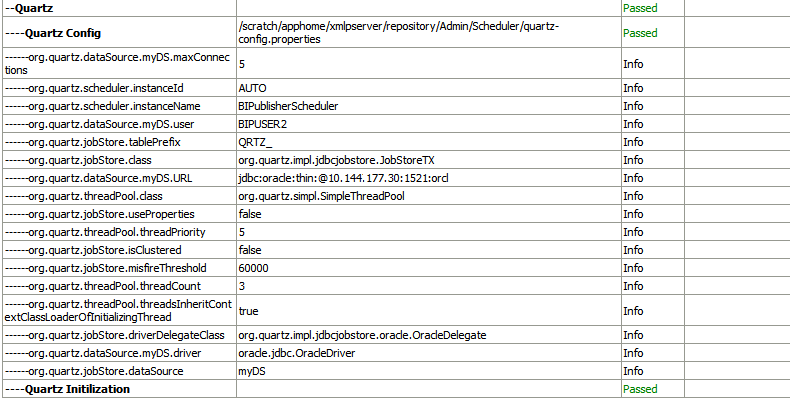
The Quartz section provides information on these components, as shown in the figure below.
-
Quartz Configuration
-
Quartz Initialization
Resolving Quartz Configuration Errors
The following is a common Quartz configuration error in the Scheduler Diagnostics page:
Error Description and Resolution
During the BI Publisher start up (when the WebLogic Managed server or Admin server are started) if the JNDI data source configured as jdbc/bip_datasource is unavailable, then the Quartz initialization will fail. The Scheduler Diagnostics page displays an error for Quartz Configuration.
If this occurs, perform the following:
- Verify that the data source configured as
jdbc/bip_datasourceis available. On the Scheduler Configuration page, click Test Connection to ensure the connection is working. - On the Scheduler Diagnostics page, locate the "Database Schema" diagnostics item and ensure it passed.
- Go back to the Scheduler Configuration page and change the Scheduler Selection from "Quartz" to "None" and click Apply. Now change it back to "Quartz" and click Apply again.
- On the Scheduler Diagnostics page, verify that the Quartz error has cleared.


