9 Building a Summary Report
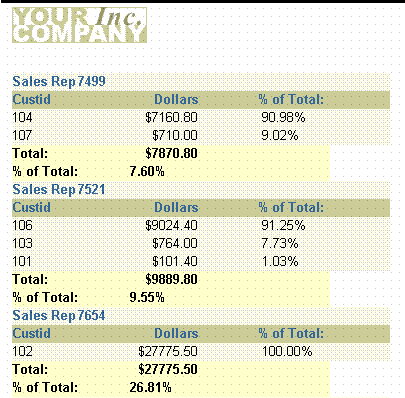
In this chapter, you will learn about summary reports. By following the steps in this chapter, you can generate the report output shown in Figure 9-1.
A summary report contains at least one column whose value or values consist of a summary of other data. A column that totals sales, a column that averages a list of commissions, and a column that shows the maximum amounts found in a series of purchase orders are all examples of summary columns.
-
The value or values in a summary column are calculated by summarizing data retrieved from another column. Reports Builder provides packaged summary functions you can use to compute the values of summary columns.
-
By default, the values of a column summarizing data on a record-by-record basis appear in a default report column, as in the preceding example, where % of Total displays as a default tabular column.
-
The values of a column summarizing data once per set of information (one summary for each break group) appear under the column of values it summarizes.
-
The result of a column calculating one final result appears once at the bottom of the report.
-
The difference between a summary column and the columns in previous introductory reports is that you do not select summary columns from the database. You create the summary columns and add them to groups in your report.
-
To create a summary column, you need to define at least three properties:
-
Source is the name of the column that contains the data on which the summary column performs its computations. The source column remains unchanged.
-
Function is the type of summary to be performed. The function tells Reports Builder how to compute summary column values. The functions provided with Reports Builder are Average, Count, First, Last, Maximum, Minimum, % of Total, Standard Deviation, Sum, and Variance. (If none of the Reports Builder summary functions performs the computation you need for your report, you can create your own functions using PL/SQL.)
-
Reset At is the level or frequency at which the summary columns value returns to zero. The reset level, also known as the reset group, determines when to reset the value of the summary column to zero--in other words, how much of the source column to summarize. You can specify that the summary column summarize all values of the source column for the entire report, you can summarize column values in a break group, or you can summarize column values on a record-by-record basis.
-
This report uses a master/detail layout style.
In this example, you will create a report that displays and summarizes sales data by sales representative. This report includes the following summaries:
-
The total of all orders from all customers for each sales representative.
-
The percentage value of each customer's orders in relation to each sales representative's total orders.
-
The percentage value of each sales representative's orders in relation to the total orders.
-
The grand total of all orders in the report.
As you build this example report, you will:
-
Create a Data Model and a Group Above Layout that includes summaries.
-
Format Fields for monetary values.
-
Examine the Summary Column Properties (optional) created by the Report Wizard.
To see a sample summary report, open the examples folder named summary, then open the Oracle Reports example called summary.rdf. For details on how to access it, see "Accessing the Example Reports" in the Preface.
