3 MapViewer Servers
MapViewer, as a set of Java Enterprise Edition packages, contains a collection of servers to provide mapping services, such as a map server, a map data server, a map tile server, a WMS server (see Appendix E), and a WMTS server (see Appendix F).When you develop Oracle Maps applications, the Oracle Maps API and MapViewer server will identify the needed service and then issue map service request to the proper server. You normally do not need to send service requests explicitly in your map applications; however, if you are familiar with the MapViewer servers described in this chapter, it can help if you need to debug or optimize the application.
Major topics:
3.1 MapViewer Map Server
This major topic explains how to submit map requests in XML format to MapViewer, and it describes the XML document type definitions (DTDs) for the map requests (input) and responses (output). XML is widely used for transmitting structured documents using the HTTP protocol. If an HTTP request (GET or POST method) is used, it is assumed the request has a parameter named xml_request whose value is a string containing the XML document for the request.
(In addition to map requests, the MapViewer XML API can be used for administrative requests, such as adding new data sources. Administrative requests are described in Chapter 5.)
As shown in Figure 1-1 in Section 1.1.1, the basic flow of action with MapViewer is that a client locates a remote MapViewer instance, binds to it, sends a map request, and processes the map response returned by the MapViewer instance.
A request to the MapViewer servlet has the following format:
http://hostname[:port]/MapViewer-servlet-path?xml_request=xml-request
In this format:
-
hostnameis the network path of the server on which MapViewer is running. -
portis the port on which the web server listens. -
MapViewer-servlet-pathis the MapViewer servlet path (for example,mapviewer/omserver). -
xml-requestis the URL-encoded XML request submitted using the HTMLGETorPOSTmethod.
The input XML is required for all requests. The output depends on the content of the request: the response can be either an XML document, or a binary object containing the (generated image) file requested by the user.
In an input request, you must specify a data source, and you can specify one or more of the following:
-
Themes and styles.
-
A center point or a box for the map display, and options such as highlight, label, and styles.
-
A predefined base map, which can be reused and overlaid with custom data.
-
A custom theme with the user data points (or any geometry) retrieved dynamically and plotted directly from an accessible database.
-
Custom features (point, circles, or any geometry) specified in the XML request string to be plotted. These require that you provide the dynamic data in the format of the
<geoFeature>element (described in Section 3.1.2.5), as defined in the DTD. The geometry portion of the<geoFeature>element adopts the Geometry DTD as specified in Open GIS Consortium Geography Markup Language Version 1.0 (OGC GML v1.0). -
Thematic mapping.
You can manage the definition of base maps, themes, and styles (individual symbologies) using the Map Builder tool, which is described in Chapter 7.
For the current release, MapViewer accepts only a coordinate pair to identify the location for a map request; it cannot take a postal address as direct input for a map.
This topic first presents some examples of map requests (see Section 3.1.1), and then presents detailed explanations of the following XML DTDs for requests and other operations:
3.1.1 Map Request Examples
This section provides examples of map requests. It refers to concepts, elements, and attributes that are explained in detail in Section 3.1.2. It contains sections with the following examples:
-
Section 3.1.1.2, "Map Request with Dynamically Defined Theme"
-
Section 3.1.1.3, "Map Request with Base Map, Center, and Additional Predefined Theme"
-
Section 3.1.1.4, "Map Request with Center, Base Map, Dynamically Defined Theme, and Other Features"
-
Section 3.1.1.8, "Map Request with SRID Different from Data SRID"
3.1.1.1 Simple Map Request
Example 3-1 is a very simple map request. It requests a map consisting of a blank blue image (from the mvdemo data source) with the string Hello World drawn on top. (The datasource attribute is required for a map request, even though this specific map request does not retrieve any map data from the data source.)
3.1.1.2 Map Request with Dynamically Defined Theme
Example 3-2 is a simple map request with one dynamically defined theme. It requests a map of all Oracle Spatial and Graph geometries from the COUNTIES table.
Example 3-2 Simple Map Request with a Dynamically Defined Theme
<?xml version="1.0" encoding="UTF-8" ?>
<map_request datasource="lbs_data">
  <themes>
    <theme name="t1">
      <jdbc_query spatial_column = "GEOM"
                  datasource = "lbs_data">
      SELECT geom FROM counties
      </jdbc_query>
    </theme>
  </themes>
</map_request>
3.1.1.3 Map Request with Base Map, Center, and Additional Predefined Theme
Example 3-3 requests a map with a specified center for the result map, and specifies a predefined theme (poi_theme_us_restaurants) to be rendered in addition to the predefined themes that are part of the base map (basemap="us_base").
Example 3-3 Map Request with Base Map, Center, and Additional Predefined Theme
<?xml version="1.0" encoding="UTF-8" ?>
<map_request datasource="lbs_data" title="LBS CUSTOMER MAP"
      basemap="us_base" width="500" height="375"
      bgcolor="#a6cae0" format="GIF_URL">
   <center size="1">
      <geoFeature typeName="mapcenter" label="Motel 1" text_style="T.MOTEL"
         render_style="M.MOTEL" radius="300">
         <geometricProperty>
            <Point>
              <coordinates>-122.2615, 37.5266</coordinates>
            </Point>
         </geometricProperty>
      </geoFeature>
   </center>
   <srs>SDO:8265</srs>
   <themes>
      <theme name="poi_theme_us_restaurants"/>
   </themes>
</map_request>
Notes on Example 3-3:
-
Because
basemapis specified, MapViewer first draws all predefined themes for that base map before drawing the specified theme (poi_theme_us_restaurants). -
The center will be drawn with a marker of the
M.MOTELstyle and the labelMotel 1in theT.MOTELstyle. -
A circle with a radius of 300 meters will be drawn around the center.
3.1.1.4 Map Request with Center, Base Map, Dynamically Defined Theme, and Other Features
Example 3-4 requests a map with a specified center, a predefined theme named theme_lbs_customers, a dynamically defined theme named sales_by_region, and all base themes in the base map us_base_road, plus two features: a polygon representing the top sales region, and a point. The requested map will be stored at the MapViewer host and a URL to that GIF image (format="GIF_URL") will be returned to the requester.
Example 3-4 Map Request with Center, Base Map, Dynamically Defined Theme, Other Features
<?xml version="1.0" encoding="UTF-8" ?>
<map_request datasource="lbs_data2" title="LBS CUSTOMER MAP 2"
      width="400" height="300" format="GIF_URL" basemap="us_base_road">
   <center size="1.5">
      <geoFeature typeName="nil">
         <geometricProperty>
            <Point>
              <coordinates>-122.2615, 37.5266</coordinates>
            </Point>
         </geometricProperty>
      </geoFeature>
   </center>
   <themes>
      <theme name="theme_lbs_customers"/>
      <theme name="sales_by_region">
         <jdbc_query spatial_column ="region"
                           label_column="manager"
                           render_style="V.SALES COLOR"
                           label_style="T.SMALL TEXT"
                           jdbc_host="data.my_corp.com"
                           jdbc_sid="orcl"
                           jdbc_port="1521"
                           jdbc_user="scott"
                           jdbc_password="password"
                           jdbc_mode="thin"
            > select region, sales, manager from my_corp_sales_2001
         </jdbc_query>
      </theme>
   </themes>
   <geoFeature typeName="nil" label="TopSalesRegion"
         text_style="9988" render_style="2837">
      <geometricProperty>
         <Polygon srsName="SDO:8265">
            <outerBoundaryIs>
               <LinearRing>
                  <coordinates>42.9,71.1 43.2,72.3 39.2,73.0 39.0,
                  73.1 42.9,71.1</coordinates>
               </LinearRing>
            </outerBoundaryIs>
         </Polygon>
      </geometricProperty>
   </geoFeature>
   <geoFeature render_style="1397" text_style="9987">
      <geometricProperty>
         <Point>
            <coordinates>-122.5615, 37.3266</coordinates>
         </Point>
      </geometricProperty>
   </geoFeature>
</map_request>
In Example 3-4, sales_by_region is a dynamically defined theme. For information about dynamically defining a theme, see Section 3.1.2.20 and Section 3.1.2.9.
3.1.1.5 Map Request for Point Features with Attribute Value and Dynamically Defined Variable Marker Style
Example 3-5 shows a map request to render point features with a dynamically defined variable marker style. The attribute_values attribute defines the value that will be used to find the appropriate bucket (for the range into which the value falls), as defined in the variable marker style.
Example 3-5 Map Request for Point Features with Attribute Value and Dynamically Defined Variable Marker Style
<?xml version="1.0" standalone="yes"?>
<map_request
  title="Point Features with Variable Marker Style"
  datasource="mvdemo"
  srid="0"
  width="500"
  height="375"
  bgcolor="#a6caf0"
  antialiase="true"
  format="PNG_URL">
  <center size="19.2">
    <geoFeature>
      <geometricProperty typeName="center">
        <Point>
          <coordinates>-116.65,38.92</coordinates>
        </Point>
      </geometricProperty>
    </geoFeature>
  </center>
  <geoFeature
     render_style="varmarkerpf"
     attribute_values="50000.0">
    <geometricProperty>
      <Point>
        <coordinates>-112.0,43.0</coordinates>
      </Point>
    </geometricProperty>
  </geoFeature>
  <geoFeature
     render_style="varmarkerpf"
     attribute_values="125000.0">
    <geometricProperty>
      <Point>
        <coordinates>-123.0,40.0</coordinates>
      </Point>
    </geometricProperty>
  </geoFeature>
  <geoFeature
     render_style="varmarkerpf"
     attribute_values="200000.0">
    <geometricProperty>
      <Point>
        <coordinates>-116.64,38.92</coordinates>
      </Point>
    </geometricProperty>
  </geoFeature>
  <geoFeature
     render_style="varmarkerpf"
   attribute_values="300000.0">
    <geometricProperty>
      <Point>
        <coordinates>-112.0,35.0</coordinates>
      </Point>
    </geometricProperty>
  </geoFeature>
  <styles>
    <style name="varmarkerpf">
        <AdvancedStyle>
           <VariableMarkerStyle basemarker="mkcircle" startsize="10"
                                increment="5">
             <Buckets>
             <RangedBucket label="less than 100k" high="100000.0"/>
             <RangedBucket label="100k - 150k" low="100000.0" high="150000.0"/>
             <RangedBucket label="150k - 250k" low="150000.0" high="250000.0"/>
             <RangedBucket label="250k - 350k" low="250000.0" high="350000.0"/>
              </Buckets>
           </VariableMarkerStyle>
        </AdvancedStyle>
    </style>

    <style name="mkcircle">
      <svg>
        <g class="marker" style="stroke:blue;fill:red;">
          <circle r="20"/>
          </g>
        </svg>
    </style>

  </styles>
</map_request>
3.1.1.6 Map Request with an Image Theme
Example 3-6 requests a map in which an image theme is to be plotted underneath all other regular vector data. The image theme is specified in the <jdbc_image_query> element as part of the <theme> element in a map request. (For an explanation of image themes, see Section 2.3.3.)
Example 3-6 Map Request with an Image Theme
<?xml version="1.0" encoding="UTF-8" ?>
<map_request datasource="lbs_data" title="LBS Image MAP"
  basemap="us_roads" format="GIF_STREAM">
    <center size="1">
      <geoFeature>
        <geometricProperty>
          <Point>
            <coordinates>-122.2615, 37.5266</coordinates>
          </Point>
        </geometricProperty>
      </geoFeature>
    </center>
  <themes>
    <theme name="anImageTheme">
      <jdbc_image_query  image_format="ECW"
                          image_column="image"
                          image_mbr_column="img_extent"
                          jdbc_srid="33709"
                          datasource="lbs_data">
        SELECT image, img_extent, image_id FROM my_images
      </jdbc_image_query>
    </theme>
  </themes>
</map_request>
MapViewer processes the request in Example 3-6 as follows:
-
MapViewer retrieves the image data by executing the user-supplied query (
SELECT image, img_extent, image_id FROM my_images) in the current map window context. -
MapViewer checks its internal list of all registered image renderers to see if one supports the ECW format (
image_format="ECW"). Because MapViewer as supplied by Oracle does not support the ECW format, you must implement and register a custom image renderer that supports the format, as explained in Appendix C. -
MapViewer calls the
renderImagesmethod, and image data retrieved from the user-supplied query is passed to the method as one of its parameters. -
MapViewer retrieves and renders any requested vector data on top of the rendered image.
3.1.1.7 Map Request for Image of Map Legend Only
Example 3-7 requests a map with just the image of the map legend, but without rendering any spatial data. In this example, the legend explains the symbology used for identifying cities, state boundaries, interstate highways, and county population density. (Map legends are explained in Section 3.1.2.11.)
Example 3-7 Map Request for Image of Map Legend Only
<?xml version="1.0" standalone="yes"?>
<map_request
             datasource = "mvdemo"
             format="PNG_URL">

  <legend bgstyle="fill:#ffffff;stroke:#ff0000" profile="MEDIUM" position="SOUTH_EAST">
          <column>
            <entry text="Map Legend" is_title="true"/>
            <entry style="M.STAR" text="center point"/>
            <entry style="M.CITY HALL 3" text="cities"/>
            <entry is_separator="true"/>
            <entry style="C.ROSY BROWN STROKE" text="state boundary"/>
            <entry style="L.PH" text="interstate highway"/>
            <entry text="County population:"/>
            <entry style="V.COUNTY_POP_DENSITY" tab="1"/>
          </column>
  </legend>

</map_request>
Generating just the map legend image, as in Example 3-7, can save processing time if you display the stored map legend image on a web page separately from the actual displayed maps. This avoids the need to generate a legend each time there is a map request.
3.1.1.8 Map Request with SRID Different from Data SRID
Example 3-8 requests a map displayed in a coordinate system (srid="32775" for US - Equal Area Projection) that is different from the coordinate system associated with the county theme data (jdbc_srid="8265" for Longitude/Latitude - NAD 83). As a result, during the rendering process, MapViewer converts all geometries from the data SRID to the map request SRID.
If no coordinate system is associated with the theme data, MapViewer assumes that the data is associated with the coordinate system of the map request, and no conversion occurs.
Example 3-8 Map Request with SRID Different from Data SRID
<?xml version="1.0" standalone="yes"?>
<map_request
  title="US Counties: Equal-Area Projection (SRID=32775)"
  datasource="mvdemo"
  srid="32775"
  width="500"
  height="375"
  bgcolor="#a6caf0"
  antialiase="true"
  format="PNG_URL">
  <center size="4000000.0">
    <geoFeature>
      <geometricProperty typeName="center">
        <Point>
          <coordinates>-218191.9643,1830357.1429</coordinates>
        </Point>
      </geometricProperty>
    </geoFeature>
  </center>
  <themes>
    <theme name="county_th" user_clickable="false">
       <jdbc_query
         spatial_column="geom"
         render_style="C.COUNTIES"
         jdbc_srid="8265"
         datasource="mvdemo"
         asis="false">select geom from counties</jdbc_query>
     </theme>
  </themes>
</map_request>
3.1.1.9 Map Request Using a Pie Chart Theme
This section shows how to use thematic mapping with a pie chart theme. The result is a map in which each county contains a pie chart in which the size of each slice reflects the proportion of the population in a specified household income level category (low, medium, or high) in the county.
The basic steps are as follows.
-
Create an advanced style that defines the characteristics of the pie charts to be used. The following example creates an advanced style named
V.PIECHART1.INSERT INTO user_sdo_styles VALUES ( 'V.PIECHART1', 'ADVANCED', null, '<?xml version="1.0" ?> <AdvancedStyle> <PieChartStyle pieradius="10"> <PieSlice name="low" color="#ff0000"/> <PieSlice name="medium" color="#ffff00"/> <PieSlice name="high" color="#00ff00"/> </PieChartStyle> </AdvancedStyle>', null, null);When the style defined in the preceding example is applied to a geographic feature, a pie chart is created with three slices. The
pieradiusattribute specifies the size of each pie chart in pixels. Each slice (<PieSlice>element) has a color defined for it. Thenameattribute for each slice is ignored by MapViewer. -
Create a new theme that uses the style that you created, as in the following example:
INSERT INTO user_sdo_themes VALUES (
'THEME_PIE_CHART', null, 'COUNTIES', 'GEOM',
'<?xml version="1.0" standalone="yes"?>
<styling_rules>
  <rule column="INC_LOW,INC_MED,INC_HIGH">
    <features style="C.US MAP YELLOW">  </features>
    <label  column="''dummy''" style="V.PIECHART1"> 1 </label>
  </rule>
</styling_rules>');
In the theme definition in the preceding example, the
<label>element of the styling rule specifiesstyle="V.PIECHART1", to indicate that this pie chart style (the style created in Step 1) is used to label each geometry displayed on the map.The column attribute (
column="''dummy''"in this example) is required, even though it has no effect on the resulting map. Thecolumnattribute value can bedummyor any other string, and the value must be enclosed on both sides by two single quotation marks.Because the
V.PIECHART1style is defined with three slices, the preceding example must specify the names of three columns from the COUNTIES table, and these columns must have a numeric data type. The column names are INC_LOW, INC_MED, and INC_HIGH. These columns will supply the value that will be used to determine the size of each pie slice. -
Issue a map request that uses the theme that you created. Example 3-9 requests a map that uses the
THEME_PIE_CHARTtheme that was created in Step 2.
Example 3-9 Map Request Using a Pie Chart Theme
<?xml version="1.0" standalone="yes"?>
<map_request datasource = "mvdemo"
             format="PNG_STREAM">
  <themes>
    <theme name="THEME_PIE_CHART"/>
  </themes>
</map_request>
Figure 3-1 shows part of a display resulting from the map request in Example 3-9.
Figure 3-1 Map Display Using a Pie Chart Theme
Description of ''Figure 3-1 Map Display Using a Pie Chart Theme''
You can also use the pie chart style in a dynamic (JDBC) theme when issuing a map request. You must specify the complete SQL query for a JDBC theme in the map request, because you must identify the attribute columns that are needed by the pie chart style. Any columns in the SELECT list that are not SDO_GEOMETRY columns or label columns are considered to be attribute columns that can be used by an advanced style.
Example 3-10 is a sample request with a JDBC theme using a pie chart style. The SQL query (SELECT geom, 'dummy', sales, service, training FROM support_centers) is included in the theme definition.
Example 3-10 JDBC Theme Using a Pie Chart Style
<?xml version="1.0" standalone="yes"?>
<map_request
             basemap="CA_MAP"
             datasource = "mvdemo"
             format="PNG_URL">
  <themes>
    <theme name="support_center">
     <jdbc_query spatial_column="geom" datasource="tilsmenv"
                                label_column="dummy",
                                label_style="V.PIECHART1">
                SELECT geom, 'dummy', sales, service, training
                FROM support_centers
        </jdbc_query>
    </theme>
  </themes>
</map_request>
3.1.1.10 Map Request Using Ratio Scale and Mixed Theme Scale Modes
Example 3-11 requests a map specifying a center and a ratio scale to define the map area. Two themes are used: a predefined theme named THEME_US_COUNTIES1, which uses the default screen inch scale mode, and a JDBC theme names STATES_TH, which uses the ratio mode.
Example 3-11 Map Request Using Ratio Scale and Mixed Theme Scale Modes
<?xml version="1.0" standalone="yes"?>
<map_request
title="States (ratio), counties (screen inch), center and scale"
datasource="tilsmenv"
width="500"
height="400"
bgcolor="#a6caf0"
antialiase="true"
format="PNG_URL"
>
<center scale="5000000">
  <geoFeature>
    <geometricProperty typeName="center">
      <Point>
        <coordinates>-90.0,32.0</coordinates>
      </Point>
    </geometricProperty>
  </geoFeature>
</center>
<themes>
  <theme name="STATES_TH" min_scale="5.0E7" max_scale="1.0E7" scale_mode="ratio">
     <jdbc_query
       label_column="STATE"
       spatial_column="geom"
       label_style="T.STATE NAME"
       render_style="C.COUNTIES"
       jdbc_srid="8265"
       datasource="tilsmenv"
       asis="false">select geom,state from states
     </jdbc_query>
   </theme>
  <theme name="THEME_US_COUNTIES1" min_scale="2.286" />
</themes>
</map_request>
3.1.1.11 Map Request Using Predefined Theme (Binding Parameter and Custom Type)
Example 3-12 requests a map using a predefined theme with a styling rule that selects all counties where a state abbreviation is in the selection list. When the predefined theme is created, the selection list is represented as a binding parameter, as follows:
INSERT INTO user_sdo_themes VALUES (
    'COUNTIES_BY_STATES', null, 'COUNTIES', 'GEOM',
    '<styling_rules>
    <rule>
        <features style="C.COUNTIES"> (state_abrv in (select column_value from table(:1))) </features>
        <label column="COUNTY" style="T.CITY NAME"> 1 </label>
  </rule>
</styling_rules>');
This binding parameter can accept one or more values, for which you can create a custom SQL data type that represents this set of values, as follows:
CREATE OR REPLACE TYPE string_array AS TABLE OF VARCHAR2(64);
Then, you can use this custom data type on the binding parameter of the map request, as shown in Example 3-12.
Example 3-12 Map Request Using Predefined Theme (Binding Parameter and Custom Type)
<?xml version="1.0" standalone="yes"?>
<map_request
             title="Binding Parameters and STRING_ARRAY type"
             datasource = "mvdemo"
             width="640"
             height="480"
             bgcolor="#a6cae0"
             antialiase="false"
             format="PNG_STREAM">

  <themes>
    <theme name="COUNTIES_BY_STATES" >
     <binding_parameters>
            <parameter value="FL,ME,CA,OH" type="STRING_ARRAY"/>
     </binding_parameters>
     </theme>
  </themes>

</map_request>
3.1.1.12 Map Request Using Advanced Styles and Rendering Rules
Example 3-13 requests a map using the <rendering> element, and it combines two advanced styles that are based on different columns. In this example, an advanced style named POPVMK is based on column POP90, and another advanced style named EQRBRANK is based on column RANK90. Point features (from the CITIES table) are rendered. The shape of the feature is defined by the advanced style associated with column POP90, and the feature color is defined by the advanced style associated with column RANK90.
Example 3-13 Map Request Using Advanced Styles and Rendering Rules
<?xml version="1.0" standalone="yes"?>
<map_request
  title="Cross advanced styles"
  datasource="mvdemo"
  width="640"
  height="480"
  bgcolor="#a6caf0"
  antialiase="false"
  format="PNG_STREAM"
>
  <center size="7.7">
    <geoFeature>
      <geometricProperty typeName="center">
        <Point>
          <coordinates>-72.96,41.25</coordinates>
        </Point>
      </geometricProperty>
    </geoFeature>
  </center>

  <themes>
    <theme name="cities">
       <jdbc_query
         label_column="city"
         spatial_column="location"
         label_style="T.CITY NAME"
         jdbc_srid="8265"
         datasource="mvdemo"
         asis="false">select location,city,pop90,rank90 from cities
       </jdbc_query>
        <rendering>
           <style name="POPVMK" value_columns="POP90">
              <substyle name="EQRBRANK" value_columns="RANK90" changes="FILL_COLOR"/>
           </style>
         </rendering>
     </theme>
  </themes>

  <styles>
   <style name="STAR_TRANSP">
<svg width="1in" height="1in">
    <desc/>
    <g class="marker" style="stroke:#000000;fill:#FF0000;fill-opacity:0;width:15;height:15;font-family:Dialog;font-size:12;font-fill:#FF0000">
        <polyline points="138.0,123.0,161.0,198.0,100.0,152.0,38.0,198.0,61.0,123.0,0.0,76.0,76.0,76.0,100.0,0.0,123.0,76.0,199.0,76.0"/>
  </g>
</svg>
   </style>

   <style name="POPVMK">
     <AdvancedStyle>
       <VariableMarkerStyle basemarker="STAR_TRANSP" startsize="7" increment="5">
        <Buckets>
            <RangedBucket seq="0" label="100217 - 1905803.75" low="100217" high="1905803.75"/>
            <RangedBucket seq="1" label="1905803.75 - 3711390.5" low="1905803.75" high="3711390.5"/>
            <RangedBucket seq="2" label="3711390.5 - 5516977.25" low="3711390.5" high="5516977.25"/>
            <RangedBucket seq="3" label="5516977.25 - 7322564" low="5516977.25" high="7322565"/>
        </Buckets>
       </VariableMarkerStyle>
     </AdvancedStyle>
   </style>

   <style name="EQRBRANK">
     <AdvancedStyle>
       <BucketStyle>
         <Buckets low="1" high="196" nbuckets="4" styles="C.RED,C.RB13_1,C.RB13_6,C.SEQ6_01"/>
       </BucketStyle>
     </AdvancedStyle>
   </style>
  </styles>

  <legend bgstyle="fill:#ffffff;fill-opacity:50;stroke:#ff0000" profile="SMALL" position="SOUTH_EAST">
          <column>
            <entry text="Map Legend" is_title="true" />
            <entry text="POP90:" />
            <entry style="POPVMK" tab="1" />
            <entry text="RANK90:" />
            <entry style="EQRBRANK" tab="1" />
          </column>
  </legend>
</map_request>
3.1.1.13 Map Request Using Stacked Styles
Example 3-14 requests a map using the <rendering> element, and it defines multiple styles (C.COUNTIES and PIECHART1) to be applied on each theme feature.
Example 3-14 Map Request Using Stacked Styles
<?xml version="1.0" standalone="yes"?>
<map_request
  title="Theme with Stacked Styles"
  datasource="mvdemo"
  width="600"
  height="450"
  bgcolor="#a6caf0"
  antialiase="true"
  format="PNG_STREAM"
>
  <center size="18">
    <geoFeature>
      <geometricProperty typeName="center">
        <Point>
          <coordinates>-122.729,40.423</coordinates>
        </Point>
      </geometricProperty>
    </geoFeature>
  </center>
  <themes>
    <theme name="STACKEDSTYLES">
       <jdbc_query
         label_column="state"
         spatial_column="geom"
         label_style="T.STATE NAME"
         jdbc_srid="8265"
         datasource="mvdemo"
         asis="false">select geom,state,HHI0_10,HHI10_15,HHI100UP,HHI15_25,HHI25_35 from states
       </jdbc_query>
        <rendering>
           <style name="C.COUNTIES"/>
           <style name="PIECHART1" value_columns="HHI0_10,HHI10_15,HHI100UP,HHI15_25,HHI25_35"/>
        </rendering>
    </theme>
  </themes>

  <styles>
    <style name="piechart1">
      <AdvancedStyle>
        <PieChartStyle pieradius="10">
           <PieSlice name="A" color="#FFFF00"/>
           <PieSlice name="B" color="#000000"/>
           <PieSlice name="H" color="#FF00FF"/>
           <PieSlice name="I" color="#0000FF"/>
           <PieSlice name="W" color="#FFFFFF"/>
       </PieChartStyle>
     </AdvancedStyle>
    </style>
  </styles>

</map_request>
3.1.1.14 WFS Map Requests
This section contains examples of WFS map requests, one using a predefined theme and one using a dynamic theme.
Example 3-15 requests a map using a predefined WFS theme named BC_MUNICIPALITY, which is defined as follows:
INSERT INTO user_sdo_themes  VALUES (
   'BC_MUNICIPALITY',
   'WFS theme',
   'BC_MUNICIPALITY',
   'THE_GEOM',
'<?xml version="1.0" standalone="yes"?>
<styling_rules theme_type="wfs" service_url="http://www.refractions.net:8080/geoserver/wfs/GetCapabilities?" srs="EPSG:3005">
    <rule>
        <features style="C.BLUE"> </features>
        <label column="name" style="T.CITY NAME"> 1 </label>
  </rule>
</styling_rules>');
Example 3-15 shows a map request that renders this predefined WFS theme.
Example 3-15 Map Request Using Predefined WFS Theme
<?xml version="1.0" standalone="yes"?>
<map_request
             title="Predefined WFS MAP"
             datasource = "mvdemo"
             width="640"
             height="480"
             bgcolor="#a6cae0"
             antialiase="true"
             format="PNG_STREAM">

  <center size="76000">
    <geoFeature>
      <geometricProperty typeName="center">
        <Point>
          <coordinates>1260500,470000</coordinates>
        </Point>
      </geometricProperty>
    </geoFeature>
  </center>

  <themes>
   <theme name="bc_municipality" />
  </themes>

</map_request>
Example 3-16 shows a map request that uses a dynamic WFS theme.
Example 3-16 Map Request Using Dynamic WFS Theme
<?xml version="1.0" standalone="yes"?>
<map_request
             title="WFS MAP"
             datasource = "mvdemo"
             width="640"
             height="480"
             bgcolor="#a6cae0"
             antialiase="true"
             format="PNG_STREAM">

  <center size="76000">
    <geoFeature>
      <geometricProperty typeName="center">
        <Point>
          <coordinates>1260500,470000</coordinates>
        </Point>
      </geometricProperty>
    </geoFeature>
  </center>

   <themes>
   <theme name="wfs" >
     <wfs_feature_request
         service_url="http://www.refractions.net:8080/geoserver/wfs/GetCapabilities?"
         srs="EPSG:3005"
         feature_name="bc_hospitals"
         spatial_column="the_geom"
         render_style="M.STAR"
         label_column="name"
         label_style="T.CITY NAME"
         datasource="mvdemo" />
    </theme>
  </themes>

</map_request>
Example 3-17 shows a map request for a dynamic WFS theme with an advanced style to render features.
Example 3-17 Map Request Using Dynamic WFS Theme with an Advanced Style
<?xml version="1.0" standalone="yes"?>
<map_request
            title="WFS Theme with Advanced Style"
            datasource = "mvdemo"
            width="640"
            height="480"
            bgcolor="#a6cae0"
            antialiase="true"
            format="PNG_STREAM">
 <center size="10.">
    <geoFeature  >
        <geometricProperty typeName="center">
            <Point>
                <coordinates>-70., 44.</coordinates>
            </Point>
        </geometricProperty>
    </geoFeature>
 </center>

 <themes>
  <theme name="wfs" >
    <wfs_feature_request
        service_url="http://199.29.1.81:8181/miwfs/GetFeature.ashx?"
        srs="EPSG:4326"
        feature_name="usa"
        spatial_column="obj"
        render_style="CBSTATES"
        label_column="STATE_NAME"
        label_style="T.CITY NAME"
        feature_attributes="state"
        datasource="mvdemo" />
   </theme>
 </themes>

 <styles>
   <style name="CBSTATES">
     <AdvancedStyle>
      <BucketStyle>
       <Buckets default_style="C.COUNTIES">
           <CollectionBucket seq="0" type="string" style="C.RB13_13">MA</CollectionBucket>
           <CollectionBucket seq="1" type="string" style="C.RB13_1">NH</CollectionBucket>
           <CollectionBucket seq="2" type="string" style="C.RB13_7">ME</CollectionBucket>
      </Buckets>
     </BucketStyle>
    </AdvancedStyle>
   </style>
 </styles>
</map_request>
3.1.1.15 Java Program Using MapViewer
Example 3-18 uses the java.net package to send an XML request to MapViewer and to receive the response from MapViewer. (Note, however, most programmers will find it more convenient to use the JavaBean-based API, described in Chapter 4.)
Example 3-18 Java Program That Interacts with MapViewer
import java.net.*;
import java.io.*;

/**
 * A sample program that shows how to interact with MapViewer
 */
public class MapViewerDemo
{
    private HttpURLConnection mapViewer = null;

    /**
     * Initializes this demo with the URL to the MapViewer server.
     * The URL is typically http://my_corp.com:8888/mapviewer/omserver.
     */
    public MapViewerDemo(String mapViewerURLString)
    {
        URL url;

        try
        {
            url = new URL(mapViewerURLString);
            mapViewer = (HttpURLConnection) url.openConnection();
            mapViewer.setDoOutput(true);
            mapViewer.setDoInput(true);
            mapViewer.setUseCaches(false);
        }
        catch (Exception e)
        {
            e.printStackTrace(System.err);
            System.exit(1);
        }
    }

    /**
     * Submits an XML request to MapViewer.
     * @param xmlreq   the XML document that is a MapViewer request
     */
    public void submitRequest(String xmlreq)
    {
        try
        {
            mapViewer.setRequestMethod("POST");  //Use HTTP POST method.
            OutputStream os = mapViewer.getOutputStream();
            //MapViewer expects to find the request as a parameter
            //named "xml_request".
            xmlreq = "xml_request="+URLEncoder.encode(xmlreq);
            os.write(xmlreq.getBytes());
            os.flush();
            os.close();
        }
        catch (Exception e)
        {
            e.printStackTrace(System.err);
            System.exit(1);
        }
    }

    /**
     * Receives an XML response from MapViewer.
     */
    public String getResponse()
    {
        ByteArrayOutputStream content = new ByteArrayOutputStream();
        InputStream is = null;
        try
        {
            is = mapViewer.getInputStream();
            int c;
            while ((c = is.read()) != -1)
              content.write(c);
            is.close();
            content.flush();
            content.close();
            return content.toString();
        }
        catch (Exception e)
        {
            e.printStackTrace(System.err);
            return null;
        }
    }

    // A simple main program that sends a list_data_sources XML
    // request to MapViewer through HTTP POST
    public static void main(String[] args)
    {
        if(args.length<1)
        {
          System.out.println("Usage: java  MapViewerDemo <mapviewer url>");
          System.out.println("Example: java MapViewerDemo http://my_corp.com/mapviewer/omserver");
          System.exit(1);
        }

        // A sample XML request for MapViewer
        String
        listDataSources = "<?xml version=\"1.0\" standalone=\"yes\"?>" +
                          "  <non_map_request>" +
                          "    <list_data_sources/>" +
                          "  </non_map_request>";

        MapViewerDemo tester = null;
        tester = new MapViewerDemo(args[0]);
        System.out.println("submitting request:\n"+listDataSources);
        tester.submitRequest(listDataSources);
        String response = tester.getResponse();
        System.out.println("response from MapViewer: \n" + response);
    }
}
3.1.1.16 PL/SQL Program Using MapViewer
Example 3-19 is a sample PL/SQL program that sends an XML request to the MapViewer server.
Example 3-19 PL/SQL Program That Interacts with MapViewer
set serverout on size 1000000;

--
--  Author: Clarke Colombo
--
declare

    l_http_req   utl_http.req;
    l_http_resp  utl_http.resp;
    l_url        varchar2(4000):=  'http://my_corp.com:8888/mapviewer/omserver';


    l_value      varchar2(4000);
    img_url      varchar2(4000);
    response     sys.xmltype;

    output       varchar2(255);

    map_req      varchar2(4000);

begin

  utl_http.set_persistent_conn_support(TRUE);

  map_req := '<?xml version="1.0" standalone="yes"?>
  <map_request  title="MapViewer Demonstration"
                datasource="mvdemo"
                basemap="course_map"
                width="500"
                height="375"
                bgcolor="#a6cae0"
                antialiasing="false"
                format="GIF_URL">
    <center size="5">
      <geoFeature>
        <geometricProperty>
          <Point>
            <coordinates>-122.2615, 37.5266</coordinates>
          </Point>
        </geometricProperty>
      </geoFeature>
    </center>
  </map_request>';

  l_http_req := utl_http.begin_request(l_url, 'POST', 'HTTP/1.0');

  --
  -- Sets up proper HTTP headers.
  --
  utl_http.set_header(l_http_req, 'Content-Type', 'application/x-www-form-urlencoded');
  utl_http.set_header(l_http_req, 'Content-Length', length('xml_request=' || map_req));
  utl_http.set_header(l_http_req, 'Host', 'my_corp.com');
  utl_http.set_header(l_http_req, 'Port', '8888');
  utl_http.write_text(l_http_req, 'xml_request=' || map_req);
  --
  l_http_resp := utl_http.get_response(l_http_req);

  utl_http.read_text(l_http_resp, l_value);

  response := sys.xmltype.createxml (l_value);

  utl_http.end_response(l_http_resp);

  img_url := response.extract('/map_response/map_image/map_content/@url').getstringval();

  dbms_output.put_line(img_url);

end;
/
3.1.2 Map Request DTD
The following is the complete DTD for a map request, which is followed by reference sections that describe each element and its attributes.
<?xml version="1.0" encoding="UTF-8"?>
<!-- <box> is defined in OGC GML v1.0 -->
<!ELEMENT map_request ((box | center | bounding_themes)?, srs?, legend?, themes?,
  styles?, scale_bar?, north_arrow?, geoFeature*)>
<!ATTLIST map_request
  datasource    CDATA #REQUIRED
  srid          CDATA #IMPLIED
  basemap       CDATA #IMPLIED
  width         CDATA #IMPLIED
  height        CDATA #IMPLIED
  antialiasing  (TRUE|FALSE) "FALSE"
  imagescaling  (TRUE|FALSE) "TRUE"
  format        (GIF|GIF_URL|GIF_STREAM|JAVA_IMAGE|
                 PNG_STREAM|PNG_URL|PNG8_STREAM|PNG8_URL|
                 JPEG_STREAM|JPEG_URL|PDF_STREAM|PDF_URL|
                 SVG_STREAM|SVGZ_STREAM|SVGTINY_STREAM|
                 SVG_URL|SVGZ_URL|SVGTINY_URL) "GIF_URL"
  transparent   (TRUE|FALSE) "FALSE"
  title         CDATA #IMPLIED
  bgcolor       (CDATA) "#A6CAF0"
  bgimage       CDATA #IMPLIED
  zoomlevels    CDATA #IMPLIED
  zoomfactor    CDATA #IMPLIED
  zoomratio     CDATA #IMPLIED
  initscale     CDATA #IMPLIED
  navbar        (TRUE|FALSE) "TRUE"
  infoon        (TRUE|FALSE) "TRUE"
  onclick       CDATA #IMPLIED
  onmousemove   CDATA #IMPLIED
  rasterbasemap (TRUE|FALSE) "FALSE"
  onrectselect  CDATA #IMPLIED
  onpolyselect  CDATA #IMPLIED
  use_cached_basemap (TRUE|FALSE) "FALSE"
  snap_to_cache_scale (TRUE|FALSE) "FALSE"
  title_style   CDATA #IMPLIED
  footnote      CDATA #IMPLIED
  footnote_style CDATA #IMPLIED
  rotation       CDATA #IMPLIED*
 >
<!ELEMENT center (geoFeature)>
<!ATTLIST center
    size CDATA #REQUIRED
>
<!ELEMENT box (coordinates) >
<!ATTLIST box
    ID                    CDATA #IMPLIED
    srsName               CDATA #REQUIRED
    preserve_aspect_ratio (TRUE|FALSE) "FALSE"
>
<!ELEMENT bounding_themes (#PCDATA) >
<!ATTLIST bounding_themes
    border_margin          CDATA  #IMPLIED
    preserve_aspect_ratio  CDATA  "TRUE"
    size_hint              CDATA  #IMPLIED
>
<!ELEMENT srs (#PCDATA) >

<!ELEMENT themes (theme+) >
<!ELEMENT theme (jdbc_query | jdbc_image_query | jdbc_georaster_query
                            | jdbc_network_query | jdbc_topology_query
                            | map_tile_theme
)? >
<!ATTLIST theme
    name                  CDATA #REQUIRED
    datasource            CDATA #IMPLIED
    max_scale             CDATA #IMPLIED
    min_scale             CDATA #IMPLIED
    label_always_on       (TRUE|FALSE) "FALSE"
    fast_unpickle         (TRUE|FALSE) "TRUE"
    mode                  CDATA #IMPLIED
    min_dist              CDATA #IMPLIED
    fixed_svglabel        (TRUE|FALSE) "FALSE"
    visible_in_svg        (TRUE|FALSE) "TRUE"
    selectable_in_svg     (TRUE|FALSE) "FALSE"
    part_of_basemap       (TRUE|FALSE) "FALSE"
    simplify_shapes       (TRUE|FALSE) "TRUE"
    onclick               CDATA #IMPLIED
    onmousemove           CDATA #IMPLIED
    onmouseover           CDATA #IMPLIED
    onmouseout            CDATA #IMPLIED
    workspace_name        CDATA #IMPLIED
    workspace_savepoint   CDATA #IMPLIED
    workspace_date        CDATA #IMPLIED
    workspace_date_format CDATA #IMPLIED
>
<!ELEMENT jdbc_query (#PCDATA, hidden_info?)>
<!ATTLIST jdbc_query
    asis               (TRUE|FALSE) "FALSE"
    spatial_column     CDATA #REQUIRED
    key_column         CDATA #IMPLIED
    label_column       CDATA #IMPLIED
    label_style        CDATA #IMPLIED
    render_style       CDATA #IMPLIED
    datasource         CDATA #IMPLIED
    jdbc_host          CDATA #IMPLIED
    jdbc_port          CDATA #IMPLIED
    jdbc_sid           CDATA #IMPLIED
    jdbc_user          CDATA #IMPLIED
    jdbc_password      CDATA #IMPLIED
    jdbc_srid          CDATA #IMPLIED
    jdbc_mode          (thin|oci8) "thin"
>
<!ELEMENT hidden_info (field+)>
<!ELEMENT field (#PCDATA)>
<!ATTLIST field
    column  CDATA #REQUIRED
    name    CDATA #IMPLIED
>
<!ELEMENT jdbc_image_query (#PCDATA) >
<!ATTLIST jdbc_image_query
    asis              (TRUE|FALSE) "FALSE"
    image_format      CDATA  #REQUIRED
    image_column      CDATA  #REQUIRED
    image_mbr_column  CDATA #REQUIRED
    image_resolution  CDATA #IMPLIED
    image_unit        CDATA #IMPLIED
    datasource        CDATA #IMPLIED
    jdbc_host         CDATA #IMPLIED
    jdbc_port         CDATA #IMPLIED
    jdbc_sid          CDATA #IMPLIED
    jdbc_user         CDATA #IMPLIED
    jdbc_password     CDATA #IMPLIED
    jdbc_srid         CDATA #IMPLIED
    jdbc_mode         (thin|oci8) "thin"
>
<!ELEMENT jdbc_georaster_query (#PCDATA) >
<!ATTLIST jdbc_georaster_query
    asis               (TRUE|FALSE) "FALSE"
    georaster_table    CDATA #REQUIRED
    georaster_column   CDATA #REQUIRED
    raster_id          CDATA #IMPLIED
    raster_table       CDATA #IMPLIED
    raster_pyramid     CDATA #IMPLIED
    raster_bands       CDATA #IMPLIED
    datasource         CDATA #IMPLIED
    polygon_mask       CDATA #IMPLIED
    transparent_nodata CDATA #IMPLIED
    jdbc_host          CDATA #IMPLIED
    jdbc_port          CDATA #IMPLIED
    jdbc_sid           CDATA #IMPLIED
    jdbc_user          CDATA #IMPLIED
    jdbc_password      CDATA #IMPLIED
    jdbc_srid          CDATA #IMPLIED
    jdbc_mode          (thin|oci8) "thin">
<!ELEMENT jdbc_network_query (#PCDATA) >
<!ATTLIST jdbc_network_query
    asis                    (TRUE|FALSE) "FALSE"
    network_name            CDATA #REQUIRED
    network_level           CDATA #IMPLIED
    link_style              CDATA #IMPLIED
    direction_style         CDATA #IMPLIED
    direction_position      CDATA #IMPLIED
    direction_markersize    CDATA #IMPLIED
    link_labelstyle         CDATA #IMPLIED
    link_labelcolumn        CDATA #IMPLIED
    node_style              CDATA #IMPLIED
    node_markersize         CDATA #IMPLIED
    node_labelstyle         CDATA #IMPLIED
    node_labelcolumn        CDATA #IMPLIED
    path_ids                CDATA #IMPLIED
    path_styles             CDATA #IMPLIED
    path_labelstyle         CDATA #IMPLIED
    path_labelcolumn        CDATA #IMPLIED
    analysis_algorithm      CDATA #IMPLIED
    shortestpath_style      CDATA #IMPLIED
    shortestpath_startnode  CDATA #IMPLIED
    shortestpath_endnode    CDATA #IMPLIED
    shortestpath_startstyle CDATA #IMPLIED
    shortestpath_endstyle   CDATA #IMPLIED
    withincost_startnode    CDATA #IMPLIED
    withincost_style        CDATA #IMPLIED
    withincost_cost         CDATA #IMPLIED
    withincost_startstyle   CDATA #IMPLIED
    datasource              CDATA #IMPLIED
    jdbc_host               CDATA #IMPLIED
    jdbc_port               CDATA #IMPLIED
    jdbc_sid                CDATA #IMPLIED
    jdbc_user               CDATA #IMPLIED
    jdbc_password           CDATA #IMPLIED
    jdbc_srid               CDATA #IMPLIED
    jdbc_mode               (thin|oci8) "thin"
>
<!ELEMENT jdbc_topology_query (#PCDATA)>
<!ATTLIST jdbc_topology_query
    asis               (TRUE|FALSE) "FALSE"
    topology_name      CDATA #REQUIRED
    feature_table      CDATA #REQUIRED
    spatial_column     CDATA #REQUIRED
    label_column       CDATA #IMPLIED
    label_style        CDATA #IMPLIED
    render_style       CDATA #IMPLIED
    datasource         CDATA #IMPLIED
    edge_style         CDATA #IMPLIED
    edge_marker_style  CDATA #IMPLIED
    edge_marker_size   CDATA #IMPLIED
    edge_label_style   CDATA #IMPLIED
    node_style         CDATA #IMPLIED
    node_label_style   CDATA #IMPLIED
    face_style         CDATA #IMPLIED
    face_label_style   CDATA #IMPLIED
    jdbc_host          CDATA #IMPLIED
    jdbc_port          CDATA #IMPLIED
    jdbc_sid           CDATA #IMPLIED
    jdbc_user          CDATA #IMPLIED
    jdbc_password      CDATA #IMPLIED
    jdbc_srid          CDATA #IMPLIED
    jdbc_mode          (thin|oci8) "thin"
>
<!ELEMENT map_tile_theme (#PCDATA)>
<!ATTLIST map_tile_theme
    map_tile_layer      CDATA # REQUIRED
    snap_to_tile_scale  (TRUE|FALSE) "FALSE"
>
<!ELEMENT geoFeature (description?, property*,
 geometricProperty)>
<!ATTLIST geoFeature
   typeName          CDATA #IMPLIED
   id                CDATA #IMPLIED
   render_style      CDATA #IMPLIED
   text_style        CDATA #IMPLIED
   label             CDATA #IMPLIED
   label_always_on   (TRUE|FALSE) "FALSE"
   marker_size       CDATA #IMPLIED
   radius            CDATA #IMPLIED
   attribute_values  CDATA #IMPLIED
   orient_x          CDATA #IMPLIED
   orient_y          CDATA #IMPLIED
   orient_z          CDATA #IMPLIED
   selectable_in_svg (TRUE|FALSE) "FALSE"
   onclick           CDATA #IMPLIED
   hidden_info       CDATA #IMPLIED
>
<!ELEMENT legend column+ >
<!ATTLIST legend
    bgstyle    CDATA #implied
    font       CDATA #implied
    location_x CDATA #implied
    location_y CDATA #implied
    offset_x   CDATA #implied
    offset_y   CDATA #implied
    profile   (MEDIUM|SMALL|LARGE)  "MEDIUM"
    position  (SOUTH_WEST|SOUTH_EAST|SOUTH|NORTH|
              NORTH_WEST|NORTH_EAST|EAST|WEST|CENTER)  "SOUTH_WEST"
>
<!ELEMENT column entry+ >
<!ATTLIST entry
    is_title      (true|false) "false"
    is_separator  (true|false) "false"
    tab           CDATA  "0"
    style         CDATA  #implied
    text          CDATA  #implied
>
<!ELEMENT scale_bar >
<!ATTLIST scale_bar
   mode              (METRIC_MODE|US_MODE|DUAL_MODES) "METRIC_MODE"
   position          (SOUTH_WEST|SOUTH_EAST|SOUTH|NORTH|
                      NORTH_WEST|NORTH_EAST)  "NORTH_EAST"
   offset_y          CDATA #implied
   offset_y          CDATA #implied
   color1            CDATA #implied
   color1_opacity    CDATA #implied
   color2            CDATA #implied
   color2_opacity    CDATA #implied
   length_hint       CDATA #implied
   label_color       CDATA #implied
   label_font_family CDATA #implied
   label_font_size   CDATA #implied
   label_halo_size   CDATA #implied
   label_position    (TOP|BOTTOM) "TOP"
>
<!ELEMENT styles (style+) >
<!ELEMENT style (svg | AdvancedStyle)?>
<!ATTLIST style
    name  CDATA #REQUIRED
>
<!ELEMENT north_arrow (style, location?, size?) >
The main elements and attributes of the map request DTD are explained in sections that follow. The <map_request> element is described in Section 3.1.2.1. The remaining related elements are described, in alphabetical order by element name, in the following sections:
3.1.2.1 map_request Element
The <map_request> element has the following definition:
<!ELEMENT map_request ((box | center | bounding_themes)?, srs?, legend?, themes?,
  styles?, geoFeature*)>
<!ELEMENT map_request ((box | center | bounding_themes)?, srs?, legend?, themes?,
  styles?, geoFeature*, north_arrow?)>
The root element of a map request to MapViewer is always named map_request.
<map_request> can have a child element that is <box> (see Section 3.1.2.3), <center> (see Section 3.1.2.4), or <bounding_themes> (see Section 3.1.2.2), which specifies the range of the user data to be plotted on a map. If none of these child elements is specified, the result map is drawn using all data available to MapViewer.
The optional <srs> child element is ignored by the current version of MapViewer.
The optional <legend> element (see Section 3.1.2.11) is used to draw a legend (map inset illustration) on top of a generated map, to make the visual aspects of the map more meaningful to users.
The optional <themes> element (see Section 3.1.2.21) specifies predefined or dynamically defined themes.
The optional <styles> element (see Section 3.1.2.19) specifies dynamically defined styles.
The <geoFeature> element (see Section 3.1.2.5) can be used to specify any number of individual geometries and their rendering attributes.
The optional <north_arrow> element (see Section 3.1.2.13) is used to draw a north arrow marker based on the request rotation.
MapViewer first draws the themes defined in a base map (if a base map is specified as an attribute in the root element), then any user-provided themes, and finally any geoFeature elements.
3.1.2.1.1 map_request Attributes
The root element <map_request> has a number of attributes, some required and the others optional. The attributes are defined as follows:
<!ATTLIST map_request
  datasource    CDATA #REQUIRED
  srid          CDATA #IMPLIED
  basemap       CDATA #IMPLIED
  width         CDATA #IMPLIED
  height        CDATA #IMPLIED
  antialiasing  (TRUE|FALSE) "FALSE"
  imagescaling  (TRUE|FALSE) "TRUE"
  format        (GIF|GIF_URL|GIF_STREAM|JAVA_IMAGE|
                 PNG_STREAM|PNG_URL|PNG8_STREAM|PNG8_URL|
                 JPEG_STREAM|JPEG_URL|PDF_STREAM|PDF_URL|
                 SVG_STREAM|SVGZ_STREAM|SVGTINY_STREAM|
                 SVG_URL|SVGZ_URL|SVGTINY_URL) "GIF_URL"
  transparent   (TRUE|FALSE) "FALSE"
  title         CDATA #IMPLIED
  title_style   CDATA #IMPLIED
  footnote      CDATA #IMPLIED
  footnote_style CDATA #IMPLIED
  rotation      CDATA #IMPLIED*
  bgcolor       (CDATA) "#A6CAF0"
  bgimage       CDATA #IMPLIED
  zoomlevels    CDATA #IMPLIED
  zoomfactor    CDATA #IMPLIED
  zoomratio     CDATA #IMPLIED
  initscale     CDATA #IMPLIED
  navbar        (TRUE|FALSE) "TRUE"
  infoon        (TRUE|FALSE) "TRUE"
  onclick       CDATA #IMPLIED
  onmousemove   CDATA #IMPLIED
  rasterbasemap (TRUE|FALSE) "FALSE"
  onrectselect  CDATA #IMPLIED
  onpolyselect  CDATA #IMPLIED
  keepthemesorder CDATE #IMPLIED
  use_cached_basemap  (TRUE|FALSE) "FALSE"
  snap_to_cache_scale (TRUE|FALSE) "FALSE"
  title_style   CDATA #IMPLIED
  footnote      CDATA #IMPLIED
  footnote_style CDATA #IMPLIED
  rotation      CDATA #IMPLIED*
>
datasource is a required attribute that specifies a data source. A data source provides information to MapViewer about where to fetch the user data (and the mapping metadata) that is required to render a map.
srid is an optional attribute. If it is specified, it provides the SRID value of the coordinate system (spatial reference system) for the map request. If necessary, theme geometries will be converted to the specified coordinate system before being rendered, although geometries with an undefined coordinate system will not be converted. If this attribute is not specified, MapViewer uses the coordinate system of the first theme to be rendered as the coordinate system for the map request.
basemap is an optional attribute. When it is specified, MapViewer renders all themes that are specified for this base map. The definition of a base map is stored in the user's USER_SDO_MAPS view, as described in Section 2.9.3. Use this attribute if you will always need a background map on which to plot your own themes and geometry features.
width and height are optional attributes that together specify the size (in device units) of the resulting map image. This size is different from the size specified in the center element or box element, which is the range of the window into a user's source data. The default width and height values are 500 and 375 pixels, respectively. The unit is in pixels except for PDF formats, in which case pt is used as the unit, and the relationship with pixels is approximately 1 pt = 1.333 px (or, 1px = 0.75 pt). Thus, for example, if you request a map with size 500x375 "pt" in PDF format, this should generate an image of approximately 667x500 pixels.
antialiasing is an optional attribute. When its value is TRUE, MapViewer renders the map image in an antialiased manner. This usually provides a map with better graphic quality, but it may take longer for the map to be generated. The default value is FALSE (for faster map generation). (For backward compatibility, antialiase is a synonym for antialiasing, but you are encouraged to use antialiasing.)
imagescaling is an optional attribute. When its value is TRUE (the default), MapViewer attempts to scale the images to fit the current querying window and the generated map image size. When its value is FALSE, and if an image theme is included directly or indirectly (such as through a base map), the images from the image theme are displayed in their original resolution. This attribute has no effect when no image theme is involved in a map request.
format is an optional attribute that specifies the file format of the returned map image. The default value is GIF_URL, which is a URL to a GIF image stored on the MapViewer host system.
-
If you specify
GIF, the generated GIF image data is embedded in aMapResponseobject and returned to the client. If you specifyGIF_STREAM, the generated image map content is returned directly to the client through the HTTP MIME typeimage/gif. -
If you specify
JAVA_IMAGE, a Java 2DBufferedImageobject with a color model ofTYPE_INT_RGBis embedded in aMapResponseobject and returned to the client. -
If you specify
PNG_STREAM, the stream of the image in nonindexed PNG format is returned directly; if you specifyPNG_URL, a URL to a nonindexed PNG image stored on the MapViewer host system is returned. (The PNG image format has some advantages over the GIF format, including faster image encoding and true color support.) -
If you specify
PNG8_STREAM, the stream of the image in indexed PNG format is returned directly; if you specifyPNG8_URL, a URL to an indexed PNG image stored on the MapViewer host system is returned. (The PNG image format has some advantages over the GIF format, including faster image encoding and true color support. The indexed PNG format limits the total number of colors available for displaying the map to 256.) -
If you specify
JPEG_STREAM, the stream of the image in JPEG format is returned directly; if you specifyJPEG_URL, a URL to a JPEG image stored on the MapViewer host system is returned. -
If you specify
PDF_STREAM, the stream of the image in PDF document format is returned directly; if you specifyPDF_URL, a URL to a PDF document stored on the MapViewer host system is returned. -
If you specify
SVG_STREAM, the stream of the image in SVG Basic (SVGB) format is returned directly; if you specifySVG_URL, a URL to an SVG Basic image stored on the MapViewer host system is returned. -
If you specify
SVGZ_STREAM, the stream of the image in SVG Compressed (SVGZ) format is returned directly; if you specifySVGZ_URL, a URL to an SVG Compressed image stored on the MapViewer host system is returned. SVG Compressed format can effectively reduce the size of the SVG map by 40 to 70 percent compared with SVG Basic format, thus providing better performance. -
If you specify
SVGTINY_STREAM, the stream of the image in SVG Tiny (SVGT) format is returned directly; if you specifySVGTINY_URL, a URL to an SVG Tiny image stored on the MapViewer host system is returned. (The SVG Tiny format is designed for devices with limited display capabilities, such as cell phones.)
transparent is an optional attribute that applies to indexed PNG (PNG8_STREAM or PNG8_URL) formats only. When its value is TRUE, MapViewer makes the map background color completely transparent. The default value is FALSE.
title is an optional attribute that specifies the map title to be displayed on the top of the resulting map image.
title_style is an optional attribute that specifies the name of the text style to be used when rendering the title.
footnote is an optional attribute that specifies the footnote text to be added on the final map.
footnote_style is an optional attribute that specifies the name of the text style to be used when rendering the footnote.
bgcolor is an optional attribute that specifies the background color in the resulting map image. The default is water-blue (RGB value #A6CAF0). It must be specified as a hexadecimal value.
bgimage is an optional attribute that specifies the background image (GIF or JPEG format only) in the resulting map image. The image is retrieved at runtime when a map request is being processed, and it is rendered before any other map features, except that any bgcolor value is rendered before the background image.
zoomlevels is an optional attribute that specifies the number of zoom levels for an SVG map. The default is 4.
zoomfactor is an optional attribute that specifies the zoom factor for an SVG map. The zoom factor is the number by which to multiply the current zoom ratio for each integer increment (a zoomin operation) in the zoom level. The inverse of the zoomfactor value is used for each integer decrement (a zoomout operation) in the zoom level. For example, if the zoomfactor value is 2 (the default), zooming in from zoom level 4 to 5 will enlarge the detail by two; for example, if 1 inch of the map at zoom level 4 represents 10 miles, 1 inch of the map at zoom level 5 will represent 5 miles. The zoom ratio refers to the relative scale of the SVG map, which in its original size (zoom level 0) has a zoom ratio of 1.
zoomratio is an optional attribute that specifies the zoom ratio when an SVG map is initially displayed. The default value is 1, which is the original map size (zoom level 0). Higher zoom ratio values show the map zoomed in, and lower values show the map zoomed out.
initscale is an optional attribute that specifies the initial scale when an SVG map is first displayed. The default value is 1, which is the original map size (zoom level 0). Higher values will show the SVG map zoomed in when it is first displayed.
navbar is an optional attribute that specifies whether to display the built-in navigation bar on an SVG map. If its value is TRUE (the default), the navigation bar is displayed; if it is set to FALSE, the navigation bar is not displayed.
infoon is an optional attribute that specifies whether to display hidden information when the mouse moves over features for which hidden information is provided. If its value is TRUE (the default), hidden information is displayed when the mouse moves over such features; if it is set to FALSE, hidden information is not displayed when the mouse moves over such features. Regardless of the value, however, hidden information is always rendered in an SVG map; this attribute only controls whether hidden information can be displayed. (To specify the hidden information for a feature, use the hidden_info attribute in the <geoFeature> element, as explained in Section 3.1.2.5.)
onclick is an optional attribute that specifies the name of the JavaScript function to be called when a user clicks on an SVG map. The JavaScript function must be defined in the HTML document outside the SVG definition. This function must accept two parameters: x and y, which specify the coordinates inside the SVG window where the click occurred. The coordinates are defined in the local SVG window coordinate system, which starts at (0, 0) at the upper-left corner and ends at (width, height) at the lower-right corner. For information about using JavaScript functions with SVG maps, see Appendix B.
onmousemove is an optional attribute that specifies the name of the JavaScript function to be called when a user moves the mouse on an SVG map. The JavaScript function must be defined in the HTML document outside the SVG definition. This function must accept two parameters: x and y, which specify the coordinates inside the SVG window where the move occurred. The coordinates are defined in the local SVG window coordinate system, which starts at (0, 0) at the upper-left corner and ends at (width, height) at the lower-right corner. For information about using JavaScript functions with SVG maps, see Appendix B.
rasterbasemap is an optional attribute. If the map format is SVG and the value of this attribute is TRUE, MapViewer renders the base map as a raster image. In this case, the base map image becomes the background image for the SVG map, and all other vector features are rendered on top of it.
onrectselect is an optional attribute that specifies the name of the JavaScript function to be called when a user draws a rectangular selection area by clicking and dragging the mouse (to indicate two diagonally opposite corners) on an SVG map. The JavaScript function must be defined in the HTML document outside the SVG definition. This function must not accept any parameters. For information about using JavaScript functions with SVG maps, see Appendix B.
onpolyselect is an optional attribute that specifies the name of the JavaScript function to be called when a user draws a polygon-shaped selection area by clicking and dragging the mouse (to indicate more than two vertices) on an SVG map. The JavaScript function must be defined in the HTML document outside the SVG definition. This function must not accept any parameters. For information about using JavaScript functions with SVG maps, see Appendix B.
keepthemesorder is an optional attribute. If the map format is not SVG and the value of this attribute is TRUE, MapViewer always renders the themes in the order specified in the map request; if the value of this attribute is FALSE, raster themes will be rendered before vector themes.
use_cached_basemap is an optional attribute. If the value of this attribute is TRUE and if a map tile layer caches the same base map specified by the basemap attribute, MapViewer tries to use the map images cached by the map tile server to render the map specified by the map request. For information about the map tile server, see Section 3.3.
snap_to_cache_scale is an optional attribute that is effective only when the use_cached_basemap attribute value is TRUE. It affects the behavior of MapViewer only when the map scale specified by the map request does not match that of any predefined cached zoom level. If this attribute is FALSE, MapViewer uses the cached map images to render the base map only when the map scale specified by the map request matches the scale of a cached predefined zoom level. If this attribute is TRUE, MapViewer always uses the cached map images to render the base map and adjusts the map scale to fit that of a cached predefined zoom level when the request map scale does not match any of the cached predefined zoom levels.
title_style is an optional attribute that defines the text style to be used for the title.
footnote is an optional attribute that defines the text for a footnote to be added to the map.
footnote_style is an optional attribute that defines the text style to be used for the footnote text.
rotation is an optional attribute defined in degrees to apply a rotation on the map. Positive values means counterclockwise rotation of the map. Rotation values are ignored if the request does not have a window defined (no center and size defined, or using bounding themes). Rotation is not supported for requests using base maps coming from the Oracle Maps cache.
3.1.2.2 bounding_themes Element
The <bounding_themes> element has the following definition:
<!ELEMENT bounding_themes (#PCDATA) >
<!ATTLIST bounding_themes
     border_margin          CDATA  #IMPLIED
     preserve_aspect_ratio  CDATA  "TRUE"
     size_hint              CDATA  #IMPLIED
>
You can specify one or more themes as the bounding themes when you cannot predetermine the data size for a map. For example, you may have one dynamic theme that selects all data points that meet certain criteria, and you then want to plot those data points on a map that is just big enough to enclose all the selected data points. In such cases, you can use the <bounding_themes> element to specify the names of such dynamic themes. MapViewer first processes any themes that are specified in the <bounding_themes> element, generates a bounding box based on the resulting features of the bounding themes, and then prepares other themes according to the new bounding box.
The <bounding_themes> element is ignored if you specify the <box> or <center> element in the map request.
border_margin is an optional attribute that specifies the percentage to be added to each margin of the generated bounding box. For example, if you specify a value of 0.025, MapViewer adds 2.5% of the width to the left and right margins of the generated bounding box (resulting in a total 5% width expansion in the x-axis); similarly, 2.5% of the height is added to the top and bottom margins. The default value is 0.05, or 5% to be added to each margin.
preserve_aspect_ratio is an optional attribute that indicates whether or not the bounding box generated after processing the bounding themes should be further modified so that it has the same aspect ratio as the map image or device. The default is TRUE, which modifies the bounding box to preserve the aspect ratio, so as not to distort the resulting map image.
size_hint is an optional attribute that specifies the vertical span of the map in terms of the original data unit. For example, if the user's data is in decimal degrees, the size_hint attribute specifies the number of decimal degrees in latitude. If the user's data is projected with meter as its unit, MapViewer interprets size_hint in meters.
The size_hint attribute can be used to extend the boundary limit. This is useful when the bounding theme has just one point feature. For example, the bounding theme can be a point resulting from a geocoding query, and you want to place this point in the middle of the map and extend the boundary from that point. This attribute can also be used if you want to extend the data bounds when the map image is rendered. For example, if the bounding theme contains a county of a state that spans 0.2 degrees vertically, then the county will appear much smaller in the map image if you specify size_hint="10". This attribute os ignored if its value is smaller than the actual data bounds. For example, if the actual spatial feature spans 0.2 degrees, then size hint="0.01" is ignored.
The element itself contains a comma-delimited list of names of the bounding themes. The theme names must exactly match their names in the map request or the base map used in the map request. The following example shows a map request with two bounding themes, named theme1 and theme3, and with 2.3 percent (border_margin="0.023") added to all four margins of the minimum bounding box needed to hold features associated with the two themes:
<?xml version="1.0" standalone="yes"?>
<map_request
             title="Bounding Theme Example"
             title_style="titleText"
             datasource = "mvdemo"
             basemap="demo_map"
             width="600"
             height="500"
             bgcolor="#a6cae0"
             antialiase="false"
             mapfilename="tilsmq202"
             format="PNG_STREAM">

  <bounding_themes border_margin="0.023">theme1, theme3</bounding_themes>
  <themes>
    <theme name="theme1" min_scale="5.0E7" max_scale="0.0">
       <jdbc_query
         datasource="mvdemo"
         jdbc_srid="8307"
         spatial_column="geom" label_column="STATE"
         render_style="myPattern" label_style="myText"
         >SELECT geom, state from states where state_abrv='IL'</jdbc_query>
     </theme>
    <theme name="theme3" min_scale="5.0E7" max_scale="0.0">
       <jdbc_query
         datasource="mvdemo"
         jdbc_srid="8307"
         spatial_column="geom" label_column="STATE"
         render_style="myPattern" label_style="myText"
         >SELECT geom,state from states where state_abrv='IN'</jdbc_query>
     </theme>
  </themes>
  <styles>
   <style name="myPattern">
     <svg width="1in" height="1in">
     <desc></desc>
       <g class="area"
          style="stroke:#6666e0;fill:#d6ccff;fill-opacity:128;line-style:L.STATE BOUNDARY">
       </g>
     </svg>
   </style>
   <style name="myText">
     <svg width="1in" height="1in">
        <g class="text" float-width="1.0"
           style="font-style:bold;font-family:Arial;font-size:16pt;fill:#6600ff">
          Hello World!
        </g>
     </svg>
   </style>
   <style name="titleText">
     <svg width="1in" height="1in">
        <g class="text" float-width="1.0"
           style="font-style:bold;font-family:Helvetica;font-size:18pt;fill:#333333">
          Hello World!
        </g>
     </svg>
   </style>
  </styles>
</map_request>
The preceding example displays a map in which the states of Illinois and Indiana are displayed according to the specifications in the two <theme> elements, both of which specify a rendering style named myPattern. In the myText style, the text "Hello World!" is displayed only when the style is being previewed in a style creation tool, such as the Map Builder tool. When the style is applied to a map, it is supplied with an actual text label that MapViewer obtains from a theme.
Figure 3-2 shows the display from the preceding example.
3.1.2.3 box Element
The <box> element has the following definition:
<!ELEMENT box (coordinates) >
<!ATTLIST box
    ID                    CDATA #IMPLIED
    srsName               CDATA #REQUIRED
    preserve_aspect_ratio (TRUE|FALSE) "FALSE"
>
The <box> element is used to specify the bounding box of a resulting map. It uses a <coordinates> element to specify two coordinate value pairs that identify the lower-left and upper-right corners of the rectangle. The coordinate values are interpreted in terms of the user's data. For example, if the user's data is geodetic and is specified in decimal degrees of longitude and latitude, a <coordinates> specification of -72.84, 41.67, -70.88, 42.70 indicates a bounding box with the lower-left corner at longitude-latitude coordinates (-72.84, 41.67) and the upper-right corner at coordinates (-70.88, 42.70), which are in the New England region of the United States. However, if the data is projected with meter as its unit of measurement, the coordinate values are interpreted in meters.
preserve_aspect_ratio is an optional attribute that indicates whether or not the box coordinates should be further modified so that it has the same aspect ratio as the map image or device. The default is FALSE, in order to keep compatibility with previous versions that do not have this attribute. If this value is set to TRUE, the box is modified to preserve the aspect ratio, so as not to distort the resulting map image.
3.1.2.4 center Element
The <center> element has the following definition:
<!ELEMENT center (geoFeature)>
<!ATTLIST center
   size CDATA #REQUIRED
>
The <center> element is used to specify the center of a resulting map. It has a required attribute named size, which specifies the vertical span of the map in terms of the original data unit. For example, if the user's data is in decimal degrees, the size attribute specifies the number of decimal degrees in latitude. If the user's data is projected with meter as its unit, MapViewer interprets the size in meters.
The center itself must embed a <geoFeature> element, which is specified in Section 3.1.2.5.
3.1.2.5 geoFeature Element
The <geoFeature> element has the following definition:
<!ELEMENT geoFeature (description?, property*,
 geometricProperty)>
<!ATTLIST geoFeature
   typeName          CDATA #IMPLIED
   id                CDATA #IMPLIED
   render_style      CDATA #IMPLIED
   text_style        CDATA #IMPLIED
   label             CDATA #IMPLIED
   label_always_on   (TRUE|FALSE) "FALSE"
   marker_size       CDATA #IMPLIED
   radius            CDATA #IMPLIED
   attribute_values  CDATA #IMPLIED
   orient_x          CDATA #IMPLIED
   orient_y          CDATA #IMPLIED
   orient_z          CDATA #IMPLIED
   selectable_in_svg (TRUE|FALSE) "FALSE"
   onclick           CDATA #IMPLIED
   hidden_info       CDATA #IMPLIED
>
<geoFeature> elements are used to provide individual geospatial entities to be rendered on a map. The main part of a <geoFeature> element is the geometry (<geometricProperty> element), which must be supplied in compliance with the OGC GML v1.0 Geometry DTD (described in Section 3.1.6).
typeName is an optional attribute that is ignored by the current release of MapViewer.
id is an optional attribute that can be used to uniquely identify the feature among all the geospatial features on the SVG map. (See the explanation of the selectable_in_svg attribute.) Otherwise, this attribute is ignored by MapViewer.
render_style is an optional attribute. When it is omitted, the geoFeature is not rendered. If it is supplied, its value must be the name of a style stored in the user's USER_SDO_STYLES view.
text_style is an optional attribute. If it is supplied (and if the render_style and label attributes are present and valid), it identifies the style to be used in labeling the feature. If it is not specified, a default text style is used.
label is an optional attribute. If it is supplied (and if the render_style and label attributes are present and valid), it identifies text that is used to label the feature.
label_always_on is an optional attribute. If it is set to TRUE, MapViewer labels the features even if two or more labels will overlap in the display of a theme. (MapViewer always tries to avoid overlapping labels.) If label_always_on is FALSE (the default), when it is impossible to avoid overlapping labels, MapViewer disables the display of one or more labels so that no overlapping occurs. The label_always_on attribute can also be specified for a theme (theme element, described in Section 3.1.2.20). Specifying label_always_on as TRUE for a feature in the geoFeature element definition gives you control over which features will have their labels displayed if label_always_on is FALSE for a theme and if overlapping labels cannot be avoided.
marker_size is an optional attribute. If it is supplied with a point feature, and if render_style is a marker-type style, the specified size is used by MapViewer in rendering this feature. This provides a mechanism to override the default value specified for a marker style.
radius is an optional attribute. If it is supplied, it specifies a number or a comma-delimited list of numbers, with each number representing the radius of a circle to be drawn centered on this feature. For geodetic data, the unit is meters; for non-geodetic data, the unit is the unit of measurement associated with the data.
attribute_values is an optional attribute. If it is supplied, it specifies a value or a comma-delimited list of values to be used with bucket ranges of an advanced style (for example, values for pie chart segments or bucket values for variable markers).
orient_x and orient_y optionally specify a virtual end point to indicate an orientation vector for rotating a marker symbol (such as a shield symbol to indicate a highway) or text at a specified point. (orient_z is reserved for future use by Oracle.) The value for each must be from -1 to 1. The orientation start point is assumed to be (0,0), and it is translated to the location of the physical point to which it corresponds.
Figure 3-3 illustrates an orientation vector of approximately 34 degrees (counterclockwise from the x-axis), resulting from specifying orient_x="0.3" orient_y="0.2". (To have an orientation that more precisely matches a specific angle, refer to the cotangent or tangent values in the tables in a trigonometry textbook.)
selectable_in_svg is an optional attribute that specifies whether or not the feature is selectable on an SVG map. The default is FALSE; that is, the feature is not selectable on an SVG map. If this attribute is set to TRUE and if theme feature selection is allowed, the feature can be selected by clicking on it. If the feature is selected, its color is changed and its ID is recorded. You can get a list of the ID values of all selected features by calling the JavaScript function getSelectedIdList() defined in the SVG map. (For feature selection to work correctly, the id attribute value of the feature must be set to a value that uniquely identifies it among all the geospatial features on the SVG map.) For information about using JavaScript functions with SVG maps, see Appendix B.
onclick is an optional attribute that specifies the name of the JavaScript function to be called when a user clicks on the feature. The JavaScript function must be defined in the HTML document outside the SVG definition. This function must accept only four parameters: the theme name, the key of the feature, and x and y, which specify the coordinates (in pixels) of the clicked point on the SVG map. For information about using JavaScript functions with SVG maps, see Appendix B.
hidden_info is an optional attribute that specifies an informational note or tip to be displayed when the mouse is moved over the feature. To specify multiple lines, use "\n" between lines. For example, hidden_info="State park with\nhistorical attractions" specifies a two-line tip. (To enable the display of hidden information in the map, you must specify infoon="true" in the <map_request> element, as explained in Section 3.1.2.1.1.)
The following example shows a <geoFeature> element specification for a restaurant at longitude and latitude coordinates (-78.1234, 41.0346). In this case, the feature will be invisible because the render_style and text_style attributes are not specified.
<geoFeature typeName="Customer" label="PizzaHut in Nashua">
   <geometricProperty>
      <Point srsName="SDO:8265">
         <coordinates>-78.1234,41.0346</coordinates>
      </Point>
   </geometricProperty>
</geoFeature>
The following example shows a <geoFeature> element specification for a point of interest at longitude and latitude coordinates (-122.2615, 37.5266). The feature will be rendered on the generated map because the render_style attribute is specified. The example specifies some label text (A Place) and a text style for drawing the label text. It also instructs MapViewer to draw two circles, centered on this feature, with radii of 1600 and 4800 meters. (In this case, the srsName attribute of the <Point> element must be present, and it must specify an Oracle Spatial and Graph SRID value using the format "SDO:<srid>". Because SRID value 8265 is associated with a geodetic coordinate system, the radius values are interpreted as 1600 and 4800 meters.)
<geoFeature render_style="m.star"
            radius="1600,4800"
            label="A Place"
            text_style="T.Name">
    <geometricProperty>
        <Point srsName="SDO:8265">
            <coordinates>-122.2615, 37.5266</coordinates>
        </Point>
    </geometricProperty>
</geoFeature>
Figure 3-4 is a map drawn using the <geoFeature> element in the preceding example. The feature is labeled with the text A Place, and it is represented by a red star marker surrounded by two concentric circles.
Figure 3-4 Map with <geoFeature> Element Showing Two Concentric Circles
Description of ''Figure 3-4 Map with <geoFeature> Element Showing Two Concentric Circles''
3.1.2.6 jdbc_georaster_query Element
The <jdbc_georaster_query> element, which is used to define a GeoRaster theme, has the following definition:
<!ELEMENT jdbc_georaster_query (#PCDATA) >
<!ATTLIST jdbc_georaster_query
    asis               (TRUE|FALSE) "FALSE"
    georaster_table    CDATA #REQUIRED
    georaster_column   CDATA #REQUIRED
    raster_id          CDATA #IMPLIED
    raster_table       CDATA #IMPLIED
    raster_pyramid     CDATA #IMPLIED
    raster_bands       CDATA #IMPLIED
    datasource         CDATA #IMPLIED
    polygon_mask       CDATA #IMPLIED
    transparent_nodata CDATA #IMPLIED
    jdbc_host          CDATA #IMPLIED
    jdbc_port          CDATA #IMPLIED
    jdbc_sid           CDATA #IMPLIED
    jdbc_user          CDATA #IMPLIED
    jdbc_password      CDATA #IMPLIED
    jdbc_srid          CDATA #IMPLIED
    jdbc_mode          (thin|oci8) "thin"
>
For detailed usage and reference information about GeoRaster themes, see Section 2.3.4.
3.1.2.7 jdbc_image_query Element
The <jdbc_image_query> element, which is used to define an image theme (described in Section 2.3.3), has the following definition:
<!ELEMENT jdbc_image_query (#PCDATA) >
<!ATTLIST jdbc_image_query
    asis              (TRUE|FALSE) "FALSE"
    image_format      CDATA #REQUIRED
    image_column      CDATA #REQUIRED
    image_mbr_column  CDATA #REQUIRED
    image_resolution  CDATA #IMPLIED
    image_unit        CDATA #IMPLIED
    datasource        CDATA #IMPLIED
    jdbc_host         CDATA #IMPLIED
    jdbc_port         CDATA #IMPLIED
    jdbc_sid          CDATA #IMPLIED
    jdbc_user         CDATA #IMPLIED
    jdbc_password     CDATA #IMPLIED
    jdbc_srid         CDATA #IMPLIED
    jdbc_mode         (thin|oci8) "thin"
>
To define a theme dynamically, you must supply a valid SQL query as the content of the <jdbc_image_query> element. You must specify the JDBC connection information for an image theme (either datasource or the combination of jdbc_host, jdbc_port, jdbc_sid, jdbc_user, and jdbc_password).
jdbc_srid is an optional attribute that specifies the coordinate system (SDO_SRID value) of the data to be rendered.
jdbc_mode identifies the Oracle JDBC driver (thin or oci8) to use to connect to the database.
asis is an optional attribute. If it is set to TRUE, MapViewer does not attempt to modify the supplied query string. If asis is FALSE (the default), MapViewer embeds the SQL query as a subquery of its spatial filter query. For example, assume that you want a map centered at (-122, 37) with size 1, and the supplied query is:
SELECT geometry, sales FROM crm_sales WHERE sales < 100000;
If asis is FALSE, the actual query that MapViewer executes is similar to:
SELECT * FROM
   (SELECT geometry, sales FROM crm_sales WHERE sales < 100000)
WHERE sdo_filter(geometry, sdo_geometry(. . . -122.5, 36.5, -123.5, 37.5 . . .) ='TRUE';
In other words, the original query is further refined by a spatial filter query for the current map window. However, if asis is TRUE, MapViewer executes the query as specified, namely:
SELECT geometry, sales FROM crm_sales WHERE sales < 100000;
image_format identifies the format (such as GIF or JPEG) of the image data. If the image format is not supported by MapViewer, you must create and register a custom image renderer for the format, as explained in Appendix C.
image_column identifies the column of type BLOB where each image is stored.
image_mbr_column identifies the column of type SDO_GEOMETRY where the footprint (minimum bounding rectangle, or MBR) of each image is stored.
image_resolution is an optional attribute that identifies the original image resolution (number of image_unit units for each pixel).
image_unit is an optional attribute, except it is required if you specify the image_resolution attribute. The image_unit attribute specifies the unit of the resolution, such as M for meter. The value for this attribute must be one of the values in the SDO_UNIT column of the MDSYS.SDO_DIST_UNITS table. In Example 2-13 in Section 2.3.3.1, the image resolution is 2 meters per pixel.
For an example of using the <jdbc_image_query> element to specify an image theme, see Example 3-6 in Section 3.1.1.6.
3.1.2.8 jdbc_network_query Element
The <jdbc_network_query> element, which is used to define a network theme, has the following definition:
<!ELEMENT jdbc_network_query (#PCDATA) >
<!ATTLIST jdbc_network_query
    asis                    (TRUE|FALSE) "FALSE"
    network_name            CDATA #REQUIRED
    network_level           CDATA #IMPLIED
    link_style              CDATA #IMPLIED
    direction_style         CDATA #IMPLIED
    bidirection_style       CDATA #IMPLIED
    direction_position      CDATA #IMPLIED
    direction_markersize    CDATA #IMPLIED
    direction_multimarker  (TRUE|FALSE) "FALSE"
    link_labelstyle         CDATA #IMPLIED
    link_labelcolumn        CDATA #IMPLIED
    node_style              CDATA #IMPLIED
    node_markersize         CDATA #IMPLIED
    node_labelstyle         CDATA #IMPLIED
    node_labelcolumn        CDATA #IMPLIED
    path_ids                CDATA #IMPLIED
    path_styles             CDATA #IMPLIED
    path_labelstyle         CDATA #IMPLIED
    path_labelcolumn        CDATA #IMPLIED
    analysis_algorithm      CDATA #IMPLIED
    shortestpath_style      CDATA #IMPLIED
    shortestpath_startnode  CDATA #IMPLIED
    shortestpath_endnode    CDATA #IMPLIED
    shortestpath_startstyle CDATA #IMPLIED
    shortestpath_endstyle   CDATA #IMPLIED
    withincost_startnode    CDATA #IMPLIED
    withincost_style        CDATA #IMPLIED
    withincost_cost         CDATA #IMPLIED
    withincost_startstyle   CDATA #IMPLIED
    datasource              CDATA #IMPLIED
    jdbc_host               CDATA #IMPLIED
    jdbc_port               CDATA #IMPLIED
    jdbc_sid                CDATA #IMPLIED
    jdbc_user               CDATA #IMPLIED
    jdbc_password           CDATA #IMPLIED
    jdbc_srid               CDATA #IMPLIED
    jdbc_mode               (thin|oci8) "thin"
>
For detailed usage and reference information about network themes, see Section 2.3.5.
3.1.2.9 jdbc_query Element
The <jdbc_query> element is used to define a theme dynamically. This element and its associated <hidden_info> element have the following definitions:
<!ELEMENT jdbc_query (#PCDATA, hidden_info?)>
<!ATTLIST jdbc_query
    asis               (TRUE|FALSE) "FALSE"
    spatial_column     CDATA #REQUIRED
    key_column         CDATA #IMPLIED
    label_column       CDATA #IMPLIED
    label_style        CDATA #IMPLIED
    render_style       CDATA #IMPLIED
    x_column           CDATA #IMPLIED
    y_column           CDATA #IMPLIED
    datasource         CDATA #IMPLIED
    jdbc_host          CDATA #IMPLIED
    jdbc_port          CDATA #IMPLIED
    jdbc_sid           CDATA #IMPLIED
    jdbc_user          CDATA #IMPLIED
    jdbc_password      CDATA #IMPLIED
    jdbc_srid          CDATA #IMPLIED
    jdbc_mode          (thin|oci8) "thin"
>
<!ELEMENT hidden_info (field+)>
<!ELEMENT field (#PCDATA)>
<!ATTLIST field
    column  CDATA #REQUIRED
    name    CDATA #IMPLIED
>
To define a theme dynamically, you must supply a valid SQL query as the content of the <jdbc_query> element. You must specify the spatial_column (column of type SDO_GEOMETRY) and the JDBC connection information for a dynamically defined theme (either datasource or the combination of jdbc_host, jdbc_port, jdbc_sid, jdbc_user, and jdbc_password).
If the selectable_in_svg attribute value is TRUE in the <theme> element, you must use the key_column attribute in the <jdbc_query> element to specify the name of a column that can uniquely identify each selected feature from the JDBC query. The specified column must also appear in the SELECT list in the JDBC query.
render_style and label_style are optional attributes. For render_style, for point features the default is a red cross rotated 45 degrees, for lines and curves it is a black line 1 pixel wide, and for polygons it is a black border with a semitransparent dark gray interior.
x_column and y_column are optional attributes. If specified, they are used to define a point JDBC theme based on two columns in a table, so that MapViewer can render a point theme based on values in these columns. For more information, see Section 2.3.2.1.
jdbc_srid is an optional attribute that specifies the coordinate system (SDO_SRID value) of the data to be rendered.
jdbc_mode identifies the Oracle JDBC driver (thin or oci8) to use to connect to the database.
asis is an optional attribute. If it is set to TRUE, MapViewer does not attempt to modify the supplied query string. If asis is FALSE (the default), MapViewer embeds the SQL query as a subquery of its spatial filter query. For example, assume that you want a map centered at (-122, 37) with size 1, and the supplied query is:
SELECT geometry, sales FROM crm_sales WHERE sales < 100000;
If asis is FALSE, the actual query that MapViewer executes is similar to:
SELECT * FROM
   (SELECT geometry, sales FROM crm_sales WHERE sales < 100000)
WHERE sdo_filter(geometry, sdo_geometry(. . . -122.5, 36.5, -123.5, 37.5. . . ) ='TRUE';
In other words, the original query is further refined by a spatial filter query using the current map window. However, if asis is TRUE, MapViewer executes the query as specified, namely:
SELECT geometry, sales FROM crm_sales WHERE sales < 100000;
The <hidden_info> element specifies the list of attributes from the base table to be displayed when the user moves the mouse over the theme's features. The attributes are specified by a list of <field> elements.
Each <field> element must have a column attribute, which specifies the name of the column from the base table, and it can have a name attribute, which specifies the display name of the column. (The name attribute is useful if you want a text string other than the column name to be displayed.)
For examples of using the <jdbc_query> element to define a theme dynamically, see Example 3-2 in Section 3.1.1.2 and Example 3-4 in Section 3.1.1.4.
3.1.2.10 jdbc_topology_query Element
The <jdbc_topology_query> element, which is used to define a topology theme, has the following definition:
<!ELEMENT jdbc_topology_query (#PCDATA)>
<!ATTLIST jdbc_topology_query
    asis               (TRUE|FALSE) "FALSE"
    topology_name      CDATA #REQUIRED
    feature_table      CDATA #REQUIRED
    spatial_column     CDATA #REQUIRED
    label_column       CDATA #IMPLIED
    label_style        CDATA #IMPLIED
    render_style       CDATA #IMPLIED
    datasource         CDATA #IMPLIED
    edge_style         CDATA #IMPLIED
    edge_marker_style  CDATA #IMPLIED
    edge_marker_size   CDATA #IMPLIED
    edge_label_style   CDATA #IMPLIED
    node_style         CDATA #IMPLIED
    node_label_style   CDATA #IMPLIED
    face_style         CDATA #IMPLIED
    face_label_style   CDATA #IMPLIED
    jdbc_host          CDATA #IMPLIED
    jdbc_port          CDATA #IMPLIED
    jdbc_sid           CDATA #IMPLIED
    jdbc_user          CDATA #IMPLIED
    jdbc_password      CDATA #IMPLIED
    jdbc_srid          CDATA #IMPLIED
    jdbc_mode          (thin|oci8) "thin"
>
For detailed usage and reference information about topology themes, see Section 2.3.6.
3.1.2.11 legend Element
The <legend> element has the following definition:
<!ELEMENT legend (column,themes)? >
<!ATTLIST legend
    bgstyle    CDATA #implied
    font       CDATA #implied
    location_x CDATA #implied
    location_y CDATA #implied
    offset_x   CDATA #implied
    offset_y   CDATA #implied
    profile    (MEDIUM|SMALL|LARGE)  "MEDIUM"
    position   (SOUTH_WEST|SOUTH_EAST|SOUTH|NORTH|
               NORTH_WEST|NORTH_EAST|EAST|WEST|CENTER)  "SOUTH_WEST"
>
<!ELEMENT column entry+ >
<!ATTLIST entry
    is_title      (true|false) "false"
    is_separator  (true|false) "false"
    tab           CDATA  "0"
    style         CDATA  #implied
    text          CDATA  #implied
    text_size     CDATA  #implied
    width         CDATA  #implied
    height        CDATA  #implied
>
<!ELEMENT themes theme+ >
<!ATTLIST theme
    name          CDATA #REQUIRED
>
<legend> elements are used to draw a legend (map inset illustration) on top of a generated map, to make the visual aspects of the map more meaningful to users. The main part of a <legend> element is one or more <column> elements, each of which defines a column in the legend. (If no <column> elements are present, an automatic legend is created, as explained in Section 2.4.2.) A one-column legend will have all entries arranged from top to bottom. A two-column legend will have the two columns side by side, with the first column on the left, and each column having its own legend entries. Figure 2-14 in Section 2.4.2 shows a one-column legend. Figure 3-5 shows a two-column legend.
bgstyle is an optional attribute that specifies the overall background style of the legend. It uses a string with syntax similar to scalable vector graphics (SVG) to specify the fill and stroke colors for the bounding box of the legend. If you specify an opacity (fill-opacity or stroke-opacity) value, the fill and stroke colors can be transparent or partially transparent. The following example specifies a background that is white and half transparent, and a stroke (for the legend box boundary) that is red:
bgstyle="fill:#ffffff;fill-opacity:128;stroke:#ff0000"
font is an optional attribute that specifies the name of the font to be used for text that appears in the legend image. You can specify a logical font name that is supported by Java (serif, sansserif, monospaced, dialog, or dialoginput). You can also specify the name of a physical font that is available on the system where the MapViewer server is running.
location_x and location_y are optional attributes that specify the X and Y coordinates (in screen units) of the start of the legend. If you specify these attributes, they override any specification for the position attribute.
offset_x and offset_y are optional attributes to be used with the position attribute. The default distance from the borders for the position hint corresponds to 10 pixels. You can use these offset parameters to override the default value.
profile is an optional attribute that specifies a relative size of the legend on the map, using one of the following keywords: SMALL, MEDIUM (the default), or LARGE.
position is an optional attribute that specifies where the legend should be drawn on the map. The default is SOUTH_WEST, which draws the legend in the lower-left corner of the resulting map.
is_title is an optional attribute of the <entry> element. When its value is TRUE, the entry is used as the title for the column, which means that the description text appears in a more prominent font than regular legend text, and any other style attribute defined for the entry is ignored. The default is FALSE.
is_separator is an optional attribute of the <entry> element. When its value is TRUE, the entry is used to insert a blank line for vertical spacing in the column. The default is FALSE.
tab is an optional attribute of the <entry> element. It specifies the number of tab positions to indent the entry from the left margin of the column. The default is 0 (zero), which means no indentation.
style is an optional attribute of the <entry> element. It specifies the name of the MapViewer style (such as a color or an image) to be depicted as part of the entry.
text is an optional attribute of the <entry> element. It specifies the description text (for example, a short explanation of the associated color or image) to be included in the entry.
text_size is an optional attribute of the <entry> element. It specifies the size (in display units) of the description text to be included in the entry. The specified value overrides the MapViewer predefined profile size.
width and height are optional attributes that together specify the size (in device units) of the legend entry Any specified values override the defaults, which depend on the MapViewer profile values for small, medium, and large text.
The following example shows the <legend> element specification for the legend in Figure 2-14 in Section 2.4.2.
<legend bgstyle="fill:#ffffff;fill-opacity:128;stroke:#ff0000"
            position="NORTH_WEST">
  <column>
    <entry text="Map Legend" is_title="true"/>
    <entry style="M.STAR" text="center point"/>
    <entry style="M.CITY HALL 3" text="cities"/>
    <entry is_separator="true"/>
    <entry style="C.ROSY BROWN STROKE" text="state boundary"/>
    <entry style="L.PH" text="interstate highway"/>
    <entry text="County population:"/>
    <entry style="V.COUNTY_POP_DENSITY" tab="1"/>
  </column>
</legend>
In the preceding example:
-
The background color has an opacity value of 128 (
fill-opacity:128), which means that the white background will be half transparent. -
The legend boundary box will be red (
stroke:#ff0000). -
The legend boundary box will be positioned in the upper-left part of the display (
position="NORTH_WEST"). -
The legend will be the default size, because the
profileattribute (which has a default value ofMEDIUM) is not specified. -
The legend will have a single column, with entries arranged from top to bottom.
-
The first entry is the legend title, with the text Map Legend.
-
The fourth entry is a separator for adding a blank line.
-
The seventh entry is description text (County population:) that users of the generated map will associate with the next (and last) entry, which specifies an advanced style. The County population: text entry is helpful because advanced styles usually have their own descriptive text, and you do not want users to become confused about which text applies to which parts of the legend.
-
The last entry specifies an advanced style (
style="V.COUNTY_POP_DENSITY"), and it is indented one tab position (tab="1") so that the colors and text identifying various population density ranges will be easy for users to distinguish from the preceding County population: description text.
3.1.2.12 map_tile_theme Element
The <map_tile_theme> element is used to define a map tile theme, which produces a map image layer rendered by the map tile server with pregenerated map image tiles. The map image tiles can be served by any internal or external map service providers. This element has the following definition:
<!ELEMENT map_tile_theme (#PCDATA)>
<!ATTLIST map_tile_theme
    map_tile_layer      CDATA # REQUIRED
    snap_to_tile_scale  (TRUE|FALSE) "FALSE"
>
map_tile_name specifies the name of the map tile layer that has been predefined with MapViewer.
snap_to_tile_scale is an optional attribute that specifies whether to adjust the map scale to fit that of one of the predefined map tile layer zoom levels. If this attribute is FALSE, the scale of the result map is always the same as what the map request specifies; and if the map request scale does not fit any of the predefined map tile layer zoom levels, the map tile images are scaled to fit the map request scale. If this attribute is TRUE, the scale of the result map is adjusted to fit one of the predefined map tile layer zoom levels when the request map scale does not fit any of the predefined zoom levels.
3.1.2.13 north_arrow Element
The <north_arrow> element specifies a style (usually a marker) to point to the north direction on the map. It uses the map request rotation attribute to define its orientation. This element has the following definition:
<!ELEMENT north_arrow (style, location?, size?) >
The <style> element specifies the name of the style (typically a marker style) for the north arrow.
The <location> element is optional. It specifies the X and Y coordinate values (in pixels) of the position on the map for the north arrow. The default value is (25, 25).
The <size> element is optional. It specifies the width and height (in pixels) to be used by MapViewer in rendering the north arrow. The default value is (16, 32).
Example 3-20 shows a north arrow definition using style m.image41_bw, located at position (35, 35) of the map image, and with width 16 and height 32.
3.1.2.14 operation Element
The <operation> element enables you to perform additional transformations on the original data during rendering. The <operation> element has the following definition:
<!ELEMENT operation (parameter+) >
<!ATTLIST parameter
  name  CDATA #REQUIRED
>
Currently this element is used in GeoRaster themes (described in Section 2.3.4). You can perform some image processing operations on the original image, such as normalization, equalization, linear stretch, piecewise linear stretch, brightness and contrast adjustment, and threshold change.
Example 3-21 specifies the normalization operation with a GeoRaster theme.
Example 3-21 Normalization Operation with a GeoRaster Theme
<theme name="geor_theme" >
    <jdbc_georaster_query
        jdbc_srid="0"
        datasource="mvdemo"
        georaster_table="dem"
        georaster_column="georaster"
       asis="false"> select georaster from dem
    </jdbc_georaster_query>
    <operations>
     <operation name="normalize">
      </operation>
     </operations>
  </theme>
The following code segment shows a manual linear stretch operation. (For automatic linear stretch, include the <operation> element but no <parameter> elements.)
     <operation name="linearstretch">
         <parameter name="autostretch" value="false"/>
         <parameter name="lowstretch" value="50"/>
         <parameter name="highstretch" value="150"/>
     </operation>
Table 3-1 lists the image processing operations, their <operation> element name keyword values, and (where relevant) associated <parameter> element values.
Table 3-1 Image processing Options for GeoRaster Theme Operations
| Operation | <operation> name value | <parameter> values |
|---|---|---|
|
Normalization |
|
(Not applicable) |
|
Equalization |
|
(Not applicable) |
|
Linear stretch |
|
|
|
Piecewise linear stretch |
|
(Not applicable) |
|
Brightness |
|
|
|
Contrast |
|
|
|
Change threshold |
|
|
3.1.2.15 operations Element
The <operations> element specifies one or more <operation> elements (described in Section 3.1.2.14). The <operations> element has the following definition:
<!ELEMENT operations (oepration+) >
For a predefined GeoRaster theme, the <operations> element will be part of the styling rule definition. Example 3-21 shows the styling rules for a GeoRaster theme that uses the normalization operation.
3.1.2.16 parameter Element
The <parameter> element defines values to be used in an operation to be applied on themes. (The operation is specified in an <operations> element, described in Section 3.1.2.14.) The <parameter> element has the following definition:
<!ELEMENT parameter >
<!ATTLIST parameter
  name   CDATA #REQUIRED
  value  CDATA #REQUIRED
>
Each parameter must have a name and value associated with it.
3.1.2.17 scale_bar Element
The <scale_bar> element defines a scale bar (to show how many kilometers or miles are represented by a distance marked on the bar) to be added to the map request, if the map has a known spatial reference system (SRS). You can specify a single display mode (Metric or US) or dual mode (both Metric and US). The <scale_bar> element has the following definition:
<!ELEMENT scale_bar >
<!ATTLIST scale_bar
   mode              (METRIC_MODE|US_MODE|DUAL_MODES) "METRIC_MODE"
   position          (SOUTH_WEST|SOUTH_EAST|SOUTH|NORTH|
                      NORTH_WEST|NORTH_EAST)  "NORTH_EAST"
   offset_y          CDATA #implied
   offset_y          CDATA #implied
   color1            CDATA #implied
   color1_opacity    CDATA #implied
   color2            CDATA #implied
   color2_opacity    CDATA #implied
   length_hint       CDATA #implied
   label_color       CDATA #implied
   label_font_family CDATA #implied
   label_font_size   CDATA #implied
   label_halo_size   CDATA #implied
   label_position    (TOP|BOTTOM) "TOP"
>
All <scale_bar> attributes are optional.
mode specifies if the scale bar should be in metric or US mode, or in both modes. The default is METRIC_MODE.
position defines the relative location on the map to place the scale bar. The default is NORTH_EAST.
offset_x and offset_y define the X and Y values to offset the scale bar position from the map margin. The default value for each is 0.
color1, color1_opacity, color2, and color2_opacity define the colors to be used when rendering the scale bar. color1 and color2 have a default value for red, green, blue; color1_opacity has a default value of (0x44, 0x44, 0x44, 210); and color 2_opacity has a default value of (0xee, 0xee, 0xee, 210).
length_hint defines the preferred number of pixels to be used to render the scale bar. The default is approximately 17% of the map width.
label_color, label_font_family, label_font_size, and label_halo_size affect the scale bar text. The defaults are black color, Serif font family, 12pt font size, and no halo (0 halo size).
label_position defines the position of the text relative to the scale bar (TOP or BOTTOM). The default is TOP.
Example 3-23 defines a scale bar.
3.1.2.18 style Element
The <style> element has the following definition:
<!ELEMENT style (svg | AdvancedStyle)?>
<!ATTLIST style
    name  CDATA #REQUIRED
>
The <style> element lets you specify a dynamically defined style. The style can be either of the following:
-
An SVG description representing a color, line, marker, area, or text style
-
An advanced style definition (see Section A.6) representing a bucket, a color scheme, or a variable marker style
The name attribute identifies the style name.
The following example shows an excerpt that dynamically defines two styles (a color style and an advanced style) for a map request:
<map_request . . .>
  . . .
  <styles>
    <style name="color_red">
      <svg width="1in" height="1in">
        <g class="color"
           style="stroke:red;stroke-opacity:100;fill:red;fill-opacity:100">
          <rect width="50" height="50"/>
        </g>
      </svg>
    </style>

    <style name="ranged_bucket_style">
        <AdvancedStyle>
           <BucketStyle>
             <Buckets>
             <RangedBucket seq="0" label="less than 100k"
               high="100000.0" style="C.RB13_13"/>
             <RangedBucket seq="1" label="100k - 150k" low="100000.0"
               high="150000.0" style="C.RB13_1"/>
             <RangedBucket seq="2" label="150k - 250k" low="150000.0"
               high="250000.0" style="C.RB13_4"/>
             <RangedBucket seq="3" label="250k - 350k" low="250000.0"
               high="350000.0" style="C.RB13_7"/>
             <RangedBucket seq="4" label="350k - 450k" low="350000.0"
               high="450000.0" style="C.RB13_10"/>
              </Buckets>
           </BucketStyle>
        </AdvancedStyle>
    </style>
  </styles>
</map_request>
3.1.2.19 styles Element
The <styles> element has the following definition:
<!ELEMENT styles (style+) >
The <styles> element specifies one or more <style> elements (described in Section 3.1.2.18).
3.1.2.20 theme Element
The <theme> element has the following definition:
<!ELEMENT theme (jdbc_query | jdbc_image_query | jdbc_georaster_query
                 | jdbc_network_query | jdbc_topology_query | map_tile_theme)?,
                 operations? >
<!ATTLIST theme
    name                  CDATA #REQUIRED
    datasource            CDATA #IMPLIED
    template_theme        CDATA #IMPLIED
    max_scale             CDATA #IMPLIED
    min_scale             CDATA #IMPLIED
    label_max_scale       CDATA #IMPLIED
    label_min_scale       CDATA #IMPLIED
    label_always_on       (TRUE|FALSE) "FALSE"
    fast_unpickle         (TRUE|FALSE) "TRUE"
    mode                  CDATA #IMPLIED
    min_dist              CDATA #IMPLIED
    fixed_svglabel        (TRUE|FALSE) "FALSE"
    visible_in_svg        (TRUE|FALSE) "TRUE"
    selectable_in_svg     (TRUE|FALSE) "FALSE"
    part_of_basemap       (TRUE|FALSE) "FALSE"
    simplify_shapes       (TRUE|FALSE) "TRUE"
    transparency          CDATA #IMPLIED
    minimum_pixels        CDATA #IMPLIED
    onclick               CDATA #IMPLIED
    onmousemove           CDATA #IMPLIED
    onmouseover           CDATA #IMPLIED
    onmouseout            CDATA #IMPLIED
    workspace_name        CDATA #IMPLIED
    workspace_savepoint   CDATA #IMPLIED
    workspace_date        CDATA #IMPLIED
    workspace_date_format CDATA #IMPLIED
    fetch_size            CDATA #IMPLIED
    timeout               CDATA #IMPLIED
>
The <theme> element lets you specify a predefined or dynamically defined theme.
-
For a predefined theme, whose definition is already stored in your USER_SDO_THEMES view, only the theme name is required.
-
For a dynamically defined theme, you must provide the information in one of the following elements:
<jdbc_query>(described in Section 3.1.2.9),<jdbc_image_query>(described in Section 3.1.2.7),<jdbc_georaster_query>(described in Section 2.3.4),<jdbc_network_query>(described in Section 2.3.5), or<jdbc_topology_query>(described in Section 2.3.6). -
For a GeoRaster theme, you can define some image processing options (described in Section 3.1.2.14).
The name attribute identifies the theme name. For a predefined theme, the name must match a value in the NAME column of the USER_SDO_THEMES view (described in Section 2.9.2). For a dynamically defined theme, this is just a temporary name for referencing the jdbc_query-based theme.
datasource is an optional attribute that specifies a data source for the theme. If you do not specify this attribute, the data source for the map request is assumed (see the datasource attribute explanation in Section 3.1.2.1.1). By specifying different data sources for different themes, you can use multiple data sources in a map request.
template_theme is an optional attribute that can be used to render two or more themes when a predefined theme has same name in multiple data sources. You cannot repeat theme names in a map request, but if you have two different data sources with same predefined theme name, you can use this attribute to render both themes. The following example specifies two themes that are based on a US_STATES theme that exists in two data sources, but that has a different content in each data source.
<themes>
  <theme name="US_STATES" datasource="dsrc"/>
  <theme name="OTHER_US_STATES" template_theme="US_STATES" datasource="other_dsrc" />
</themes>
The max_scale and min_scale attributes affect the visibility of this theme. If max_scale and min_scale are omitted, the theme is always rendered, regardless of the map scale. (See Section 2.4.1 for an explanation of max_scale and min_scale.)
The label_max_scale and label_min_scale attributes affect the visibility of feature labels of this theme. If label_max_scale and label_min_scale are omitted, the theme feature labels are always rendered when the map scale is within the visible range of theme scales (that is, within the max_scale and min_scale range). (See Section 2.4.1 for an explanation of label_max_scale and label_min_scale.)
label_always_on is an optional attribute. If it is set to TRUE, MapViewer labels all features of the theme even if two or more labels will overlap in the display. (MapViewer always tries to avoid overlapping labels.) If label_always_on is FALSE (the default), when it is impossible to avoid overlapping labels, MapViewer disables the display of one or more labels so that no overlapping occurs. The label_always_on attribute can also be specified for a map feature (geoFeature element, described in Section 3.1.2.5), thus allowing you to control which features will have their labels displayed if label_always_on is FALSE for a theme and if overlapping labels cannot be avoided.
fast_unpickle is an optional attribute. If it is TRUE (the default), MapViewer uses its own fast unpickling (unstreaming) algorithm instead of the generic JDBC conversion algorithm to convert SDO_GEOMETRY objects fetched from the database into a Java object accessible to MapViewer. This process improves performance, but occasionally the coordinates may lose some precision (around 0.00000005), which can be significant in applications where all precision digits of each coordinate must be kept. If fast_unpickle is set to FALSE, MapViewer uses the generic JDBC conversion algorithm. This process is slower than MapViewer's fast unpickling process, but there is never any loss of precision.
mode is an optional attribute. For a topology theme, you can specify mode="debug" to display edges, nodes, and faces, as explained in Section 2.3.6. The mode attribute is ignored for other types of themes.
min_dist is an optional attribute. It specifies the minimum on-screen distance (number of pixels) between two adjacent shape points on a line string or polygon for rendering of separate shape points. If the on-screen distance between two adjacent shape points is less than the min_dist value, only one shape point is rendered. The default value is 0.5. You can specify higher values to reduce the number of shape points rendered on an SVG map, and thus reduce the size of the resulting SVG file. You can specify different values in different theme definitions, to allow for customized levels of detail in SVG maps.
fixed_svglabel is an optional attribute that specifies whether to display the labels on an SVG map using the original "fixed" labels, but having them appear larger or smaller as the zoom level increases (zoomin) or decreases (zoomout), or to use different labels with the same text but different actual sizes so that the apparent size of each label remains the same at all zoom levels. If the fixed_svglabel value is specified as TRUE, the same theme labels are displayed on the map at all zoom levels, with the labels zoomed in and out as the map is zoomed in and out. If the value is FALSE (the default), different theme labels are displayed at different zoom levels so that the size of each displayed label appears not to change during zoomin and zoomout operations.
visible_in_svg is an optional attribute that specifies whether or not to display the theme on an SVG map. If its value is TRUE (the default), the theme is displayed; if it is set to FALSE, the theme is not displayed. However, even if this attribute is set to FALSE, the theme is still rendered to the SVG map: the theme is initially invisible, but you can make it visible later by calling the JavaScript function showTheme() defined in the SVG map. For information about using JavaScript functions with SVG maps, see Appendix B.
selectable_in_svg is an optional attribute that specifies whether or not the theme is selectable on an SVG map. The default is FALSE; that is, the theme is not selectable on an SVG map. If this attribute is set to TRUE and if theme feature selection is allowed, each feature of the theme displayed on the SVG map can be selected by clicking on it. If the feature is selected, its color is changed and its ID (its rowid by default) is recorded. You can get a list of the ID values of all selected features by calling the JavaScript function getSelectedIdList() defined in the SVG map. For information about using JavaScript functions with SVG maps, see Appendix B.
part_of_basemap is an optional attribute. If the map format is SVG and the value of this attribute is TRUE, MapViewer renders the theme as part of and on top of the base map, which is rendered as a raster image.
simplify_shapes is an optional attribute that specifies whether or not the shapes are simplified before being rendered. Simplification is useful when you want a map display with less fine resolution than the original geometries. For example, if the display resolution cannot show the hundreds or thousands of turns in the course of a river or in a political boundary, better performance might result if the shapes were simplified to show only the major turns. The default is TRUE; that is, shapes are simplified before being rendered. If this attribute is set to FALSE, MapViewer attempts to render all vertices and line segments from the original geometries, and performance may be slower.
transparency is an optional parameter to define the basic alpha composing value to be applied on themes during rendering. The value can be from 0 to 1, with 0 meaning completely transparent and 1 (the default) meaning completely opaque (no transparency).
minimum_pixels is an optional parameter that defines the level of resolution to be used on the spatial filter query. This may be useful to avoid rendering too many elements at the same position of the screen. (See the Oracle Spatial and Graph documentation about the min_resolution and max_resolution options for the SDO_FILTER operator.) The unit for minimum_pixels is screen pixels. For example, minimum_pixels=1 means that the spatial filter query will not return features with a resolution less than the amount that 1 pixel represents for the current device window and current query window
onclick is an optional attribute that specifies the name of the JavaScript function to be called when a user clicks on an SVG map and theme feature selection is allowed (see the selectable_in_svg attribute explanation). The JavaScript function must be defined in the HTML document that has the SVG map embedded. This function must accept only four parameters: the theme name, the key of the feature, and x and y, which specify the coordinates (in pixels) of the clicked point on the SVG map. For information about using JavaScript functions with SVG maps, see Appendix B.
onmousemove is an optional attribute that specifies the name of the JavaScript function to be called when a user moves the mouse on top of any feature of the theme on an SVG map. The JavaScript function must be defined in the HTML document that has the SVG map embedded. This function must accept only four parameters: the theme name, the key of the feature, and x and y, which specify the coordinates (in pixels) of the point for the move on the SVG map. For information about using JavaScript functions with SVG maps, see Appendix B.
onmouseover is an optional attribute that specifies the name of the JavaScript function to be called when a user moves the mouse into a feature of the theme on an SVG map. (Unlike the onmousemove function, which is called whenever the mouse moves inside the theme, the onmouseover function is called only once when the mouse moves from outside a feature of the theme to inside a feature of the theme.) The JavaScript function must be defined in the HTML document that has the SVG map embedded. This function must accept only four parameters: the theme name, the key of the feature, and x and y, which specify the coordinates (in pixels) of the point at which the mouse moves inside a feature on the SVG map. For information about using JavaScript functions with SVG maps, see Appendix B.
onmouseout is an optional attribute that specifies the name of the JavaScript function to be called when a user moves the mouse out of a feature of the theme on an SVG map. The JavaScript function must be defined in the HTML document that has the SVG map embedded. This function must accept only four parameters: the theme name, the key of the feature, and x and y, which specify the coordinates (in pixels) of the point at which the mouse moves out of a feature on the SVG map. For information about using JavaScript functions with SVG maps, see Appendix B.
workspace_name, workspace_savepoint, workspace_date, and workspace_date_format are optional attributes related to support for Workspace Manager in Mapviewer, which is explained in Section 2.8.
fetch_size is an optional attribute that specifies how many rows will be prefetched into memory. The default value is 100.
timeout is an optional attribute that specifies the number of milliseconds to wait for the connection to the WMS or WFS server.
3.1.2.21 themes Element
The <themes> element has the following definition:
<!ELEMENT themes (theme+) >
The <themes> element specifies one or more <theme> elements (described in Section 3.1.2.20). If you have specified a base map (basemap attribute of the map_request element), any themes that you specify in a <themes> element are plotted after those defined in the base map. If no base map is specified, only the specified themes are rendered.
Inside this <themes> element there must be one or more <theme> child elements, which are rendered in the order in which they appear.
3.1.2.22 theme_modifiers Element
The <theme_modifiers> element has the following definition:
<!ELEMENT theme_modifiers (theme_decorations)? >
The theme modifiers enable you to override the theme definition on a base map, without having to edit and change the base map definition. The <theme_decorations> element has the same attributes as the <theme> element (described in Section 3.1.2.20).
The following example overrides the labels_always_on attribute for the theme_us_airport theme on the base map FORCED_LABELING.
<?xml version="1.0" standalone="yes"?>
<map_request
  title="Override labeling on map definition"
  basemap="FORCED_LABELING"
  datasource="tilsmenv"
  width="500"
  height="375"
  bgcolor="#a6caf0"
  antialiase="true"
  format="PNG_URL">
  <center size="15.0">
    <geoFeature>
      <geometricProperty typeName="center">
        <Point>
          <coordinates>-122.4,37.8</coordinates>
        </Point>
      </geometricProperty>
    </geoFeature>
  </center>
  <theme_modifiers>
    <theme_decorations name="theme_us_airport" label_always_on="false"/>
  </theme_modifiers>
</map_request>
3.1.3 Information Request DTD
In addition to issuing map requests (see Section 3.1.2) and administrative requests (see Chapter 5), you can issue information requests to MapViewer. An information request is an XML request string that you can use to execute SQL queries and obtain the result as an array of strings or an XML document. The SQL query must be a SELECT statement and must select only primitive SQL types (for example, not LOB types or user-defined object types).
The following is the DTD for a MapViewer information request.
<!ELEMENT info_request (#PCDATA) >
<!ATTLIST info_request
               datasource CDATA #REQUIRED
               format     (strict | non-strict)  "strict"
>
datasource is a required attribute that specifies the data source for which to get the information.
format is an optional attribute. If it is strict (the default), all rows are formatted and returned in an XML document. If format is set to non-strict, all rows plus a column heading list are returned in a comma-delimited text string.
Example 3-24 shows an information request to select the city, 1990 population, and state abbreviation from the CITIES table, using the connection information in the mvdemo data source and returning the information as an XML document (format="strict").
Example 3-24 MapViewer Information Request
<?xml version="1.0" standalone="yes"?>
<info_request datasource="mvdemo"  format="strict">
        SELECT city, pop90 population, state_abrv state FROM cities
</info_request>
Example 3-24 returns an XML document that includes the following:
<?xml version="1.0" encoding="UTF-8"?>
  <ROWSET>
    <ROW num="1">
      <CITY>New York</CITY>
      <POPULATION>7322564</POPULATION>
      <STATE>NY</STATE>
    </ROW>
    <ROW num="2">
      <CITY>Los Angeles</CITY>
      <POPULATION>3485398</POPULATION>
      <STATE>CA</STATE>
    </ROW>
    <ROW num="3">
      <CITY>Chicago</CITY>
      <POPULATION>2783726</POPULATION>
      <STATE>IL</STATE>
    </ROW>
    <ROW num="4">
      <CITY>Houston</CITY>
      <POPULATION>1630553</POPULATION>
      <STATE>TX</STATE>
    </ROW>
     . . .
  </ROWSET>
3.1.4 Map Response DTD
The following is the DTD for the map response resulting from normal processing of a map request. (Section 3.1.5 shows the DTD for the response if there was an exception or unrecoverable error.)
<!ELEMENT map_response (map_image)>
<!ELEMENT map_image (map_content, box, themes, WMTException)>
<!ELEMENT map_content EMPTY>
<!ATTLIST map_content url CDATA #REQUIRED>
<!ELEMENT WMTException (#PCDATA)>
<!ATTLIST WMTException  version CDATA "1.0.0"
                        error_code (SUCCESS|FAILURE) #REQUIRED
>
The response includes the URL for retrieving the image, as well as any error information. When a valid map is generated, its minimum bounding box is also returned, along with the list of themes that have features within the minimum bounding rectangle (MBR) that intersects with the bounding box.
Example 3-25 shows a map response.
<?xml version="1.0" encoding="UTF-8" ?>
<map_response>
   <map_image>
     <map_content url="http://map.oracle.com/output/map029763.gif"/>
     <box srsName="default">
        <coordinates>-122.260443,37.531621 -120.345,39.543</coordinates>
     </box>
     <themes>
        <theme name="US_STATES" />
        <theme name="US_HIGHWAYS" />
     </themes>
     <WMTException version="1.0.0" error_code="SUCCESS">
     </WMTException>
   </map_image>
</map_response>
3.1.5 MapViewer Exception DTD
The following DTD is used by the output XML when an exception or unrecoverable error is encountered while processing a map request:
<!ELEMENT oms_error (#PCDATA)>
The exception or error message is embedded in this element.
3.1.6 Geometry DTD (OGC)
MapViewer supports the Geometry DTD as defined in the Open Geospatial Consortium (OGC) GML v1.0 specification. This specification has the following copyright information:
Copyright © 2000 OGC All Rights Reserved.
This specification includes the following status information, although its current official status is Deprecated Recommendation Paper:
This document is an OpenGIS® Consortium Recommendation Paper. It is similar to a
proposed recommendation in other organizations. While it reflects a public
statement of the official view of the OGC, it does not have the status of a OGC
Technology Specification. It is anticipated that the position stated in this
document will develop in response to changes in the underlying technology.
Although changes to this document are governed by a comprehensive review
procedure, it is expected that some of these changes may be significant.

The OGC explicitly invites comments on this document. Please send them to
gml.rfc@opengis.org
The following additional legal notice text applies to this specification:
THIS DOCUMENT IS PROVIDED "AS IS," AND COPYRIGHT HOLDERS MAKE NO REPRESENTATIONS OR WARRANTIES, EXPRESS OR IMPLIED, INCLUDING, BUT NOT LIMITED TO, WARRANTIES OF MERCHANTABILITY, FITNESS FOR A PARTICULAR PURPOSE, NON-INFRINGEMENT, OR TITLE; THAT THE CONTENTS OF THE DOCUMENT ARE SUITABLE FOR ANY PURPOSE; NOR THAT THE IMPLEMENTATION OF SUCH CONTENTS WILL NOT INFRINGE ANY THIRD PARTY PATENTS, COPYRIGHTS, TRADEMARKS OR OTHER RIGHTS

COPYRIGHT HOLDERS WILL NOT BE LIABLE FOR ANY DIRECT, INDIRECT, SPECIAL OR  CONSEQUENTIAL DAMAGES ARISING OUT OF ANY USE OF THE DOCUMENT OR THE PERFORMANCE OR IMPLEMENTATION OF THE CONTENTS THEREOF.
The OGC Geometry DTD in this specification is as follows:
<!-- ============================================================== -->
<!--        G e o g r a p h y                                       -->
<!--        M a r k u p                                             -->
<!--        L a n g u a g e                                         -->
<!--                                                                -->
<!--        ( G M L )                                               -->
<!--                                                                -->
<!--        G E O M E T R Y   D T D                                 -->
<!--                                                                -->
<!--  Copyright (c) 2000 OGC All Rights Reserved.                   -->
<!-- ============================================================== -->

<!-- the coordinate element holds a list of coordinates as parsed character
data. Note that it does not reference a SRS and does not constitute a proper
geometry class. -->
<!ELEMENT coordinates (#PCDATA) >
<!ATTLIST coordinates
   decimal  CDATA    #IMPLIED
   cs       CDATA    #IMPLIED
   ts       CDATA    #IMPLIED >

<!-- the Box element defines an extent using a pair of coordinates and a SRS name. -->
<!ELEMENT Box (coordinates) >
<!ATTLIST Box
   ID       CDATA    #IMPLIED
   srsName  CDATA    #REQUIRED >

<!-- ============================================================== -->
<!--  G E O M E T R Y   C L A S S   D e f i n i t i o n s           -->
<!-- ============================================================== -->

<!-- a Point is defined by a single coordinate. -->
<!ELEMENT Point (coordinates) >
<!ATTLIST Point
   ID       CDATA    #IMPLIED
   srsName  CDATA    #IMPLIED >

<!-- a LineString is defined by two or more coordinates, with linear
interoplation between them. -->
<!ELEMENT LineString (coordinates) >
<!ATTLIST LineString
   ID       CDATA    #IMPLIED
   srsName  CDATA    #IMPLIED >

<!-- a Polygon is defined by an outer boundary and zero or more inner
boundaries. These boundaries are themselves defined by LinerRings. -->
<!ELEMENT Polygon (outerBoundaryIs, innerBoundaryIs*) >
<!ATTLIST Polygon
   ID       CDATA    #IMPLIED
   srsName  CDATA    #IMPLIED >
<!ELEMENT outerBoundaryIs (LinearRing) >
<!ELEMENT innerBoundaryIs (LinearRing) >

<!-- a LinearRing is defined by four or more coordinates, with linear
interpolation between them. The first and last coordinates must be
coincident. -->
<!ELEMENT LinearRing (coordinates) >
<!ATTLIST LinearRing
   ID       CDATA    #IMPLIED >

<!-- a MultiPoint is defined by zero or more Points, referenced through a
pointMember element. -->
<!ELEMENT MultiPoint (pointMember+) >
<!ATTLIST MultiPoint
   ID       CDATA    #IMPLIED
   srsName  CDATA    #IMPLIED >
<!ELEMENT pointMember (Point) >

<!-- a MultiLineString is defined by zero or more LineStrings, referenced
through a lineStringMember element. -->
<!ELEMENT MultiLineString (lineStringMember+) >
<!ATTLIST MultiLineString
   ID       CDATA    #IMPLIED
   srsName  CDATA    #IMPLIED >
<!ELEMENT lineStringMember (LineString) >

<!-- a MultiPolygon is defined by zero or more Polygons, referenced through a
polygonMember element. -->
<!ELEMENT MultiPolygon (polygonMember+) >
<!ATTLIST MultiPolygon
   ID       CDATA    #IMPLIED
   srsName  CDATA    #IMPLIED >
<!ELEMENT polygonMember (Polygon) >

<!-- a GeometryCollection is defined by zero or more geometries, referenced
through a geometryMember element. A geometryMember element may be any one of
the geometry classes. -->
<!ENTITY % GeometryClasses "(
   Point | LineString | Polygon |
   MultiPoint | MultiLineString | MultiPolygon |
   GeometryCollection )" >

<!ELEMENT GeometryCollection (geometryMember+) >
<!ATTLIST GeometryCollection
   ID       CDATA    #IMPLIED
   srsName  CDATA    #IMPLIED >
<!ELEMENT geometryMember %GeometryClasses; >

<!-- ============================================================== -->
<!--   G E O M E T R Y   P R O P E R T Y   D e f i n i t i o n s    -->
<!-- ============================================================== -->

<!-- GML provides an 'endorsed' name to define the extent of a feature. The
extent is defined by a Box element, the name of the property is boundedBy. -->
<!ELEMENT boundedBy (Box) >

<!-- the generic geometryProperty can accept a geometry of any class. -->
<!ELEMENT geometryProperty (%GeometryClasses;) >

<!-- the pointProperty has three descriptive names: centerOf, location and
position. -->
<!ELEMENT pointProperty (Point) >
<!ELEMENT centerOf (Point) >
<!ELEMENT location (Point) >
<!ELEMENT position (Point) >

<!-- the lineStringProperty has two descriptive names: centerLineOf and
edgeOf. -->
<!ELEMENT lineStringProperty (LineString) >
<!ELEMENT centerLineOf (LineString)>
<!ELEMENT edgeOf (LineString)>

<!-- the polygonProperty has two descriptive names: coverage and extentOf. -->
<!ELEMENT polygonProperty (Polygon) >
<!ELEMENT coverage (Polygon)>
<!ELEMENT extentOf (Polygon)>

<!-- the multiPointProperty has three descriptive names: multiCenterOf,
multiLocation and multiPosition. -->
<!ELEMENT multiPointProperty (MultiPoint) >
<!ELEMENT multiCenterOf (MultiPoint) >
<!ELEMENT multiLocation (MultiPoint) >
<!ELEMENT multiPosition (MultiPoint) >

<!-- the multiLineStringProperty has two descriptive names: multiCenterLineOf
and multiEdgeOf. -->
<!ELEMENT multiLineStringProperty (MultiLineString) >
<!ELEMENT multiCenterLineOf (MultiLineString) >
<!ELEMENT multiEdgeOf (MultiLineString) >

<!-- the multiPolygonProperty has two descriptive names: multiCoverage and
multiExtentOf. -->
<!ELEMENT multiPolygonProperty (MultiPolygon) >
<!ELEMENT multiCoverage (MultiPolygon) >
<!ELEMENT multiExtentOf (MultiPolygon) >

<!ELEMENT geometryCollectionProperty (GeometryCollection) >

<!-- ============================================================== -->
<!--     F E A T U R E   M E T A D A T A   D e f i n i t i o n s    -->
<!-- ============================================================== -->

<!-- Feature metadata, included in GML Geometry DTD for convenience; name and
description are two 'standard' string properties defined by GML. -->

<!ELEMENT name (#PCDATA)>
<!ELEMENT description (#PCDATA)>
3.2 MapViewer Map Data Server
The MapViewer map data server provides services for streaming live data from a database server to a client. The data can be consumed by the Oracle Maps JavaScript V2 API client, or be edited by the V2 API editing utilities. It is also used as the middle-tier component for handling data synchronization tasks.
At the most basic level, a client sends a request to the map data server, specifying the name of a theme and an optional bounding box. The server then returns the live data (including both geometries and attributes) in compressed GeoJSON format.
Topics:
3.2.1 Domains and Map Data Server URL Patterns
The map data server uses domains, where each domain corresponds to a MapViewer data source. For example, to request data from the mvdemo data source, the URL must have the following pattern:
http://example.com:8080/mapviewer/dataserver/mvdemo?
In this URL request, /dataserver refers to the map data server. /mvdemo is the path information, which indicates which domain or data source this request is directed against. There is no need to specify the data source explicitly in the rest of the URL request. This URL pattern provides flexibility in terms of protection. A user or a web administrator can easily set up different levels of protection for different domains using such a URL pattern.
To get a quick help regarding the full list of supported HTTP request parameters, you can issue a request that includes the help parameter. For example:
http://example:8080/mapviewer/dataserver/mvdemo?help=true
This example returns a list of supported parameters. (Note that the /mvdemo path is still required even for this help request.)
3.2.2 Map Data Server Request Parameters
In a map data server request to get data, the URL must include appropriate query parameters. The data could be from a MapViewer predefined geometry theme or JDBC theme.
3.2.2.1 Getting Data from a Predefined Geometry Theme
Before getting data from a predefined geometry theme, be sure that the predefined geometry theme is properly defined. If it is not properly defined, modify its definition or create a new predefined geometry theme with the proper definition.
Besides the geometry column of a spatial table, if you also need some attribute columns for an application, then your geometry theme's STYLING_RULES column must have the <hidden_info> element for defining needed attributes. For example, if your application needs a geometry theme (such as CUSTOMERS) to represent a spatial table, and if you also need each customer's name, city, and sales amount, then the STYLING_RULES should look similar to the following:
SQL> select STYLING_RULES from user_sdo_themes where name='CUSTOMERS';

STYLING_RULES
--------------------------------------------------------------------------------
<?xml version="1.0" standalone="yes"?>
<styling_rules>
  <hidden_info>
    <field column="name" name="Name"/>
    <field column="city" name="City"/>
    <field column="sales" name="Sales"/>
  </hidden_info>
  <rule>
    <features style="M.STOPLIGHT_RED"> </features>
  </rule>
</styling_rules>
The Map Builder utility is the recommended tool for modifying or creating geometry themes.
For information using styling rules in a predefined geometry theme, see Section 2.3.1.1, "Styling Rules in Predefined Spatial Geometry Themes".
The following parameters are available for a map data server request to get data from a MapViewer predefined geometry theme. The t (theme name) parameter is required; the others are optional.
-
t: Name of the theme. -
bbox: Bounding box. Must be a comma-delimited list ofminx,miny,maxx,maxy. -
to_srid: SRID (spatial reference system) in which to return the data. -
bbox_srid: SRID (spatial reference system) of the bounding box, if different from the native SRID of the data. -
seq: Sequence ID, to be used when getting data in multipart format. -
dadp: Digits after decimal point: the maximum number of digits after the decimal point for the coordinates in the returned data. -
include_style_info: Determines whether styling information (rendering/labeling style name and related columns) should be included with each feature. (The default istrue.) -
include_label_box: Determines whether a label box should be included with each polygon feature. (The default istrue.) A label box is a near maximum rectangle inside the polygon. A label placed inside this rectangle is guaranteed to be completely inside the polygon feature. This parameter is ignored for non-polygon features.
The following are some examples.
To get all the data from the CITIES table in the 3857 SRID:
http://example:8080/mapviewer/dataserver/mvdemo?t=theme_demo_cities&to_srid=3857
To get all the data from the CITIES table that interacts with a specified bbox in 3857 SRID:
http://example:8080/mapviewer/dataserver/mvdemo?t=theme_demo_cities&bbox=-122.0,25,-100,45&to_srid=3857
To get all the data from the CITIES table that interacts with a specified bbox in 3857 SRID, with 3 digits after the decimal points, and without styling information:
http://example:8080/mapviewer/dataserver/mvdemo?t=theme_demo_cities&bbox=-122.0,25,-100,45&to_srid=3857&dadp=3&include_style_info=no
To get all data from the COUNTIES table and include label boxes:
http://example:8080/mapviewer/dataserver/mvdemo?t=theme_demo_counties&include_label_box=yes
3.2.2.2 Getting Data from a JDBC Theme
The following parameters are available for a map data server request to get data from a MapViewer theme based on a dynamic JDBC theme. The t (theme name) and sql (SQL query) parameters are required; the others are optional.
-
t: Name of the theme. -
sql: The complete SQL query, properly URL encoded. -
asis: Determines whether the query should be executed "as is". The default isfalse, which causes MapViewer to embed the SQL query as a subquery of its spatial filter query. If the value istrue, MapViewer does not attempt to modify the supplied query string. -
bbox: Bounding box. Must be a comma-delimited list ofminx,miny,maxx,maxy. -
to_srid: SRID (spatial reference system) in which to return the data. -
bbox_srid: SRID (spatial reference system) of the bounding box, if different from the native SRID of the data. -
seq: Sequence ID, to be used when getting data in multipart format. -
dadp: Digits after decimal point: the maximum number of digits after the decimal point for the coordinates in the returned data. -
include_style_info: Determines whether styling information (rendering/labeling style name and related columns) should be included with each feature. (The default istrue.) -
include_label_box: Determines whether a label box should be included with each polygon feature. (The default istrue.) A label box is a near maximum rectangle inside the polygon. A label placed inside this rectangle is guaranteed to be completely inside the polygon feature. This parameter is ignored for non-polygon features.
The following are some examples.
To get all the data of the CITIES table in SRID 3857:
http://example:8080/mapviewer/dataserver/mvdemo?t=theme1&sql=select+*+from+cities&to_srid=3857
To get all the data of the table CITIES within a given bbox in SRID 3857:
http://example:8080/mapviewer/dataserver/mvdemo?t=theme1&sql=select+*+from+cities&to_srid=3857&bbox=-122.0,25,-100,45
To run the query as is, without a bbox and return data in SRID 3857:
http://example:8080/mapviewer/dataserver/mvdemo?t=theme1&sql=select+*+from+cities&to_srid=3857&bbox=-122.0,25,-100,45&asis=t
3.2.2.3 Getting Annotation Text from a JDBC Theme
A request to retrieve annotation text elements from a JDBC theme is similar to that in Section 3.2.2.2, "Getting Data from a JDBC Theme"
The following parameters are available for a map data server request to get data from a MapViewer theme based on a dynamic JDBC theme. The t (theme name), sql (SQL query, geom_type, and base_table parameters are required; the others are optional.
-
t: Name of the theme. -
sql: The complete SQL query, properly URL encoded. -
geom_type: Must be specified asannotationto indicate that the spatial column is on annotation type. -
base_table: The database table (for the server to read annotation text metadata information for that table). -
asis: Determines whether the query should be executed "as is". The default isfalse, which causes MapViewer to embed the SQL query as a subquery of its spatial filter query. If the value istrue, MapViewer does not attempt to modify the supplied query string. -
bbox: Bounding box. Must be a comma-delimited list ofminx,miny,maxx,maxy. -
to_srid: SRID (spatial reference system) in which to return the data. -
bbox_srid: SRID (spatial reference system) of the bounding box, if different from the native SRID of the data. -
seq: Sequence ID, to be used when getting data in multipart format. -
dadp: Digits after decimal point: the maximum number of digits after the decimal point for the coordinates in the returned data. -
include_style_info: Determines whether styling information (rendering/labeling style name and related columns) should be included with each feature. (The default istrue.) -
include_label_box: Determines whether a label box should be included with each polygon feature. (The default istrue.) A label box is a near maximum rectangle inside the polygon. A label placed inside this rectangle is guaranteed to be completely inside the polygon feature. This parameter is ignored for non-polygon features.
The following example retrieves annotation text information:
http://example:8080/mapviewer/dataserver/tilsmenv?t=theme1&sql=select+*+from+annotext_table&geom_col=textobj&geom_type=annotation&base_table=annotext_table&bbox=0,0,10,10
A typical response includes the annotation text table metadata information plus the annotation text feature. Each annotation text feature can have one or more text elements. Each text element can be defined by a text value, a location, a leader line, and graphic attributes. Refer to OGC specification of annotation texts for additional information.
The response looks like the following:
{"type":"AnnotationText",
"collectionName":"theme1",
"srs":0,
"geodetic":false,
"bbox":[0, 0, 10, 10],
"attr_names":["ID"],
"attr_types":["double"],
"default_text_attributes":{"fontWeight":"Normal","fontStyle":"Normal","textDecoration":"None","letterSpacing":"Normal","wordSpacing":"Normal","fill":"black","fill-opacity":1.0,"stroke":"black","strokeWidth":1.0,"stroke-opacity":1.0,"horizontalAlignment":"start","verticalAlignment":"top","multilineJustification":"left","multilineSpacing":0.0},
"metadata":{"textExpression":"name","textAttributes":{"fontFamily":"Serif","fontSize":14.0,"fill":"#ff0000"}},
"features":[
{"type":"AnnoText", "elements":[{"location":{"type":"Point", "coordinates":[1, 1]},"textValue":"Sample Label 1","leaderLine":{"type":"LineString", "coordinates":[0,0,1,1]}}],"envelope":{"type":"Rectangle", "coordinates":[0,0,1,1]},"properties":{"ID":"1.0"}},
{"type":"AnnoText", "elements":[{"location":{"type":"LineString", "coordinates":[2,5,4,5,6,5]},"leaderLine":{"type":"LineString", "coordinates":[4,3,4,5]},"textAttributes":{"fontFamily":"Dialog","fontSize":14.0,"fill":"blue"}}],"envelope":{"type":"Rectangle", "coordinates":[2,3,6,5]},"properties":{"ID":"3.0"}},
{"type":"AnnoText", "elements":[{"location":{"type":"Point", "coordinates":[10, 10]},"textValue":"Sample Label 2","leaderLine":{"type":"LineString", "coordinates":[5,10,10,10]}}],"envelope":{"type":"LineString", "coordinates":[5,10,10,10]},"properties":{"ID":"2.0"}}
]}
3.2.2.4 Getting Topology Data
A topology set is defined by a set of topology primitives (faces, edges, and nodes(. Each topology feature can be associated with one or more topology primitives.
A request to retrieve the topology primitives must contain the topology parameter, as in the following example:
http://example:8080/mapviewer/dataserver/tilsmenv?topology=city_data&bbox=10,10,35,35
The response includes all primitives that interact with input MBR:
{"type":"TopologyPrimitives",
"topology":"city_data",
"srs":0,
"bbox":[0, 0, 62, 42],
"face_attr_names":["FACE_ID","BOUNDARY_EDGE_ID","ISLAND_EDGE_ID_LIST","ISLAND_NODE_ID_LIST"],
"face_attr_types":["integer","integer","array:integer","array:integer"],
"edge_attr_names":["EDGE_ID","START_NODE_ID","END_NODE_ID","NEXT_LEFT_EDGE_ID","PREV_LEFT_EDGE_ID","NEXT_RIGHT_EDGE_ID","PREV_RIGHT_EDGE_ID","LEFT_FACE_ID","RIGHT_FACE_ID"],
"edge_attr_types":["integer","integer","integer","integer","integer","integer","integer","integer","integer"],
"node_attr_names":["NODE_ID","EDGE_ID","FACE_ID"],
"node_attr_types":["integer","integer","integer"],
"primitives":[
{"type":"Face", "mbr_geometry":{"type":"Rectangle", "coordinates":[3,30,15,38]}, "properties":{"FACE_ID":"1", "BOUNDARY_EDGE_ID":"1", "ISLAND_EDGE_ID_LIST":[25]}},
{"type":"Face", "mbr_geometry":{"type":"Rectangle", "coordinates":[9,14,21,22]}, "properties":{"FACE_ID":"3", "BOUNDARY_EDGE_ID":"19"}},
{"type":"Face", "mbr_geometry":{"type":"Rectangle", "coordinates":[9,6,21,14]}, "properties":{"FACE_ID":"6", "BOUNDARY_EDGE_ID":"20"}},
{"type":"Face", "mbr_geometry":{"type":"Rectangle", "coordinates":[17,30,31,40]}, "properties":{"FACE_ID":"2", "BOUNDARY_EDGE_ID":"2", "ISLAND_NODE_ID_LIST":[4]}},
{"type":"Face", "mbr_geometry":{"type":"Rectangle", "coordinates":[21,6,35,14]}, "properties":{"FACE_ID":"7", "BOUNDARY_EDGE_ID":"10"}},
{"type":"Face", "mbr_geometry":{"type":"Rectangle", "coordinates":[21,14,35,22]}, "properties":{"FACE_ID":"4", "BOUNDARY_EDGE_ID":"17"}},
{"type":"Face", "mbr_geometry":{"type":"Rectangle", "coordinates":[35,14,47,22]}, "properties":{"FACE_ID":"5", "BOUNDARY_EDGE_ID":"15"}},
{"type":"Face", "mbr_geometry":{"type":"Rectangle", "coordinates":[35,6,47,14]}, "properties":{"FACE_ID":"8", "BOUNDARY_EDGE_ID":"16"}},
{"type":"Edge", "geometry":{"type":"LineString", "coordinates":[8,30,16,30,16,38,3,38,3,30,8,30]}, "properties":{"EDGE_ID":"1", "START_NODE_ID":"1", "END_NODE_ID":"1", "NEXT_LEFT_EDGE_ID":"1", "PREV_LEFT_EDGE_ID":"1", "NEXT_RIGHT_EDGE_ID":"-1", "PREV_RIGHT_EDGE_ID":"-1", "LEFT_FACE_ID":"1", "RIGHT_FACE_ID":"-1"}},
{"type":"Edge", "geometry":{"type":"LineString", "coordinates":[4,31,7,31,7,34,4,34,4,31]}, "properties":{"EDGE_ID":"26", "START_NODE_ID":"20", "END_NODE_ID":"20", "NEXT_LEFT_EDGE_ID":"26", "PREV_LEFT_EDGE_ID":"26", "NEXT_RIGHT_EDGE_ID":"-26", "PREV_RIGHT_EDGE_ID":"-26", "LEFT_FACE_ID":"9", "RIGHT_FACE_ID":"1"}},
{"type":"Edge", "geometry":{"type":"LineString", "coordinates":[9,22,21,22]}, "properties":{"EDGE_ID":"6", "START_NODE_ID":"16", "END_NODE_ID":"17", "NEXT_LEFT_EDGE_ID":"7", "PREV_LEFT_EDGE_ID":"21", "NEXT_RIGHT_EDGE_ID":"-21", "PREV_RIGHT_EDGE_ID":"19", "LEFT_FACE_ID":"-1", "RIGHT_FACE_ID":"3"}},
{"type":"Edge", "geometry":{"type":"LineString", "coordinates":[9,14,9,22]}, "properties":{"EDGE_ID":"21", "START_NODE_ID":"15", "END_NODE_ID":"16", "NEXT_LEFT_EDGE_ID":"6", "PREV_LEFT_EDGE_ID":"22", "NEXT_RIGHT_EDGE_ID":"9", "PREV_RIGHT_EDGE_ID":"-6", "LEFT_FACE_ID":"-1", "RIGHT_FACE_ID":"3"}},
{"type":"Edge", "geometry":{"type":"LineString", "coordinates":[9,14,21,14]}, "properties":{"EDGE_ID":"9", "START_NODE_ID":"15", "END_NODE_ID":"14", "NEXT_LEFT_EDGE_ID":"19", "PREV_LEFT_EDGE_ID":"-21", "NEXT_RIGHT_EDGE_ID":"-22", "PREV_RIGHT_EDGE_ID":"20", "LEFT_FACE_ID":"3", "RIGHT_FACE_ID":"6"}},
{"type":"Edge", "geometry":{"type":"LineString", "coordinates":[9,6,21,6]}, "properties":{"EDGE_ID":"12", "START_NODE_ID":"8", "END_NODE_ID":"9", "NEXT_LEFT_EDGE_ID":"20", "PREV_LEFT_EDGE_ID":"-22", "NEXT_RIGHT_EDGE_ID":"22", "PREV_RIGHT_EDGE_ID":"-13", "LEFT_FACE_ID":"6", "RIGHT_FACE_ID":"-1"}},
{"type":"Edge", "geometry":{"type":"LineString", "coordinates":[9,35,13,35]}, "properties":{"EDGE_ID":"25", "START_NODE_ID":"21", "END_NODE_ID":"22", "NEXT_LEFT_EDGE_ID":"-25", "PREV_LEFT_EDGE_ID":"-25", "NEXT_RIGHT_EDGE_ID":"25", "PREV_RIGHT_EDGE_ID":"25", "LEFT_FACE_ID":"1", "RIGHT_FACE_ID":"1"}},
{"type":"Edge", "geometry":{"type":"LineString", "coordinates":[9,6,9,14]}, "properties":{"EDGE_ID":"22", "START_NODE_ID":"8", "END_NODE_ID":"15", "NEXT_LEFT_EDGE_ID":"21", "PREV_LEFT_EDGE_ID":"-12", "NEXT_RIGHT_EDGE_ID":"12", "PREV_RIGHT_EDGE_ID":"-9", "LEFT_FACE_ID":"-1", "RIGHT_FACE_ID":"6"}},
{"type":"Edge", "geometry":{"type":"LineString", "coordinates":[25,30,31,30,31,40,17,40,17,30,25,30]}, "properties":{"EDGE_ID":"2", "START_NODE_ID":"2", "END_NODE_ID":"2", "NEXT_LEFT_EDGE_ID":"3", "PREV_LEFT_EDGE_ID":"-3", "NEXT_RIGHT_EDGE_ID":"-2", "PREV_RIGHT_EDGE_ID":"-2", "LEFT_FACE_ID":"2", "RIGHT_FACE_ID":"-1"}},
{"type":"Edge", "geometry":{"type":"LineString", "coordinates":[21,6,35,6]}, "properties":{"EDGE_ID":"13", "START_NODE_ID":"9", "END_NODE_ID":"10", "NEXT_LEFT_EDGE_ID":"18", "PREV_LEFT_EDGE_ID":"-20", "NEXT_RIGHT_EDGE_ID":"-12", "PREV_RIGHT_EDGE_ID":"-14", "LEFT_FACE_ID":"7", "RIGHT_FACE_ID":"-1"}},
{"type":"Edge", "geometry":{"type":"LineString", "coordinates":[21,22,35,22]}, "properties":{"EDGE_ID":"7", "START_NODE_ID":"17", "END_NODE_ID":"18", "NEXT_LEFT_EDGE_ID":"8", "PREV_LEFT_EDGE_ID":"6", "NEXT_RIGHT_EDGE_ID":"-19", "PREV_RIGHT_EDGE_ID":"17", "LEFT_FACE_ID":"-1", "RIGHT_FACE_ID":"4"}},
{"type":"Edge", "geometry":{"type":"LineString", "coordinates":[21,6,21,14]}, "properties":{"EDGE_ID":"20", "START_NODE_ID":"9", "END_NODE_ID":"14", "NEXT_LEFT_EDGE_ID":"-9", "PREV_LEFT_EDGE_ID":"12", "NEXT_RIGHT_EDGE_ID":"13", "PREV_RIGHT_EDGE_ID":"10", "LEFT_FACE_ID":"6", "RIGHT_FACE_ID":"7"}},
{"type":"Edge", "geometry":{"type":"LineString", "coordinates":[35,14,21,14]}, "properties":{"EDGE_ID":"10", "START_NODE_ID":"13", "END_NODE_ID":"14", "NEXT_LEFT_EDGE_ID":"-20", "PREV_LEFT_EDGE_ID":"18", "NEXT_RIGHT_EDGE_ID":"17", "PREV_RIGHT_EDGE_ID":"-19", "LEFT_FACE_ID":"7", "RIGHT_FACE_ID":"4"}},
{"type":"Edge", "geometry":{"type":"LineString", "coordinates":[21,14,21,22]}, "properties":{"EDGE_ID":"19", "START_NODE_ID":"14", "END_NODE_ID":"17", "NEXT_LEFT_EDGE_ID":"-6", "PREV_LEFT_EDGE_ID":"9", "NEXT_RIGHT_EDGE_ID":"-10", "PREV_RIGHT_EDGE_ID":"-7", "LEFT_FACE_ID":"3", "RIGHT_FACE_ID":"4"}},
{"type":"Edge", "geometry":{"type":"LineString", "coordinates":[25,30,25,35]}, "properties":{"EDGE_ID":"3", "START_NODE_ID":"2", "END_NODE_ID":"3", "NEXT_LEFT_EDGE_ID":"-3", "PREV_LEFT_EDGE_ID":"2", "NEXT_RIGHT_EDGE_ID":"2", "PREV_RIGHT_EDGE_ID":"3", "LEFT_FACE_ID":"2", "RIGHT_FACE_ID":"2"}},
{"type":"Edge", "geometry":{"type":"LineString", "coordinates":[35,6,47,6]}, "properties":{"EDGE_ID":"14", "START_NODE_ID":"10", "END_NODE_ID":"11", "NEXT_LEFT_EDGE_ID":"16", "PREV_LEFT_EDGE_ID":"-18", "NEXT_RIGHT_EDGE_ID":"-13", "PREV_RIGHT_EDGE_ID":"-16", "LEFT_FACE_ID":"8", "RIGHT_FACE_ID":"-1"}},
{"type":"Edge", "geometry":{"type":"LineString", "coordinates":[35,14,47,14]}, "properties":{"EDGE_ID":"11", "START_NODE_ID":"13", "END_NODE_ID":"12", "NEXT_LEFT_EDGE_ID":"15", "PREV_LEFT_EDGE_ID":"-17", "NEXT_RIGHT_EDGE_ID":"-18", "PREV_RIGHT_EDGE_ID":"16", "LEFT_FACE_ID":"5", "RIGHT_FACE_ID":"8"}},
{"type":"Edge", "geometry":{"type":"LineString", "coordinates":[35,6,35,14]}, "properties":{"EDGE_ID":"18", "START_NODE_ID":"10", "END_NODE_ID":"13", "NEXT_LEFT_EDGE_ID":"10", "PREV_LEFT_EDGE_ID":"13", "NEXT_RIGHT_EDGE_ID":"14", "PREV_RIGHT_EDGE_ID":"-11", "LEFT_FACE_ID":"7", "RIGHT_FACE_ID":"8"}},
{"type":"Edge", "geometry":{"type":"LineString", "coordinates":[35,22,47,22]}, "properties":{"EDGE_ID":"8", "START_NODE_ID":"18", "END_NODE_ID":"19", "NEXT_LEFT_EDGE_ID":"-15", "PREV_LEFT_EDGE_ID":"7", "NEXT_RIGHT_EDGE_ID":"-17", "PREV_RIGHT_EDGE_ID":"15", "LEFT_FACE_ID":"-1", "RIGHT_FACE_ID":"5"}},
{"type":"Edge", "geometry":{"type":"LineString", "coordinates":[35,14,35,22]}, "properties":{"EDGE_ID":"17", "START_NODE_ID":"13", "END_NODE_ID":"18", "NEXT_LEFT_EDGE_ID":"-7", "PREV_LEFT_EDGE_ID":"-10", "NEXT_RIGHT_EDGE_ID":"11", "PREV_RIGHT_EDGE_ID":"-8", "LEFT_FACE_ID":"4", "RIGHT_FACE_ID":"5"}},
{"type":"Edge", "geometry":{"type":"LineString", "coordinates":[36,38,38,35,41,34,42,33,45,32,47,28,50,28,52,32,57,33]}, "properties":{"EDGE_ID":"4", "START_NODE_ID":"5", "END_NODE_ID":"6", "NEXT_LEFT_EDGE_ID":"-5", "PREV_LEFT_EDGE_ID":"-4", "NEXT_RIGHT_EDGE_ID":"4", "PREV_RIGHT_EDGE_ID":"5", "LEFT_FACE_ID":"-1", "RIGHT_FACE_ID":"-1"}},
{"type":"Edge", "geometry":{"type":"LineString", "coordinates":[41,40,45,40,47,42,62,41,61,38,59,39,57,36,57,33]}, "properties":{"EDGE_ID":"5", "START_NODE_ID":"7", "END_NODE_ID":"6", "NEXT_LEFT_EDGE_ID":"-4", "PREV_LEFT_EDGE_ID":"-5", "NEXT_RIGHT_EDGE_ID":"5", "PREV_RIGHT_EDGE_ID":"4", "LEFT_FACE_ID":"-1", "RIGHT_FACE_ID":"-1"}},
{"type":"Edge", "geometry":{"type":"LineString", "coordinates":[47,14,47,22]}, "properties":{"EDGE_ID":"15", "START_NODE_ID":"12", "END_NODE_ID":"19", "NEXT_LEFT_EDGE_ID":"-8", "PREV_LEFT_EDGE_ID":"11", "NEXT_RIGHT_EDGE_ID":"-16", "PREV_RIGHT_EDGE_ID":"8", "LEFT_FACE_ID":"5", "RIGHT_FACE_ID":"-1"}},
{"type":"Edge", "geometry":{"type":"LineString", "coordinates":[47,6,47,14]}, "properties":{"EDGE_ID":"16", "START_NODE_ID":"11", "END_NODE_ID":"12", "NEXT_LEFT_EDGE_ID":"-11", "PREV_LEFT_EDGE_ID":"14", "NEXT_RIGHT_EDGE_ID":"-14", "PREV_RIGHT_EDGE_ID":"-15", "LEFT_FACE_ID":"8", "RIGHT_FACE_ID":"-1"}},
{"type":"Node", "geometry":{"type":"Point", "coordinates":[4, 31]}, "properties":{"NODE_ID":"20", "EDGE_ID":"26", "FACE_ID":"0"}},
{"type":"Node", "geometry":{"type":"Point", "coordinates":[8, 30]}, "properties":{"NODE_ID":"1", "EDGE_ID":"1", "FACE_ID":"0"}},
{"type":"Node", "geometry":{"type":"Point", "coordinates":[9, 6]}, "properties":{"NODE_ID":"8", "EDGE_ID":"12", "FACE_ID":"0"}},
{"type":"Node", "geometry":{"type":"Point", "coordinates":[9, 35]}, "properties":{"NODE_ID":"21", "EDGE_ID":"25", "FACE_ID":"0"}},
{"type":"Node", "geometry":{"type":"Point", "coordinates":[9, 14]}, "properties":{"NODE_ID":"15", "EDGE_ID":"21", "FACE_ID":"0"}},
{"type":"Node", "geometry":{"type":"Point", "coordinates":[9, 22]}, "properties":{"NODE_ID":"16", "EDGE_ID":"6", "FACE_ID":"0"}},
{"type":"Node", "geometry":{"type":"Point", "coordinates":[13, 35]}, "properties":{"NODE_ID":"22", "EDGE_ID":"-25", "FACE_ID":"0"}},
{"type":"Node", "geometry":{"type":"Point", "coordinates":[20, 37]}, "properties":{"NODE_ID":"4", "EDGE_ID":"0", "FACE_ID":"2"}},
{"type":"Node", "geometry":{"type":"Point", "coordinates":[21, 14]}, "properties":{"NODE_ID":"14", "EDGE_ID":"19", "FACE_ID":"0"}},
{"type":"Node", "geometry":{"type":"Point", "coordinates":[21, 22]}, "properties":{"NODE_ID":"17", "EDGE_ID":"7", "FACE_ID":"0"}},
{"type":"Node", "geometry":{"type":"Point", "coordinates":[21, 6]}, "properties":{"NODE_ID":"9", "EDGE_ID":"20", "FACE_ID":"0"}},
{"type":"Node", "geometry":{"type":"Point", "coordinates":[25, 30]}, "properties":{"NODE_ID":"2", "EDGE_ID":"2", "FACE_ID":"0"}},
{"type":"Node", "geometry":{"type":"Point", "coordinates":[25, 35]}, "properties":{"NODE_ID":"3", "EDGE_ID":"-3", "FACE_ID":"0"}},
{"type":"Node", "geometry":{"type":"Point", "coordinates":[35, 14]}, "properties":{"NODE_ID":"13", "EDGE_ID":"17", "FACE_ID":"0"}},
{"type":"Node", "geometry":{"type":"Point", "coordinates":[35, 6]}, "properties":{"NODE_ID":"10", "EDGE_ID":"18", "FACE_ID":"0"}},
{"type":"Node", "geometry":{"type":"Point", "coordinates":[35, 22]}, "properties":{"NODE_ID":"18", "EDGE_ID":"8", "FACE_ID":"0"}},
{"type":"Node", "geometry":{"type":"Point", "coordinates":[36, 38]}, "properties":{"NODE_ID":"5", "EDGE_ID":"4", "FACE_ID":"0"}},
{"type":"Node", "geometry":{"type":"Point", "coordinates":[41, 40]}, "properties":{"NODE_ID":"7", "EDGE_ID":"5", "FACE_ID":"0"}},
{"type":"Node", "geometry":{"type":"Point", "coordinates":[47, 14]}, "properties":{"NODE_ID":"12", "EDGE_ID":"15", "FACE_ID":"0"}},
{"type":"Node", "geometry":{"type":"Point", "coordinates":[47, 6]}, "properties":{"NODE_ID":"11", "EDGE_ID":"-14", "FACE_ID":"0"}},
{"type":"Node", "geometry":{"type":"Point", "coordinates":[47, 22]}, "properties":{"NODE_ID":"19", "EDGE_ID":"-15", "FACE_ID":"0"}},
{"type":"Node", "geometry":{"type":"Point", "coordinates":[57, 33]}, "properties":{"NODE_ID":"6", "EDGE_ID":"-4", "FACE_ID":"0"}}
]}
To retrieve topology features, the following example specifies the topology, base_table, and geom_col parameters (where grom_col refers to the topology column):
http://example:8080/mapviewer/dataserver/tilsmenv?topology=city_data&base_table=land_parcels&geom_col=feature
The response to this request is similar to the following:
{"type":"TopologyFeatures",
"topology":"CITY_DATA",
"topology_id":5,
"topology_owner":"TILSZUSER",
"tolerance":5.0E-5,
"srs":0,
"table_schema":"TILSZUSER",
"table_name":"LAND_PARCELS",
"topo_column":"FEATURE",
"layer_id":1,
"layer_type":"POLYGON",
"layer_level":0,
"child_layer":0,
"node_sequence":"CITY_DATA_NODE_S",
"edge_sequence":"CITY_DATA_EDGE_S",
"face_sequence":"CITY_DATA_FACE_S",
"feature_sequence":"CITY_DATA_TG_S",
"digits_right_decimal":16,
"attr_names":["FEATURE_NAME"],
"attr_types":["string"],
"features":[
{"type":"topology", "tg_id":4, "primitives":[{"topo_id":3,"topo_type":3},{"topo_id":6,"topo_type":3}], "properties":{"FEATURE_NAME":"P1"}},
{"type":"topology", "tg_id":5, "primitives":[{"topo_id":4,"topo_type":3},{"topo_id":7,"topo_type":3}], "properties":{"FEATURE_NAME":"P2"}},
{"type":"topology", "tg_id":6, "primitives":[{"topo_id":5,"topo_type":3},{"topo_id":8,"topo_type":3}], "properties":{"FEATURE_NAME":"P3"}},
{"type":"topology", "tg_id":7, "primitives":[{"topo_id":2,"topo_type":3}], "properties":{"FEATURE_NAME":"P4"}},
{"type":"topology", "tg_id":8, "primitives":[{"topo_id":1,"topo_type":3}], "properties":{"FEATURE_NAME":"P5"}}
]}
To specific primitive faces, edges, and nodes, the following example define the primitive identifiers:
http://example:8080/mapviewer/dataserver/tilsmenv?topology=city_data&face_ids=-1&edge_ids=3,4&node_ids=5
The response to this request is similar to the following:
{"type":"TopologyPrimitives",
"topology":"city_data",
"srs":0,
"bbox":[0, 0, 57, 38],
"face_attr_names":["FACE_ID","BOUNDARY_EDGE_ID","ISLAND_EDGE_ID_LIST","ISLAND_NODE_ID_LIST"],
"face_attr_types":["integer","integer","array:integer","array:integer"],
"edge_attr_names":["EDGE_ID","START_NODE_ID","END_NODE_ID","NEXT_LEFT_EDGE_ID","PREV_LEFT_EDGE_ID","NEXT_RIGHT_EDGE_ID","PREV_RIGHT_EDGE_ID","LEFT_FACE_ID","RIGHT_FACE_ID"],
"edge_attr_types":["integer","integer","integer","integer","integer","integer","integer","integer","integer"],
"node_attr_names":["NODE_ID","EDGE_ID","FACE_ID"],
"node_attr_types":["integer","integer","integer"],
"primitives":[
{"type":"Face", "properties":{"FACE_ID":"-1", "BOUNDARY_EDGE_ID":"0", "ISLAND_EDGE_ID_LIST":[-1,-2,4,6]}},
{"type":"Edge", "geometry":{"type":"LineString", "coordinates":[25,30,25,35]}, "properties":{"EDGE_ID":"3", "START_NODE_ID":"2", "END_NODE_ID":"3", "NEXT_LEFT_EDGE_ID":"-3", "PREV_LEFT_EDGE_ID":"2", "NEXT_RIGHT_EDGE_ID":"2", "PREV_RIGHT_EDGE_ID":"3", "LEFT_FACE_ID":"2", "RIGHT_FACE_ID":"2"}},
{"type":"Edge", "geometry":{"type":"LineString", "coordinates":[36,38,38,35,41,34,42,33,45,32,47,28,50,28,52,32,57,33]}, "properties":{"EDGE_ID":"4", "START_NODE_ID":"5", "END_NODE_ID":"6", "NEXT_LEFT_EDGE_ID":"-5", "PREV_LEFT_EDGE_ID":"-4", "NEXT_RIGHT_EDGE_ID":"4", "PREV_RIGHT_EDGE_ID":"5", "LEFT_FACE_ID":"-1", "RIGHT_FACE_ID":"-1"}},
{"type":"Node", "geometry":{"type":"Point", "coordinates":[36, 38]}, "properties":{"NODE_ID":"5", "EDGE_ID":"4", "FACE_ID":"0"}}
]}
3.2.3 Interpreting Data Returned from the Map Data Server
The map data server returns data in a compressed GeoJSON format. Some minor changes and additions to the standard GeoJSON are made to improve performance and the usefulness of the information.
The following is a sample response:
{"type":"FeatureCollection",
"collectionName":"theme1",
"srs":3857,
"geodetic":false,
"bbox":[-17566686.86258, 2414218.89842, -7905675.57465, 8629389.76988],
"attr_names":["CITY","STATE_ABRV","POP90","RANK90"],
"attr_types":["string","string","double","double"],
"features":[
{"type":"Feature","_id":"AAASQ3AAEAAAAMbAAA","geometry": {"type":"Point", "coordinates":[-119.99823, 38.9052]},"properties":{"CITY":"SOUTH LAKE TAHOE", "SALES":"125.8", "NAME":"FACTORY STORES AT THE Y", "_label_":"FACTORY STORES AT THE Y"},"styles":{"rendering":{"style":"M.SMALL CIRCLE"},"labeling":{"style":"T.RED STREET", "columns":["_label_"]}}},
{"type":"Feature","_id":"AAASQ3AAEAAAAMbAAB","geometry": {"type":"Point", "coordinates":[-121.95073, 37.53356]},"properties":{"CITY":"FREMONT", "SALES":"186.8", "NAME":"OHLONE VILLAGE", "_label_":"OHLONE VILLAGE"},"styles":{"rendering":{"style":"M.SMALL CIRCLE"},"labeling":{"style":"T.RED STREET", "columns":["_label_"]}}},
{"type":"Feature","_id":"AAASQ3AAEAAAAMbAAC","geometry": {"type":"Point", "coordinates":[-118.48844, 34.02353]},"properties":{"CITY":"SANTA MONICA", "SALES":"9.1", "NAME":"SANTA MONICA PLACE", "_label_":"SANTA MONICA PLACE"},"styles":{"rendering":{"style":"M.SMALL CIRCLE"},"labeling":{"style":"T.RED STREET", "columns":["_label_"]}}},
{"type":"Feature","_id":"AAASQ3AAEAAAAMbAAD","geometry": {"type":"Point", "coordinates":[-118.55093, 34.42104]},"properties":{"CITY":"SANTA CLARITA", "SALES":"52.6", "NAME":"VALENCIA TOWN CENTER", "_label_":"VALENCIA TOWN CENTER"},"styles":{"rendering":{"style":"M.SMALL CIRCLE"},"labeling":{"style":"T.RED STREET", "columns":["_label_"]}}},
{"type":"Feature","_id":"AAASQ3AAEAAAAMbAAE","geometry": {"type":"Point", "coordinates":[-122.56007, 38.08187]},"properties":{"CITY":"NOVATO", "SALES":"119.1", "NAME":"VINTAGE OAKS AT NOVATO", "_label_":"VINTAGE OAKS AT NOVATO"},"styles":{"rendering":{"style":"M.SMALL CIRCLE"},"labeling":{"style":"T.RED STREET", "columns":["_label_"]}}}]}
The response contains a minimal header plus an array of features.The header includes the spatial reference system (srs) ID and the minimum bounding box of the result data. The array of features includes attribute names and their types. Possible type names include: "byte","short","int","long","float","double","char","string","boolean", "date"
For each feature, the following fields apply:
-
type: AlwaysFeature. -
_id: Optional ID or key attribute. -
geometry: The actual geometry encoded in the modified GeoJSON format. -
properties: An object containing all the properties (name-value pairs) for the feature. -
styles: An optional styling information object. Contains two embedded objects,renderingandlabeling, which share the same structure: basically an object containing astylefield and an optionalcolumnsarray. Currently only predefined themes support including styling information in the response; a dynamic theme's response contains no styling information. -
label_box: A 4-element array specifying theminX,minY,maxX, andmaxYof the label box. Only a polygon can have a label box.
Note that the labeling text is always included as a pseudo-property with the name _label_ in the property list.
3.2.4 Map Data Server Error Handling
If the map data server cannot process a data request, it will send a JSON response containing an error object. This JSON error object may look like the following:
{"error":
  {"code": "ora-500",
   "message": "Table requested does not exist",
   "details": "maybe a stack trace here..."
  }
}
In the preceding JSON object, code is the error code known only to the map data serve, message contains a short message that can be displayed to the end user in a warning dialog, and details is an optional field that may contain more details (such as the stack trace if included).
3.3 Map Tile Server
The map tile server is a map image caching engine that fetches, caches, and serves pregenerated, fixed-size map image tiles. It is implemented as a Java servlet that is part of the MapViewer server. The map tile server accepts requests that ask for map image tiles specified by tile zoom level and tile location (mesh code), and it sends the requested tiles back to clients.
Figure 3-6 shows the basic workflow of the map tile server.
Figure 3-6 Workflow of the Map Tile Server
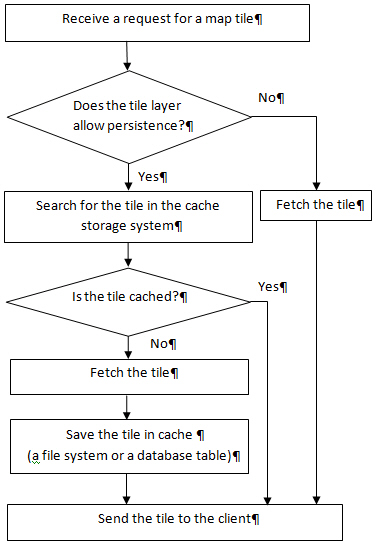
Description of ''Figure 3-6 Workflow of the Map Tile Server''
As shown in Figure 3-6, when the map tile server receives a request for a map tile, it searches for the tile in the cache storage system. If the tile is cached, the map tile server sends the tile to the client. If the tile is not cached, the map tile server fetches the tile, saves it in the cache, and sends it to the client.
You can use the MapViewer administration tool to manage the map tile server.
Related subtopics:
3.3.1 Map Tile Server Concepts
This section explains map tile server concepts that you need to know to be able to use Oracle Maps effectively.
Related subtopics:
3.3.1.1 Map Tile Layers and Map Tile Sources
All map tile layers are managed by the map tile server. The map tile server fetches and stores the map image tiles that belong to the map tile layer and returns map image tiles to the client. The map tile server can manage multiple map tile layers.
Each map tile layer can have multiple predefined zoom levels. Each zoom level is assigned a zoom level number ranging from 0 to n-1, where n is the total number of zoom levels. Zoom level 0 is the most zoomed out level and zoom level n-1 is the most zoomed in level.
The map is evenly divided into same-sized small map image tiles on each zoom level. Clients specify a map tile by its zoom level and tile mesh code.
A map tile layer can come from two different types of sources:
-
Internal MapViewer base maps rendered by the MapViewer map rendering engine. A MapViewer base map consists of a set of predefined themes and must be predefined in the database view USER_SDO_MAPS.
-
Maps rendered by an external web map services providers. An external web map services provider is a server that renders and serves maps upon client requests over the web. If you properly configure an adapter that can fetch maps from the external map services provider, the map tile server can fetch and cache map tiles generated by the external map services provider. (A MapViewer instance other than the MapViewer inside which the map tile server is running is also considered an external map services provider.)
3.3.1.2 Storage of Map Image Tiles
Oracle Maps has three options for handling the storage of map image tiles:
-
Store the tiles using the local file system.
If you use the local file system for caching, you can customize the path that is used for this storage as part of the map tile server configuration settings.
-
Store the tiles in a database table.
If you use a database table for caching, you must create the database table, and set the TILES_TABLE column to that table for the tile layer in the USER_SDO_CACHED_MAPS view.
-
Stream the tiles directly without storing them.
If you do not want to cache any image tiles, you must indicate that in the tile layer's definition.
3.3.1.2.1 Store the tiles using the local file system
In a file system, each tile layer has its own storage root directory, which is specified by the <cache_storage> element's root_path attribute in the tile layer definition. If that attribute is not specified, then the default storage location specified in the mapViewerConfig.xml file <tile_storage> element is used as the root path. For example, if the root path is defined as /scratch/tilecache/, and a data source named MVDEMO has a tile layer named DEMO_MAP with 19 zoom levels, after the server is instantiated the folder /scratch/tilecache/MVDEMO.DEMO_MAP is created, and it contains 19 subfolders (/0, /1, …, /18), each for storing the image tiles in that zoom level.
Under each zoom level, there are two options to organize its subfolders for map tiles. One is the default option, which uses a mesh code tree structure; the other, called xyz storage scheme, uses the tile's row and column values as subfolder and tile name to store the map tile. Both storage options start from the tile's mesh code value for each zoom level (see Section 3.3.1.4, "Tile Mesh Codes" for details about the tile mesh code). Each tile in a zoom level can be represented using its mesh code value pair (mx, my), where the mx and my are integer values in the horizontal and vertical directions respectively. The tile at the lower left corner has a value of (0, 0). A tile can also be located using its tile row and tile column value pair (tile_column, tile_row). A tile at the upper left corner has a value of (0, 0).
3.3.1.2.2 Store the tiles in a database table
Image tiles can be stored in a database table, as follows.
-
Create a table for storing the image tiles. For example:
CREATE TABLE tile_dbt (
  tile_layer varchar2(64),
  zoom_level number,
  x number,
  y number,
  modified TIMESTAMP,
  data BLOB);
COMMIT;
-
Update the TILES_TABLE column in USER_SDO_CACHED_MAPS view for the tile layer. For example, if you have a tile layer DEMP_MAP and you want to use the table created in step 1 to store its map tiles, then update the tile layer's TILES_TABLE column as follows:
UPDATE user_sdo_cached_maps SET tiles_table='tiles_dbt' WHERE name='DEMP_MAP';
-
Restart the MapViewer server to make the changes take effect.
Using this example, the map image tiles for tile layer DEMP_MAP will be stored in the database table TILE_DBT.
3.3.1.2.3 Stream the tiles directly without storing them
If the tile contents may change constantly (such as a real-time cloud cover satellite image map) or if you do not want to store the image tiles, you can stream the tiles directly without storing them.
To choose this option, set the persistent_tiles attribute to false in the <map_tile_layer> element in the tile layer's definition. (The default value for the persistent_tiles attribute is true.). Example 3-26 inserts a tile layer named DEMO_MAP, with the persistent_tiles attribute sets to false so that no map image tiles will be cached for this tile layer.
Example 3-26 Streaming Tiles Without Storing Them
INSERT INTO user_sdo_cached_maps values(
'DEMO_MAP',
'an example tile layer that does not cache image tiles',
'',
'YES',
'YES',
'<map_tile_layer name="DEMO_MAP_TREEMESH" image_format="PNG" http_header_expires="168.0" concurrent_fetching_threads="3" persistent_tiles="false">
   <internal_map_source data_source="mvdemo" base_map="DEMO_MAP" bgcolor="#dddddd" out_of_bounds_color="#eeddff"/>
   <tile_storage root_path="/temp" short_path="false" />
   <coordinate_system srid="8307" minX="-180.0" maxX="180.0" minY="-90.0" maxY="90.0"/>
   <tile_image width="256" height="256"/>
   <tile_dpi  value="90.7142857"/>
   <tile_meters_per_unit  value="111319.49079327358"/>
   <zoom_levels levels="19" min_scale="2132.729583849784" max_scale="559082264.0287178"/>
</map_tile_layer>',
'DEMO_MAP',
'');
COMMIT;
3.3.1.3 Coordinate System for Map Tiles
Map images are cached and managed by the map tile server as small same-size rectangular image tiles. Currently we support tiling on any two-dimensional Cartesian coordinate system. A geodetic coordinate system can also be supported when it is mapped as if it is a Cartesian coordinate system, where longitude and latitude are treated simply as two perpendicular axes, as shown in Figure 3-7.
Figure 3-7 Tiling with a Longitude/Latitude Coordinate System
Description of ''Figure 3-7 Tiling with a Longitude/Latitude Coordinate System''
On each zoom level, the map tiles are created by equally dividing the whole map coordinate system along the two dimensions (X and Y, which inFigure 3-7 represent latitude and longitude). The map tile server needs this dimensional information of the map coordinate system in order to create map image tiles, and therefore you must include this information in the map tile layer configuration settings.
The whole map coordinate system can be represented by a rectangle, and its boundary is specified by (Xmin, Ymin) and (Xmax, Ymax), where Xmin is the minimum X value allowed in the coordinate system, Ymin is the minimum Y value allowed, Xmax is the maximum X value allowed and Ymax is the maximum Y value allowed. In Figure 3-7, Xmin is –180, Ymin is –90, Xmax is 180, and Ymax is 90.
You must also specify the spatial referencing ID (SRID) of the coordinate system to enable the map tile server to calculate map scales.
3.3.1.4 Tile Mesh Codes
Each map tile is specified by a mesh code, which is defined as a pair of integers (Mx, My), where Mx specifies the X dimension index of the tile and My specifies the Y dimension index of the tile. If the tile is the ith tile on X dimension starting from Xmin, then Mx should be i-1. If the tile is the jth tile on Y dimension starting from Ymin, then My should be j-1. Figure 3-8 shows the mesh codes of the tiles on a map.
The JavaScript map client automatically calculates which tiles it needs for displaying the map in the web browser, and it sends requests with the mesh codes to the server. Mesh codes are transparent to the application, and application developers do not need to deal with mesh codes directly.
3.3.1.5 Map Tile Requests
The map tile server handles map tile requests. A map tile request can be in key/value pair format or REST format:
-
Map tile request in key/value pair format
For example, if data source DS_NAME has a tile layer TL_NAME, then to get a map tile image in PNG format from zoom level 2 and mesh code (3.2), the URL may be formatted as:
http://localhost:8080/mapviewer/mcserver?request=gettile&format=PNG&zoomlevel=2&mapcache=DS_NAME.TL_NAME&mx=3&my=2
-
Map tile request in REST format
A general format of a request in REST format is:
http://localhost:8080/mapviewer/mcserver/DS_NAME/TL_NAME/{zoom}/{row}/{column}.pngFor example, to send the same map tile request shown in the preceding key/value pair example but in a REST format, the URL may be:
http://localhost:8080/mapviewer/mcserver/DS_NAME/TL_NAME/2/1/3.png
The mesh code in the key/value pair format has an origin of the lower-left corner, but the REST format requests a tile's row and column, and thus the origin is at the upper-right corner. Because the two formats have different origins, the my value is different from the row value, but the mx value is the same as the column value.
Normally, map tile requests are encapsulated in the MapViewer JavaScript API libraries, so the API handles map tile requests. However, if you are using a third party's JavaScript API to communicate with the MapViewer server, you may need to specify the map tile request format in your application. For example, if you use the Leaflet JavaScript API to get map tiles from a MapViewer server, you may need to set the URL template for its L.tileLayer as:
http://localhost:8080/mapviewer/mcserver/DS_NAME/TL_NAME/{z}/{y}/{x}.png.
3.3.1.6 Tiling Rules
You must create tiling rules that determine how the map is divided and how tiles are created. The map tile server uses these tiling rules to divide the map into small map image tiles that are stored in the tile storage system. These rules are also used by the JavaScript map client.
Because all tiles on a given zoom level are the same size, the map tile server needs to know the following information to perform the tile division:
-
The map tile image size (width and height), specified in screen pixels. This is the physical size of the tile images.
-
The tile size specified according to the map coordinate system. For example, if the map uses a geodetic coordinate system, the tile width and height should be defined in degrees. The size can be specified either explicitly by tile width and height or implicitly by map scale. (Map scale, combined with tile image size, can be used to derive the tile width and height according to the map coordinate system.)
The preceding information constitutes the tiling rule for a given zoom level. Each zoom level must have its own tiling rule. You must define the tiling rules when you specify the configuration settings for the map tile server, as described in Section 3.3.2.
3.3.1.7 Tile Background Color and Out-of-Bounds Color
Two attributes in a tile layer metadata definition which affect a tile's color: bgcolor (background color) and out_of_bounds_color (out-of-bounds color). The bgcolor attribute value is used for filling areas within the valid data area of a tile layer (the valid data area is defined by minX, minY, maxY, maxY), while the out_of_bounds_color attribute value is used for filling areas that are outside the valid data area. Both attributes have the same default values (Color(192, 192, 192)).
If a tile-fetching process failed due to an exception on the attempt to generate a tile, then the tile filled with out-of-bounds color is used as its substitute, regardless of whether it is within the valid data area. However, such a substitute tile due to tile-fetching exception is not permanently stored on disk; rather, it is streamed to the client on a temporary basis. MapViewer will retry the tile generation on subsequent requests, if the temporary tile data in the client browser's cache is purged or if a different client initiates the request.
If bgcolor is set to none, then the tile becomes transparent; that is, the background color of the HTML page replaces the attribute values for both bgcolor and out_of_bounds_color.
3.3.2 Map Tile Server Configuration
Map tile server configuration settings are stored in local configuration files and in database views. You can customize these settings.
Related subtopics:
-
Section 3.3.2.3, "Map Tile Storage Schemes: Internal Mesh Code or XYZ"
-
Section 3.3.2.4, "Creating a Map Tile Layer Using an External Web Map Source"
3.3.2.1 Global Map Tile Server Configuration
Global map tile server settings, such as logging options and the default cache storage directory, are stored in the MapViewer configuration file mapViewerConfig.xml, which is under the directory $MAPVIEWER_HOME/web/WEB-INF/conf.
The map tile server configuration settings are defined in element <map_tile_server> inside the top-level <mapperConfig> element, as shown in the following example:
<map_tile_server>
   <tile_storage default_root_path="/scratch/tilecache/"/>
</map_tile_server>
The <tile_storage> element specifies the map tiles storage settings. The default_root_path attribute specifies the default file system directory under which the cached tile images are to be stored. If the default root directory is not set or not valid, the default root directory is $MAPVIEWER_HOME/web/tilecache. A subdirectory under this directory will be created and used for a map tile layer if the map tile layer configuration does not specify the map tiles storage directory for itself. The name of the subdirectory will be the same as the name of the map tile layer.
3.3.2.2 Map Tile Layer Configuration
The configuration settings for a map tile layer are stored in the USER_SDO_CACHED_MAPS metadata view, which is described in Section 2.9.4. You should normally not manipulate this view directly, but should instead use the MapViewer administration tool, which uses this view to configure map tile layers.
Each database user (schema) has its own USER_SDO_CACHED_MAPS view. Each entry in this view stores the configuration settings for one map tile layer. If the map tile layer is based on an internal MapViewer base map or themes, the base map or themes associated with the map tile layer must be defined in the same database schema where the map tile layer configuration settings are stored.
The map tile server obtains the map source configuration by querying the USER_SDO_CACHED_MAPS view using the database connections specified by MapViewer data sources. This happens when the map tile server is started or a new data source is added to MapViewer as the result of a MapViewer administration request.
For the DEFINITION column in the USER_SDO_CACHED_MAPS view, the map source definition has the following general format:
  <map_tile_layer
     name = "map tile layer name"
     image_format ="tile-image-format">
    <internal_map_source
      data_source="name-of-data-source"
      base_map="name-of-MapViewer-base-map"
      bgcolor="base-map-background-color"
      antialias="whether-to-turn-on-antialiasing"
      />
    </internal_map_source>
    <external_map_source
       url="external-map-service-url"
       adapter_class="name-of-adapter-class"
       proxy_host=" proxy-server-host "
       proxy_port="proxy-server-port"
       timeout="request-timeout"
       request_method="http-request-method: 'GET'|'POST'">
      <properties>
        <property name="property-name" value="property-value"/>
        …
      </properties>
    </external_map_source>
    <tile_storage
       root_path="disk-path-of-cache-root-directory"
    </tile_storage>
    <coordinate_system
       srid="coordinate-system-srid"
       minX="minimum-allowed-X-value"
       maxX="maximum-allowed-X-value"
       minY="minimum-allowed-Y-value"
       maxY="maximum-allowed-Y-value">
    </coordinate_system>
    <tile_image
       width="tile-image-width-in-screen-pixels"
       height="tile-image-height-in-screen-pixels" >
    </tile_image>
    <tile_bound>
       <coordinates> … </coordinates>
    </tile_bound>
    <zoom_levels
       levels="number-of-zoom-levels"
       min_scale="map-scale-at-highest-zoom-level"
       max_scale="map-scale-at-lowest-zoom-level"
       min_tile_width="tile-width-specified-in-map-data-units-at-
                       highest-zoom-level"
       max_tile_width="tile-width-specified-in-map-data-units-at-
                       lowest-zoom-level">
      <zoom_level
         description="zoom-level-description"
         level_name="zoom-level-name"
         scale="map-scale-of-zoom-level"
         tile_width ="tile-width-specified-in-map-data-units"
         tile_height ="tile-height-specified-in-map-data-units">
        <tile_bound>
          <coordinates> … </coordinates>
        </tile_bound>
      </zoom_level>
      …
    </zoom_levels>
  </map_tile_layer>
The DTD of the map tile layer definition XML is listed in Section A.9.
Example 3-27 shows the XML definition of an internal map tile layer that is based on a base map; Example 3-28 shows the XML definition of an internal map tile layer that is based on themes (not on a base map); and Example 3-29 shows the XML definition of an external map tile layer. Explanations of the <map_tile_layer> element and its subelements follow these examples.
Example 3-27 XML Definition of an Internal Map Tile Layer Based on a Base Map
<?xml version = '1.0'?>
<!-- XML definition of an internal map tile layer.
-->
   <map_tile_layer image_format="PNG">
      <internal_map_source base_map="demo_map"/>
      <tile_storage root_path="/scratch/mapcache/"/>
      <coordinate_system
         srid="8307"
         minX="-180" maxX="180"
         minY="-90" maxY="90"/>
      <tile_image width="250" height="250"/>
      <zoom_levels>
         <zoom_level description="continent level" scale="10000000"/>
         <zoom_level description="country level" scale="3000000"/>
         <zoom_level description="state level" scale="1000000"/>
         <zoom_level description="county level" scale="300000"/>
         <zoom_level description="city level" scale="100000"/>
         <zoom_level description="street level" scale="30000"/>
         <zoom_level description="local street level" scale="10000"/>
      </zoom_levels>
   </map_tile_layer>
Example 3-28 XML Definition of an Internal Map Tile Layer Based on Themes
<?xml version = '1.0' encoding = 'UTF-8'?>
<map_tile_layer name="TL1" image_format="PNG" http_header_expires="168.0" utfgrid="true" utfgrid_resolution="4" concurrent_fetching_threads="3">
     <internal_map_source data_source="MVDEMO" bgcolor="none" out_of_bounds_color="#ffffff" base_map="" db_tile_table=""/>
     <tile_storage root_path="/temp" xyz_storage_scheme="true"/>
     <coordinate_system srid="3857" minX="-2.0037508E7" minY="-2.0037508E7" maxX="2.0037508E7" maxY="2.0037508E7"/>
     <tile_image width="256" height="256"/>
     <tile_dpi value="90.714"/>
     <tile_meters_per_unit value="1.0"/>
     <zoom_levels levels="19" min_scale="2132.72958384" max_scale="5.59082264028E8" min_tile_width="152.874538064" max_tile_width="4.00751429065E7">
          <zoom_level level="0" name="level0" tile_width="4.00751429065E7" tile_height="4.00751429065E7"/>
          <zoom_level level="1" name="level1" tile_width="2.003757145325E7" tile_height="2.003757145325E7"/>
          <zoom_level level="2" name="level2" tile_width="1.0018785726625258E7" tile_height="1.001878572662E7"/>
          <zoom_level level="3" name="level3" tile_width="5009392.86331" tile_height="5009392.86331"/>
          <zoom_level level="4" name="level4" tile_width="2504696.431656" tile_height="2504696.431656"/>
          <zoom_level level="5" name="level5" tile_width="1252348.215828" tile_height="1252348.215828"/>
          <zoom_level level="6" name="level6" tile_width="626174.1079140786" tile_height="626174.107914"/>
          <zoom_level level="7" name="level7" tile_width="313087.0539570393" tile_height="313087.053957"/>
          <zoom_level level="8" name="level8" tile_width="156543.5269785" tile_height="156543.5269785"/>
          <zoom_level level="9" name="level9" tile_width="78271.763489" tile_height="78271.763489"/>
          <zoom_level level="10" name="level10" tile_width="39135.8817446" tile_height="39135.8817446"/>
          <zoom_level level="11" name="level11" tile_width="19567.9408723" tile_height="19567.9408723"/>
          <zoom_level level="12" name="level12" tile_width="9783.9704361" tile_height="9783.9704361"/>
          <zoom_level level="13" name="level13" tile_width="4891.9852180" tile_height="4891.9852180"/>
          <zoom_level level="14" name="level14" tile_width="2445.9926090" tile_height="2445.99260903"/>
          <zoom_level level="15" name="level15" tile_width="1222.99630451" tile_height="1222.99630451"/>
          <zoom_level level="16" name="level16" tile_width="611.49815225" tile_height="611.49815225"/>
          <zoom_level level="17" name="level17" tile_width="305.74907612" tile_height="305.74907612"/>
          <zoom_level level="18" name="level18" tile_width="152.87453806" tile_height="152.87453806"/>
   </zoom_levels>
     <auto_update finest_level_to_refresh="13" dirty_mbr_batch="100" dirty_mbr_cap="1000">
          <dirty_mbr_table name="TL1MBR"/>
          <logtable name="TL1LOG"/>
   </auto_update>
     <themes>
          <theme name="UTFGRID_THEME_DEMO_STATES" from_level="0" to_level="18"/>
          <theme name="UTFGRID_THEME_DEMO_COUNTIES" from_level="0" to_level="18"/>
          <theme name="UTFGRID_THEME_DEMO_HIGHWAYS" from_level="0" to_level="18"/>
          <theme name="UTFGRID_THEME_DEMO_CITIES" from_level="0" to_level="18"/>
   </themes>
</map_tile_layer>
Example 3-29 XML Definition of an External Map Tile Layer
<?xml version = '1.0'?>
<!-- XML definition of an external map tile layer.-->
<map_tile_layer name="TILELAYER1" image_format="PNG">
   <external_map_source
     url="http://mycorp.com:7001/mapviewer/wms/"
     request_method="GET"
     adapter_class="oracle.lbs.mapcache.adapter.WMSAdapter"
     adapter_class_path="">
      <properties>
         <property name="datasource" value="mvdemo"/>
         <property name="version" value="1.1.1"/>
         <property name="srs" value="EPSG:4326"/>
         <property name="layers" value="THEME_DEMO_COUNTIES,THEME_DEMO_HIGHWAYS"/>
         <property name="format" value="image/png"/>
         <property name="transparent" value="true"/>
      </properties>
   </external_map_source>
   <tile_storage root_path="/scratch/tmp/"/>
   <coordinate_system srid="8307" minX="-180.0" minY="-90.0" maxX="180.0" maxY="90.0"/>
   <tile_image width="256" height="256"/>
   <!—
         The following <zoom_levels> element does not have any
         <zoom_level> element inside it. But since it has its levels,
         min_scale and max_scale attributes set, map tile server will
         automatically generate the <zoom_level> elements for the 10
         zoom levels.
   -->
   <zoom_levels levels="10" min_scale="1000.0" max_scale="2.5E8">
   </zoom_levels>
</map_tile_layer>
The top-level element is <map_tile_layer>. The image_format attribute specifies the tile image format; the currently supported values for this attribute are PNG, GIF, and JPG. PNG and GIF images are generally better for vector base maps, while JPG images are generally better for raster maps, such as satellite imagery, because of a better compression ratio. Currently, only tile images in PNG format can have transparent background.
-
The
http_header_expiresattribute specifies the number of hours after which a cached tile layer can be considered stale. -
The
utfgridattribute, when set totrue, indicates that a companion UTFGrid dataset for an image file will be generated. (The default value isfalse.) -
The
utfgrid_resolutionattribute specifies how fine the grid data is compared to the image tile. For example, a value of 4 (the default) indicates that one grid cell represents 4 by 4 pixels in its companion image tile. -
The
concurrent_fetching_threadsattribute defines the maximum number of concurrent tile fetching threads that may be created for fetching image tiles for this tile layer. (The default value is 3.) -
The
fetch_larger_tileattribute , whentrue(the default), tells the tile server that if the tile is not available in the cache, the tile's adjacent tiles will also be generated. This parameter does bot affect thegetTileperformance when the requested tiles are already available in the cache. The default setting (true) is intended to improve server response time. -
The
persistent_tilesattribute, whentrue(the default), specifies that image tiles will be saved is the server's disk cache. If this attribute is set to false, then each getTile request invokes an image tile rendering process in the MapViewer server, and the newly acquired image tile is not cached for future use. Cases where you may want to specifyfalseinclude (A) a GeoRaster theme is used by a tile layer and you do not want duplicate raster images in MapViewer's disk cache, or (B) you want the tile server always to provide up-to-date image tiles.
The <internal_map_source> element is required only if the map tiles are rendered by the local MapViewer instance.
-
The
base_mapattribute is required and specifies the predefined MapViewer base map that is cached by the map tile server; its value should match an entry in the BASE_MAP column in the USER_SDO_CACHED_MAPS view. -
The
bgcolorattribute is optional and specifies the background color of the map. If the value of this attribute is set toNONE, the background will be transparent. (Currently, only tile images in PNG format can have a transparent background.) -
The
out_of_bounds_colorattribute is optional and specifies the color for areas that are outside the data boundaries. The data boundaries are specified by the attributes of the<coordinate_system>element. -
The
db_tile_tableattribute is optional, specifies the database table in which to cache the tile layer's image tiles. If the attribute is not specified, the tiles are cached in MapViewer's disk cache.
The <external_map_source> element is required only if the map tiles are rendered by an external map services provider. This element has the following attributes:
-
The
urlattribute is required and specifies the map service URL from which the map tiles can be fetched (for example,http://myhost/mapviewer/omserver). -
The
adapter_classattribute is required and specifies the full name of the map adapter class, including the package names (for example,mcsadapter.MVAdapter). -
The
proxy_hostandproxy_portattributes are needed only if the external map provider server must be accessed through a proxy server; these attributes specify the host name and port number, respectively, of the proxy server. Ifproxy_hostis specified asNONE, all map tile requests will be sent directly to the remote server without going through any proxy server. Ifproxy_hostis omitted or specifies an empty string, the global MapViewer proxy setting defined in themapViewerConfig.xml filewill be used when map tile requests are sent. -
The
timeoutattribute is optional and specifies the number of milliseconds for which the map tile server must wait for an external map tile image before giving up the attempt. The default timeout value is 15000. -
The
request_methodattribute is optional and the HTTP request method for sending map tile requests; its value can bePOST(the default) orGET.
For more information about external map tile layers and an example, see Section 3.3.2.4, "Creating a Map Tile Layer Using an External Web Map Source".
The <properties> element in the <external_map_source> element can include multiple <property> elements, each of which specifies a user-defined parameter for use by the map adapter when it fetches map tiles. The same map source adapter can use different set of parameters to fetch different map tile layers. For example, the sample MapViewer adapter mcsadapter.MVAdapter shipped with MapViewer accepts parameters defined as follows:
<properties>
   <property name="data_source" value="elocation"/>
   <property name="base_map" value="us_base_map"/>
</properties>
However, by changing the value attribute values, you can use this adapter to fetch a different base map from the same data source or a different data source.
The <tile_storage> element specifies storage settings for the map tile layer.
-
The optional
root_pathattribute specifies the file system directory to be used as the root directory of the tile storage. If this attribute is omitted or invalid, the default root directory defined in themapViewerConfig.xmlfile is used. -
The optional
xyz_storage_schemeelement controls how the directory structure of map tiles in the disk cache is organized. The default value (false) causes the MapViewer internal mesh code storage scheme to be used. The valuetruecauses the XYZ storage scheme to be used. For more information, see Section 3.3.2.3, "Map Tile Storage Schemes: Internal Mesh Code or XYZ"
The <coordinate_system> element specifies the map coordinate system, and it has several required attributes. The srid attribute specifies the spatial reference ID of the coordinate system. The minX attribute specifies the lower bound of the X dimension; the minY attribute specifies the lower bound of the Y dimension; the maxX attribute specifies the upper bound of the X dimension; and the maxY attribute specifies the upper bound of the Y dimension. For the standard longitude/latitude (WGS 84) coordinate system, the srid value is 8307; and the minX, minY, maxX, and maxY values are -180, -90, 180, and 90, respectively.
For an internal map tile layer, the map coordinate system can be different from the data coordinate system. If the two are different, the map tile server transforms the map data into the coordinate system defined in the <coordinate_system> element and renders map tile images using this coordinate system.
The <tile_image> element specifies the tile image size settings, and it has the following required attributes: width specifies the width of the tile images in screen pixels, and height specifies the height of the tile images in screen pixels.
The optional <tile_bound> element specifies the bounding box of the cached map tiles. The map tile server only fetches tiles inside this box, and returns a blank tile if the requested tile is outside this box. The bounding box is specified by a rectangle in the map data coordinate system. The rectangle is specified by a <coordinates> element in the following format:
<coordinates>minX, minY, maxX, maxY</coordinates>
The default cache bounding box is the same bounding box specified in the <coordinate_system> element.
The optional <tile_dpi> element specifies the map display screen resolution as a "dots per inch" value. If this element is not specified, the value specified in the mapViewerConfig.xml file will be assigned to the tile layer. If MapViewer must comply with OGC standards in exposing the tile layer in its WMTS service, then you must specify this element with the following value: 90.714
The optional <tile_meters_per_unit> element specifies the meters per unit. The unit is defined indirectly by the srid attribute in the <coordinate_system> element. For example, if the srid is 3857, its unit is meters, and thus the value for this attribute must be 1.0; or if the srid is 8307, its unit is decimal degrees, and thus the value may be set to 111319.49. If this element is not specified, a MapViewer internal process calculates the value according to the data bounds, and the result is very close to 111319.49. If this tile layer is to be exposed by MapViewer to provide WMTS services, and if srid is 8307, then you must set this element's value to 111319.49 to comply with OGC standards.
The <zoom_levels> element specifies the predefined zoom levels. Only image tiles at predefined zoom levels will be cached and served by the map tile server. The <zoom_levels> element can have multiple <zoom_level> elements, each of which specifies one predefined zoom level. If there are no <zoom_level> elements, the map tile server automatically generates the <zoom_level> elements by using the following attributes inside the <zoom_levels> element. (These attributes can be omitted and will be ignored if any <zoom_level> elements exist.)
-
levelsspecifies the total number of zoom levels. -
min_scalespecifies the scale of map images at the highest (zoomed in the most) zoom level. -
max_scalespecifies the scale of map images at the lowest (zoomed out the most) zoom level. -
min_tile_widthspecifies the width of map tiles at the highest zoom level. The width is specified in map data units. -
max_tile_widthspecifies the width of the map tiles at the lowest zoom level. The width is specified in map data units.
For the map tile server to be able to generate the definitions of individual zoom levels automatically, you must specify either of the following combinations of the preceding attributes:
-
levels,min_scale, andmax_scale -
levels,min_tile_width, andmax_tile_width
When the zoom levels are defined this way, the map tile server automatically derives the definition of all the individual zoom levels and updates the XML definition with the <zoom_level> elements generated for the zoom levels. You can then make adjustments to each zoom level if you want.
Each zoom level is assigned a zoom level number by the map tile server based on the order in which the zoom levels are defined. The first zoom level defined in the <zoom_levels> element is zoom level 0, the second zoom level is zoom level 1, and so on. These zoom level numbers are used in the tile requests to refer to the predefined zoom levels.
The <zoom_level> element specifies a predefined zoom level, and it has several attributes. The description attribute is optional and specifies the text description of the zoom level. The level_name attribute is optional and specifies the name of the zoom level. The scale attribute specifies the map scale of the zoom level; it is required if the attributes tile_width and tile_height are not defined. The tile_width and tile_height attributes specify the tile width and height, respectively, in map data units. The fetch_larger_tiles attribute is optional and specifies whether to fetch larger map images instead of the small map image tiles; a value of TRUE (the default) means that larger map images that may consist multiple map tiles will be fetched and broken into small map image tiles, which might save network round trips between the map tile server and the map services provider.
In the <zoom_level> element, you must specify either the scale attribute or both the tile_width and tile_height elements.
The <tile_bound> element within the <zoom_level> element optionally specifies the bounding box of the cached map tiles for the zoom level. The map tile server only fetches tiles inside this box, and returns a blank tile if the requested tile is outside this box. The bounding box is specified by a rectangle specified in map data coordinate system. The rectangle is specified by a <coordinates> element (explained earlier in this topic) If you specify the <tile_bound> element within the <zoom_level> element, it overrides the overall cache bounding box settings specified by the <tile_bound> element that is above it in the XML hierarchy.
The <auto_update> element defines how the tile layer's disk cache is to be automatically updated when spatial data in the base table is modified, For details, see Section 3.3.3.2, "Add the <auto_update> element to tile layer definition".
The <themes> element defines a layer based on themes (as opposed to a layer based on a base map).The themes to be used to render image tiles are listed in its subelements. In each subelement <theme>, the name attribute is required to specify a predefined theme in the metadata. The other two optional attributes, from_level and to_level, define the visibility of the that theme. The default values for those two attributes are from_level of 0 (which contains the least map detail) and to_level of the last level (which contains the most map detail).
3.3.2.3 Map Tile Storage Schemes: Internal Mesh Code or XYZ
The xyz_storage_scheme attribute of the <file_storage> element (described in Section 3.3.2.2) controls how the directory structure of map tiles in the disk cache is organized. The default scheme uses MapViewer's internal mesh codes, but you can instead choose the XYZ storage scheme.
Figure Figure 3-9 shows both storage schemes.
Figure 3-9 Internal Mesh Code and XYZ Map Tile Storage Schemes
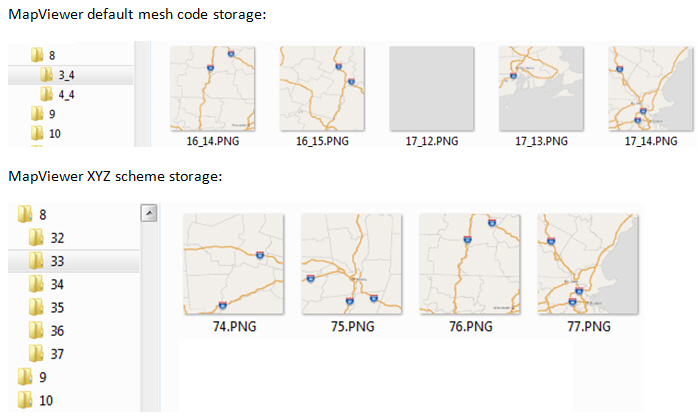
Description of ''Figure 3-9 Internal Mesh Code and XYZ Map Tile Storage Schemes''
The details of the MapViewer internal mesh code are nor important for users. You need only know that there are two different storage scheme options, and that the XYZ storage scheme is analogous to the scheme used by several map data providers. Therefore, if you want to export tiles from some zoom levels for an offline project (local tile layer), if you find the XYZ storage scheme more intuitive, you can specify it.
In the MapViewer XYZ storage scheme, the naming of subdirectories is in the form /z/y/x, where z is the zoom level, y is the tile's row number, and x in the tile's column number. For example, in Figure 3-9, the MapViewer XYX storage scheme shows the images (74.png, 75.png, 76,png, 77.png) in the tile columns for tile row 33 for zoom level 8.
3.3.2.4 Creating a Map Tile Layer Using an External Web Map Source
You can use an external web map source to create a map tile layer, as follows:
-
Log in to the MapViewer administrative console.
-
Click Create Tile Layer.
-
Select External as this tile layer's map image source, and click Continue.
-
On the Create a map tile layer for external map source page, enter the appropriate information:
Name: Tile layer name. Example:
TILELAYER1Data Source: Name of the data source for the tile layer. Example MVDEMO
Max browser tile cache age (hours): Maximum number of hours in the cache before a tile is refreshed. Example: 168
Map Service URL: Example:
http://mycorp.com:7001/mapviewer/wmsRequest Method:
HTTP GETAdapter class:
oracle.lbs.mapcache.adapter.WMSAdapterJar file location: Example:
adapterlibs/Background:
transparentAdapter properties: (Check it and click Add multiple times as appropriate, entering the values for the following each time.)
-
datasource: Example:
mvdemo -
version:
1.1.1 -
srs:
EPSG:4326 -
layers: Example:
THEME_DEMO_COUNTIES,THEME_DEMO_HIGHWAYS -
format:
image/png -
transparent:
true
Tile storage: Example:
C:\tempSRID:
8307Min X: -
180.0Max X:
180.0Min Y:
-90.0Max Y:
90.0Tile width (pixels):
256Tile height (pixels):
256File format:
PNG# Zoom Levels:
10Minimum map scale:
1000Maximum map scale:
250000000 -
-
Click Submit to create the tile layer.
The message Information: New map tile layer created successfully is displayed.
To verify the created layer, you can click Manage Tile Layers on the left, select the tile layer, and click View map / Manage tiles to preview the map.
3.3.3 Map Cache Auto-Update
The map cache auto-update feature periodically updates cached map tiles when they become "dirty". A cached map tile becomes dirty when data in base tables is changed by an update, insert, or delete operation, because such changes may affect the shape, annotation, or choice of rendering style for the already cached map tiles.Updating a dirty tile invokes one of the following operations: a) Refresh: delete the cached dirty tiles and then re-fetch them; or b) Clear: only delete the cached dirty tiles. To enable automatic updating for a tile layer, you perform the following major steps:
-
Add the <dirty_tile_auto_update> element to the mapViewerConfig.xml configuration file.
-
Create the dirty MBR table, base tables' log table, and triggers.
To test the automatic tile updating, follow the instructions in Section 3.3.3.4, "Start the MapViewer server and test the map cache auto-update feature".
3.3.3.1 Add the <dirty_tile_auto_update> element to the mapViewerConfig.xml configuration file
Add the <dirty_tile_auto_update> element as a child element of the <map_tile_server> element. For example:
<map_tile_server>
   <tile_storage default_root_path="/scratch/tilecache/"/>
   <dirty_tile_auto_update
     auto_update="true"
     auto_update_interval="1"
     recycle_interval="168"/>
</map_tile_server>
The auto_update attribute enables server's automatic update when set to true (the default is false). If this attribute is set to true, all qualified tile layers on the server will be automatically updated. To qualify, a tile layer must have a proper definition (see Section 3.3.3.2).
The auto_update_interval attribute sets the recurring interval for checking the base tables' log table and the dirty MBR table. Its value is in minutes, and the default value is 1. The value should not be more than a few minutes, and it should not be very large (even if you update the base tables far less frequently, such as daily or weekly). The base tables' log table and the dirty MBR table should be created before starting the MapViewer server. Sample scripts for creating these two tables and related sequences and triggers are included in Section 3.3.3.3.
The recycle_interval attribute specifies how long to keep a processed row in the log table and dirty MBR table. Its value is in hours, and the default value is 168. Processed rows older than that will be deleted.
When MapViewer starts, it loads the <dirty_tile_auto_update> element from mapViewerConfig.xml configuration file, and the element is applied to all tile layers of this server. If that element is not found, then the server disables any tile layer's auto-update capability.
3.3.3.2 Add the <auto_update> element to tile layer definition
Add an <auto_update> element after the <zoom_levels> element in a tile layer definition. You can add this element manually or using the MapViewer web console. For example:
 <auto_update
      finest_level_to_refresh="15"
      dirty_mbr_batch="100"
      dirty_mbr_cap="1000">
      <dirty_mbr_table name="mbr_mcau"/>
      <logtable name="log_mcau_tl"/>
   </auto_update>
The finest_level_to_refresh attribute specifies the finest level to refresh. Levels starting from level 0, level 1, level 2, …, until this specified level will be refreshed, and dirty tiles in the remaining zoom levels will be cleared. If the data modifications in the base tables are often geographically small features (as most data modifications should be), such as changing the name of a restaurant or inserting a newly developed street, the value can be the finest zoom level found in the tile layer definition. For example, if there are 19 zoom levels from 0 to 18, then this attribute can be set to 18.
The dirty_mbr_batch attribute specifies the maximum number of rows from the dirty MBR table for an update. The default value is 100. This value prevents the server from getting a very large number of tiles to update at one time. Instead, if a large number of dirty tiles need a refresh or clear operation, these tiles will be processed in many updates, and one interval processes just one batch. To determine an optimal value for this attribute, consider the following factors:
-
The
auto_update_intervalvalue (see Section 3.3.3.1)and how many tiles the server is able finish in the interval -
The amount of memory that the server can use
-
The number of tile layers that are enabled for map cache auto update and the frequency and magnitude of the changes in their base tables
Because there is no formula for a precise calculation of an optimal dirty_mbr_batch value, the best practice is to set up an environment to test different settings. When selecting a value, consider the worst case scenario. Two extreme scenarios to avoid are: a) the value is so small that the server is idling after finishing a refresh operation while the number of dirty MBR rows in the dirty MBR table keeps growing; or b) the value is so large that the server runs out of memory, throws an out-of-memory exception, and shuts down all services.
The dirty_mbr_cap attribute specifies the maximum number of dirty tiles for a log table to generate in one interval. This constraint may affect the finest zoom level for refresh operation, and the remaining zoom levels are then set for a clear operation. The accumulation counter for dirty tiles starts from zoom level 0, to level 1, level 2, and so on, until the cap is reached or the finest level to refresh is reached.
When a cap is reached at level n before reaching the specified finest level to refresh, the already counted tiles in level 0, level 1, level 2, …, and level n-1 are for a refresh operation (delete and then re-fetch), and the current zoom level (level n in this example) and all other finer levels are for a clear operation (delete from the map tile cache and no re-fetch). For example, if the cap is given a value of 1000, the dirty tile counter reaches the cap at zoom level 4, then all the counted dirty tiles from level 0 to level 3 are for refresh. After that, each dirty tile in level 3 will be used to define a rectangle (the rectangular area the tile covers on the ground), and this rectangle is taken as an MBR to clear all zoom levels starting from level 4, level 5, and all other finer levels in this tile layer.
The <dirty_mbr_table> element specifies the name of the dirty MBR table, where the dirty MBRs are to be stored, retrieved, and updated. You need to manually create this table before starting the MapViewer server (see the example in Section 3.3.3.3).
The <logtable> element specifies the name of the base table's log table. If a tile layer depends on more than one base table (as is often the case), then every change in each base table should be inserted into this log table by its trigger; if the schema is accessed by more than one data source defined in mapViewerConfig.xml, then one change in a base table should insert one row for each data source.
It is recommended that each tile layer have its own log table and its own dirty MBR table. Both tables should be manually created before starting the server (see the example in Section 3.3.3.3).
3.3.3.3 Create the dirty MBR table, base tables' log table, and triggers
This section contains examples that, when taken together, show the actions to create the dirty MBR table, base tables' log table, and triggers. The example segments assume that a base map named DEMO_MAP is already defined and that there is one data source named MVDEMO accessing the schema.
The example code segments include explanatory comments, and they perform the following actions:
-
Create a tile layer that includes an
<auto_update>element.insert into user_sdo_cached_maps values( 'MCAU_TL', 'a test case for map cache auto update', '', 'YES', 'YES', '<map_tile_layer name="MCAU_TL" image_format="PNG" http_header_expires="168.0" concurrent_fetching_threads="3" fetch_larger_tiles="false"> <internal_map_source data_source="mvdemo" base_map="DEMO_MAP"/> <coordinate_system srid="8307" minX="-180.0" maxX="180.0" minY="-90.0" maxY="90.0"/> <tile_image width="256" height="256"/> <tile_dpi value="90.7142857"/> <tile_meters_per_unit value="111319.49079327358"/> <zoom_levels levels="19" min_scale="2132.729583849784" max_scale="559082264.0287178"> </zoom_levels> <auto_update finest_level_to_refresh="15" dirty_mbr_batch="100" dirty_mbr_cap="1000"> <dirty_mbr_table name="mbr_MCAU_TL"/> <logtable name="log_MCAU_TL"/> </auto_update> </map_tile_layer>', 'DEMO_MAP', ''); commit;
-
Create a dirty MBR table and its trigger.
The dirty MBR table stores the dirty MBRs for refresh and clear operations. This table is populated using the geometries from the log table. There is also a sequence and a trigger created for generating unique IDs for this table's ID column.
-- create the dirty MBR table
CREATE TABLE mbr_MCAU_TL (     -- dirty MBR table name
  id             number,       -- id, used for tracking the status
  datasource     varchar2(32), -- data source name
  tile_layer     varchar2(32), -- tile layer name
  logtable       varchar2(32), -- basetable's log-table
  refresh_status varchar2(1),  -- n: not refreshed, y: refreshed, p:pending, f: failed
  clear_status   varchar2(1),  -- n: not cleared,   y: cleared,   p:pending, f: failed
  mbr_to_clear   varchar2(1),  -- y/n: use tile's mbr for clearing finer levels
  zoom_level     number,       -- zoom level of this tile
  mx             number,       -- mesh x ordinate
  my             number,       -- mesh Y ordinate
  minx           number,       -- tile's minimum x coordinate
  miny           number,       -- tile's minimum y coordinate
  maxx           number,       -- tile's maximum x coordinate
  maxy           number,       -- tile's maximum y coordinate
  insert_time    Date,         -- when the tile MBR was inserted into this table
  update_time    Date          -- most recent update (refresh/clear) time
  );

-- create a sequence for mbr_MCAU_TL
CREATE SEQUENCE mbr_MCAU_TL_seq
  START WITH 1
  INCREMENT BY 1
  CYCLE
  MAXVALUE 9999999999;

-- create a trigger to get a unique id
create or replace trigger mbr_MCAU_TL_br
 before insert on mbr_MCAU_TL   -- before inserting the row
 referencing new as new old as old
 for each row  -- for each row
begin
  select mbr_MCAU_TL_seq.nextval INTO :new.id FROM dual;
end;
/
-
Create a log table.
The base tables' log table is for recording the rows changed in the base tables of the tile layer. Because each tile layer depends on the data in its base tables when generating a map tile, any change made to the base table (such as modifications of geometries or changes to attributes values) may affect their representation in their corresponding map tile. The change log table records such changes through a trigger created on its base table.
The following statements create a log table, a sequence, and a trigger on the table using the sequence to generate unique ID values.
-- create the log table
create table log_MCAU_TL(
  id number,
  geomO sdo_geometry,  -- the affected geometry or its attributes, original geometry
  geomN sdo_geometry,  -- the affected geometry or its attributes, new geometry
  modified Date,       -- when the modified occurred
  status varchar2(1),  -- y: processed, n: not processed
  datasource varchar2(32), -- data source name, more than one ds may access the same log
  tile_layer varchar2(32), -- tile layer name
  basetable  varchar2(32) -- base table name, more than one base table may insert into this log
);

-- create a sequence for log_MCAU_TL
CREATE SEQUENCE log_MCAU_TL_seq
  START WITH 1
  INCREMENT BY 1
  CYCLE
  MAXVALUE 9999999999;

-- create a trigger for log_MCAU_TL to create a unique id
create or replace trigger log_MCAU_TL_br
 before insert on log_MCAU_TL   -- before inserting
 referencing new as new old as old
 for each row                          -- for each row
begin
  select log_MCAU_TL_seq.nextval INTO :new.id FROM dual;
end;
/
-
Create a trigger on each base table to insert changes into the log table.
In a base table's trigger, any geometries inserted into the log table are transformed into the same spatial reference system (coordinate system) as the tile layer. If there are multiple data sources defined in the
mapViewerConfig.xmlconfiguration file accessing the same schema, then one INSERT statement should be used for each of these data sources in each trigger definition.The following statements make these assumptions:
-
One data source named MVDEMO is accessing the schema that contains the MCAU_TL tile layer. (Thus, there is only one INSERT statement in each trigger definition.)
-
The tile layer's spatial reference system (SRID) is 8307 (WGS 84 longitude/latitude).
-
There are four base tables to monitor for this tile layer: states, counties, interstates, and cities.
--states trigger
create or replace trigger states_MCAU_TL_ar
 after insert or update or delete on states   -- any change
 referencing new as new old as old
 for each row
 when (old.geom IS NOT NULL OR new.geom IS NOT NULL)
declare
  oldGeom SDO_GEOMETRY;
  newGeom SDO_GEOMETRY;
  tileSRID  number;
begin
   tileSRID := 8307;
   oldGeom  := :old.geom;
   if (:old.geom IS NOT NULL) then
     if (:old.geom.SDO_SRID != tileSRID) then
       select sdo_cs.transform(:old.geom, tileSRID)  into oldGeom from dual;
     end if;
   end if;
   newGeom:=:new.geom;
   if (:new.geom IS NOT NULL) then
     if (:new.geom.SDO_SRID!= tileSRID) then
       select sdo_cs.transform(:new.geom, tileSRID)  into newGeom from dual;
     end if;
   end if;

   insert into log_MCAU_TL (id, geomO, geomN, modified, status, datasource, tile_layer, basetable)
        values(null, oldGeom, newGeom, sysdate, 'n', 'MVDEMO', 'MCAU_TL', 'states');
end;
/

--counties trigger
create or replace trigger counties_MCAU_TL_ar
 after insert or update or delete on counties
 referencing new as new old as old
 for each row
 when (old.geom IS NOT NULL OR new.geom IS NOT NULL)
declare
  oldGeom SDO_GEOMETRY;
  newGeom SDO_GEOMETRY;
  tileSRID  number;
begin
   tileSRID := 8307;
   oldGeom  := :old.geom;
   if (:old.geom IS NOT NULL) then
     if (:old.geom.SDO_SRID!=tileSRID) then
       select sdo_cs.transform(:old.geom, tileSRID)  into oldGeom from dual;
     end if;
   end if;
   newGeom:=:new.geom;
   if (:new.geom IS NOT NULL) then
     if (:new.geom.SDO_SRID!= tileSRID) then
       select sdo_cs.transform(:new.geom, tileSRID)  into newGeom from dual;
     end if;
   end if;
   insert into log_MCAU_TL (id, geomO, geomN, modified, status, datasource, tile_layer, basetable)
        values(null, oldGeom, newGeom, sysdate, 'n', 'MVDEMO', 'MCAU_TL', 'counties');
end;
/

--interstates trigger
create or replace trigger interstates_MCAU_TL_ar
 after insert or update or delete on interstates
 referencing new as new old as old
 for each row
 when (old.geom IS NOT NULL OR new.geom IS NOT NULL)
declare
  oldGeom SDO_GEOMETRY;
  newGeom SDO_GEOMETRY;
  tileSRID  number;
begin
   tileSRID := 8307;
   oldGeom  := :old.geom;
   if (:old.geom IS NOT NULL) then
     if (:old.geom.SDO_SRID!=tileSRID) then
       select sdo_cs.transform(:old.geom, tileSRID)  into oldGeom from dual;
     end if;
   end if;
   newGeom:=:new.geom;
   if (:new.geom IS NOT NULL) then
     if (:new.geom.SDO_SRID!= tileSRID) then
       select sdo_cs.transform(:new.geom, tileSRID)  into newGeom from dual;
     end if;
   end if;

   insert into log_MCAU_TL (id, geomO, geomN, modified, status, datasource, tile_layer, basetable)
        values(null, oldGeom, newGeom, sysdate, 'n', 'MVDEMO', 'MCAU_TL', 'interstates');

end;
/

--cities trigger
create or replace trigger cities_MCAU_TL_ar
 after insert or update or delete on cities
 referencing new as new old as old
 for each row
 when (old.location IS NOT NULL OR new.location IS NOT NULL)
declare
  oldGeom SDO_GEOMETRY;
  newGeom SDO_GEOMETRY;
  tileSRID  number;
begin
   tileSRID := 8307;
   oldGeom  := :old.location;
   if (:old.location IS NOT NULL) then
     if (:old.location.SDO_SRID!=tileSRID) then
       select sdo_cs.transform(:old.location, tileSRID)  into oldGeom from dual;
     end if;
   end if;
   newGeom:=:new.location;
   if (:new.location IS NOT NULL) then
     if (:new.location.SDO_SRID!= tileSRID) then
       select sdo_cs.transform(:new.location, tileSRID)  into newGeom from dual;
     end if;
   end if;

  insert into log_MCAU_TL (id, geomO, geomN, modified, status, datasource, tile_layer, basetable)
      values(null, oldGeom, newGeom, sysdate, 'n', 'MVDEMO', 'MCAU_TL', 'cities');
end;
/
commit;
-
3.3.3.4 Start the MapViewer server and test the map cache auto-update feature
To test the automatic tile updating, start the MapViewer server and then change one or more rows in the base table.
-
Modify a row in the base table. For example:
update cities set city='Worcester' where city='Worcester' and state_abrv='MA';
-
Check the log table. For example:
select * from log_mcau_tl;
The result should include a row that was just inserted by the base table's trigger.
-
Wait for about one interval (one minute in this example), then check the dirty MBR table. For example:
select count(*) from mbr_mcau_tl;
The result should include some dirty MBR rows inserted by the server.
You can also look for changes in the refresh_status column in the dirty MBR table. When rows are initially inserted, the status is set to n for not processed; then it changes to p for pending when they are being processed; and after the update is done, it changes to y for processed. Meanwhile, on the server you can see that the server has been updating the tiles (the server's logger needs to be set to finest level to see the finest logging information).
3.3.4 UTFGrid for Map Tiles: Including Text Information About Features
When a tile layer has UTFGrid enabled, a data set named UTFGrid becomes a "companion" of an image tile, containing text information about features in the image tile. This text information can be displayed by the browser when responding to a mouse event, such as mouse click on a map feature.
A UTFGrid data set is stored in JSON format, and has two components: (a) a grid data set that mirrors its companion image tile, and (b) attributes of all grid cells. The value at each grid cell serves as the key to link the image tile cell and its attributes. Each image pixel on a map is associated with a UTFGrid grid cell, and the cell's value indicates where its attributes (as text strings) can be retrieved. For storage efficiency, the value of each grid cell is encoded in a revised UTF-8 encoding scheme.
Topics:
3.3.4.1 Enabling the UTFGrid Option for a Tile Layer
To enable the UTFGrid option for a map tile layer, then in the USER_ADO_CACHED_MAPS row for the tile layer, specify utfgrid="true" in the <map_tile_layer> element, and optionally specify the UTFGrid resolution with the utfgrid_resolution attribute (the default is 4). For example:
insert into user_sdo_cached_maps values(
'UTFGRID_TL',
'utfgrid enalbled test case ',
'',
'YES',
'YES',
'<map_tile_layer name="UTFGRID_TL" image_format="PNG" http_header_expires="168.0" concurrent_fetching_threads="3" fetch_larger_tiles="false"
    persistent_tiles="true" utfgrid="true" utfgrid_resolution="4">
   <internal_map_source data_source="mvdemo" base_map="UTFGRID_BASEMAP" bgcolor="#dddddd" out_of_bounds_color="#eeddff"/>
   <tile_storage root_path="/temp" xyz_storage_scheme="true"/>
   <coordinate_system srid="8307" minX="-180.0" maxX="180.0" minY="-90.0" maxY="90.0"/>
   <tile_image width="256" height="256"/>
   <tile_dpi  value="90.7142857"/>
   <tile_meters_per_unit  value="111319.49079327358"/>
   <zoom_levels levels="19" min_scale="2132.729583849784" max_scale="559082264.0287178">
   </zoom_levels>
</map_tile_layer>',
'UTFGRID_BASEMAP',
'');
commit;
The utfgrid_resolution attribute determines how fine the grid cells are in an UTFGrid data set, and the default value of 4 indicates that one grid cell represents 4 by 4 image pixels in its companion image tile. For example, if 256x256 is an image's dimension, then the grid's dimension will be 64x64, and a grid cell at row=10, column=20 represents the pixels in the tile image from row 40 to row 43 and from column 80 to column 83 (note that one grid cell represents 16 image tile pixels). When multiple features in the map image tile fall into one grid cell at the indicated resolution, then the feature with the majority or plurality of the pixels is assigned to the grid cell. The value stored in the grid cell is encoded using UTF-8 encoding.
If a tile layer has UTFGrid enabled, when the map server generates a map image tile, it will also generate an UTFGrid data set stored in JSON format. When a client requests a map image tile, both the image tile and its UTFGrid JSON file will be returned in the response.
In MapViewer server, the UTFGrid JSON files are stored in the same location with their image tiles. For example, if an image tile is cached at /mapcache/MVDEMO.UTFGRID_TL/0/1/2.PNG, you should also see its companion UTFGrid file /mapcache/MVDEMO.UTFGRID_TL/0/1/2.JSON.
This UTFGrid option is currently not supported if the image tiles are stored in a database table (see Store the tiles in a database table) when disk cache is disabled for a tile layer (see Stream the tiles directly without storing them).
3.3.4.2 Encoding a Key and Decoding a Grid Cell's Value
A tile layer can contain multiple data layers or themes. Each theme will have its own grid data set, and an UTFGrid JSON object may contain multiple grid data sets. In each theme's grid, features shown in its image tile are also "drawn" using styles to render each feature. As for its associated image tile, a feature is drawn using its key, and the key is an ordinal number assigned to each feature. This number is used to assign a UTF-8 encoded value for the cell's value.
When a mouse event is triggered on a feature in an image tile, the image pixel's corresponding grid cell can be located, and the cell's value (an UTF-8 encoded value) can then be retrieved. This UTF-8 encoded value can then be decoded to derive its key, an ordinal number. Using this key, the attribute stored can be obtained. (See the examples near the end of Building a UTFGrid Test Case.)
3.3.4.3 Building a UTFGrid Test Case
This test case focuses on the server side. It has two major steps: creating a UTFGrid-enabled tile layer, and sending some hard-coded requests to the server. (In a real application, you need to have a client side map application to make use of the tile layer.)
-
Create a UTFGrid-enabled tile layer.
If all the spatial base tables and styles exist in the metadata, the following example creates four themes, a basemap, and an UTFGrid-enabled tile layer. Because the feature attributes stored in an UTFGrid JSON object come from the
<hidden_info>element of a theme, the<hidden_info>element is defined in three of the four themes. (If none of the four themes has the<hidden_info>element defined, then enabling this tile layer's UTFGrid option would not make sense, because the UTFGrid object would be empty and creating it would still consume server resources.)-- insert theme 1 insert into USER_SDO_THEMES (name, description, base_table, geometry_column, styling_rules) values ( 'UTFGRID_THEME_DEMO_STATES', 'for utfgrid testing', 'STATES', 'GEOM', '<?xml version="1.0" standalone="yes"?> <styling_rules> <hidden_info> <field column="STATE" name="State"/> <field column="STATE_ABRV" name="Abrv."/> <field column="TOTPOP" name="Population"/> </hidden_info> <rule> <features style="C.S02_COUNTRY_AREA"> </features> <label column="STATE_ABRV" style="T.S02_STATE_ABBREVS"> 1 </label> </rule> </styling_rules>'); -- insert theme 2 insert into USER_SDO_THEMES (name, description, base_table, geometry_column, styling_rules) values ( 'UTFGRID_THEME_DEMO_COUNTIES', 'for utfgrid testing', 'COUNTIES', 'GEOM', '<?xml version="1.0" standalone="yes"?> <styling_rules> <!--<hidden_info> <field column="COUNTY" name="County"/> <field column="FIPSSTCO" name="Fips"/> <field column="TOTPOP" name="Population"/> <field column="STATE_ABRV" name="State"/> </hidden_info>--> <rule> <features style="L.S06_BORDER_STATE"> </features> </rule> </styling_rules>'); -- insert theme 3 insert into USER_SDO_THEMES (name, description, base_table, geometry_column, styling_rules) values ( 'UTFGRID_THEME_DEMO_HIGHWAYS', 'for utfgrid testing', 'INTERSTATES', 'GEOM', '<?xml version="1.0" standalone="yes"?> <styling_rules> <hidden_info> <field column="HIGHWAY" name="Highway"/> <field column="ROUTEN" name="No."/> </hidden_info> <rule> <features style="L.S04_ROAD_INTERSTATE"> </features> <label column="routen" style="M.HWY_USA_INTERSTATE_NARROW"> (3-length(routen)) </label> </rule> </styling_rules>'); -- insert theme 4 insert into USER_SDO_THEMES (name, description, base_table, geometry_column, styling_rules) values ( 'UTFGRID_THEME_DEMO_CITIES', 'for utfgrid testing', 'CITIES', 'LOCATION', '<?xml version="1.0" standalone="yes"?> <styling_rules> <hidden_info> <field column="CITY" name="City"/> <field column="POP90" name="Population"/> </hidden_info> <rule> <features style="M.ALL_CITY_L2"> (pop90 between 200000 AND 1000000 ) </features> <label column="city" style="T.S07_CITIES_L2"> 1 </label> </rule> <rule> <features style="M.ALL_CITY_L3"> (pop90 between 0 and 200000) </features> <label column="city" style="T.S07_CITIES_L3"> 1 </label> </rule> </styling_rules>'); -- insert a basemap INSERT INTO USER_SDO_MAPS (name, description, definition) values ( 'UTFGRID_BASEMAP', 'for utfgrid testing', '<?xml version="1.0" standalone="yes"?> <map_definition> <theme name="UTFGRID_THEME_DEMO_STATES" min_scale="1.5E8" max_scale="0.0" scale_mode="RATIO"/> <theme name="UTFGRID_THEME_DEMO_COUNTIES" min_scale="8500000.0" max_scale="0.0" scale_mode="RATIO"/> <theme name="UTFGRID_THEME_DEMO_HIGHWAYS" min_scale="4.5E7" max_scale="0.0" scale_mode="RATIO"/> <theme name="UTFGRID_THEME_DEMO_CITIES" min_scale="7500000.0" max_scale="0.0" scale_mode="RATIO"/> </map_definition>' ); -- insert the UTFGrid enabled tile layer insert into user_sdo_cached_maps values( 'UTFGRID_TL', 'a utfgrid ', '', 'YES', 'YES', '<map_tile_layer name="UTFGRID_TL" image_format="PNG" http_header_expires="168.0" concurrent_fetching_threads="3" fetch_larger_tiles="false" persistent_tiles="true" utfgrid="true" utfgrid_resolution="8"> <internal_map_source data_source="mvdemo" base_map="UTFGRID_BASEMAP" bgcolor="#dddddd" out_of_bounds_color="#eeddff"/> <tile_storage root_path="/temp" xyz_storage_scheme="true"/> <coordinate_system srid="8307" minX="-180.0" maxX="180.0" minY="-90.0" maxY="90.0"/> <tile_image width="256" height="256"/> <tile_dpi value="90.7142857"/> <tile_meters_per_unit value="111319.49079327358"/> <zoom_levels levels="19" min_scale="2132.729583849784" max_scale="559082264.0287178"> </zoom_levels> </map_tile_layer>', 'UTFGRID_BASEMAP', ''); commit; -
Request the map image and its UTFGrid object.
In an actual application, requesting a map image tile and its companion UTFGrid JSON file is handled by the MapViewer HTML5 V2 API; however, for illustration purposes, two substeps with hard-coded requests are shown here.
-
Request an image tile from the server. For example:
http://localhost:8080/mapviewer/mcserver?request=gettile&format=png&zoomlevel=8&mapcache=MVDEMO.UTFGRID_TL&mx=77&my=94The server's response:
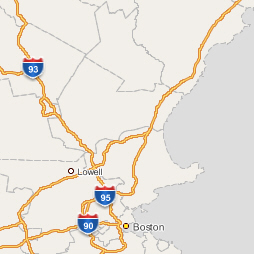
Description of the illustration ''utfgrid_example_image_tile.jpg''
-
Request the image tile's companion UTFGrid from the server. For example:
http://localhost:8080/mapviewer/mcserver?request=getutfgrid&format=json&zoomlevel=8&mapcache=MVDEMO.UTFGRID_TL&mx=77&my=94The server's response:
{"UTFGRID_THEME_DEMO_STATES":
{"keys":["1","2","3"],
"data":{
"1":{"State":"New Hampshire","Abrv.":"NH","Population":"1109252"},
"2":{"State":"Maine","Abrv.":"ME","Population":"1227928"},
"3":{"State":"Massachusetts","Abrv.":"MA","Population":"6016424"}},
"grid":[
"!!!!!!!!!!!!!!!!!###############",
"!!!!!!!!!!!!!!!!!###############",
"!!!!!!!!!!!!!!!!!############## ",
"!!!!!!!!!!!!!!!!!###############",
"!!!!!!!!!!!!!!!!!############## ",
"!!!!!!!!!!!!!!!!!#############  ",
"!!!!!!!!!!!!!!!!!!#########     ",
"!!!!!!!!!!!!!!!!!!!########     ",
"!!!!!!!!!!!!!!!!!!!!#######     ",
"!!!!!!!!!!!!!!!!!!!!######      ",
"!!!!!!!!!!!!!!!!!!!!######      ",
"!!!!!!!!!!!!!!!!!!!!!!###       ",
"!!!!!!!!!!!!!!!!!!!!!!!#        ",
"!!!!!!!!!!!!!!!!!!!!!!!         ",
"!!!!!!!!!!!!!!!!!!!!!!          ",
"!!!!!!!!!!!!!!!!!!!!!!          ",
"!!!!!!!!!!!!!!!!!$$!!           ",
"!!!!!!!!!!!!!!!$$$$$$           ",
"!!!!!!!!!!!!$$$$$$$$$           ",
"!!!!!!!!!!!$$$$$$$$$$$          ",
"$$$$$!!!!$$$$$$$$$$$$$$ $$      ",
"$$$$$$$$$$$$$$$$$$$$$$$$$$      ",
"$$$$$$$$$$$$$$$$$$$$$$$$$$      ",
"$$$$$$$$$$$$$$$$$$$$$$$$$       ",
"$$$$$$$$$$$$$$$$$$$$$           ",
"$$$$$$$$$$$$$$$$$$$$            ",
"$$$$$$$$$$$$$$$$$$$             ",
"$$$$$$$$$$$$$$$$$$              ",
"$$$$$$$$$$$$$$$$$$              ",
"$$$$$$$$$$$$$$$$$$$$            ",
"$$$$$$$$$$$$$$$$$$$$$$          ",
"$$$$$$$$$$$$$$$$$$$$$$$         "]},
"UTFGRID_THEME_DEMO_HIGHWAYS":{
"keys":["1","2","3","4","5","6","7","8","9"],
"data":{
"1":{"Highway":"I 93","No.":"93"},
"2":{"Highway":"I 95","No.":"95"},
"3":{"Highway":"I 89","No.":"89"},
"4":{"Highway":"I 293","No.":"293"},
"5":{"Highway":"I 495","No.":"495"},
"6":{"Highway":"I 190","No.":"190"},
"7":{"Highway":"88","No.":"99"},
"8":{"Highway":"I 290","No.":"290"},
"9":{"Highway":"I 90","No.":"90"}},
"grid":[
"  !                          ## ",
"  !                        ###  ",
"  !!                       ##   ",
"  !!                      ##    ",
"  !                      ##     ",
"  !                      ##     ",
"  !!                    ##      ",
"   !!                   ##      ",
"$  !!                   #       ",
"$$$$!                  ##       ",
"    !!                ###       ",
"     !              ###         ",
"     %!             ##          ",
"     %!!           ##           ",
"     %%!           #            ",
"       !!         ##            ",
"        !!        ##            ",
"         !!   &&&&#             ",
"          !! &&& ##             ",
"          !! &   #              ",
"           !&&  ##              ",
"         &&&!   ##              ",
"       &&&& !   ##              ",
"    &&&&    !!  ##              ",
"'  &&&     ##!###               ",
"' &&&     #((!!                 ",
"  &&      #( !!                 ",
"  &&      (  !!!                ",
")))&  *********!                ",
")  &***** ##   !                ",
"*****      ##  !                ",
"***&&      ##!!!                "]},
"UTFGRID_THEME_DEMO_CITIES":{
"keys":["1","2"],
"data":{
"1":{"City":"Lowell","Population":"103439"},
"2":{"City":"Boston","Population":"574283"}},
"grid":[
"                                ",
"                                ",
"                                ",
"                                ",
"                                ",
"                                ",
"                                ",
"                                ",
"                                ",
"                                ",
"                                ",
"                                ",
"                                ",
"                                ",
"                                ",
"                                ",
"                                ",
"                                ",
"                                ",
"                                ",
"                                ",
"        !!                      ",
"                                ",
"                                ",
"                                ",
"                                ",
"                                ",
"                                ",
"               ##               ",
"                                ",
"                                ",
"                                "]},
"resolution":"8","rows":"32","columns":"32"}
The preceding response shows a UTFGrid object that contains properties for the themes
UTFGRID_THEME_DEMO_STATES,UTFGRID_THEME_DEMO_HIGHWAYS, andUTFGRID_THEME_DEMO_CITIES. (The themeUTFGRID_THEME_DEMO_COUNTIESdid not define the<hidden_info>element, and so nothing about that theme is listed in the response.)
-
3.3.5 External Map Source Adapter
An external map source adapter is the interface between a map tile server and an external map services provider. When a map image tile needs to be fetched from the external map services provider, the map tile server calls the adapter with information about the zoom level, size, and location of the tile. The adapter then constructs a provider-specific request, sends the request to the external map services provider, and return the resulting image tile to the map tile server.
The external map source adapter is a Java class that must extends the abstract Java class oracle.mapviewer.share.mapcache.MapSourceAdapter, which is defined as follows:
public abstract class MapSourceAdapter
{
   public abstract String getMapTileRequest(TileDefinition tile);
   public byte[] getTileImageBytes(TileDefinition tile) ;
   public Properties getProperties() ;
}
An adapter that extends this class must implement the following method:
-
public String getMapTileRequest(TileDefinition tile)This method should implement the logic to construct the HTTP request string that can be sent to the map services provider to fetch the map image tile. For example, if the URL of a map tile is
http://myhost/mymapserver?par1=v1&par2=v2&par3=v3, the HTTP request string returned by this method should bepar1_v1&par2=v2&par3=v3.When the map tile server cannot find a specific map tile, it calls the
getTileImageBytesmethod to fetch the binary data of the tile image, and that method calls thegetMapTileRequestmethod to construct the map tile request before fetching the tile. ThegetMapTileRequestmethod takes one parameter: aTileDefinitionobject that specifies the zoom level, bounding box, image size and image format of the requested tile. This method returns the HTTP request string.
The map source adapter also inherits all methods implemented in class MapSourceAdapter. Among them, the following methods are more important than the others:
-
public byte[] getTileImageBytes(TileDefinition tile)This method fetches the actual binary map tile image data from the external map service provider. This method is already implemented. It calls the abstract method
getMapTileRequestto construct the map tile request and sends the request to the external map services provider. If the map tiles cannot be fetched by sending HTTP requests, you can override this method to implement the appropriate logic to fetch an image tile from the map source. This method takes one parameter: aTileDefinitionobject that specifies the zoom level, bounding box, image size, and image format of the requested tile. This method returns the binary tile image data encoded in the image format specified in the map tile layer configuration settings. -
public Properties getProperties()This method returns the provider-specific parameters defined in the map tile layer configuration settings explained in Section 3.3.2.2.
The MapSourceAdapter and TileDefinition classes are packaged inside mvclient.jar, which can be found under the directory $MAPVIEWER_HOME/web/WEB/lib.
Example 3-30 shows an external map source adapter.
Example 3-30 External Map Source Adapter
/**
 * This is a sample map source adapter that can be used to fetch map
 * tiles from a MapViewer instance.
 */
package mcsadapter ;

import java.awt.Dimension;
import java.net.URL;
import java.util.Properties;
import oracle.lbs.mapclient.MapViewer;
import oracle.lbs.mapcommon.MapResponse;
import oracle.mapviewer.share.mapcache.*;

/**
 * The map source adapter must extend class
 * oracle.lbs.mapcache.cache.MapSourceAdapter.
 */

public class MVAdapter extends MapSourceAdapter
{
  /**
   * Gets the map tile request string that is to be sent to the map
   * service provider URL.
   * @param tile tile definition
   * @return request string
   */
  public String getMapTileRequest(TileDefinition tile)
  {
    // Get map source specified parameters
    Properties props = this.getProperties() ;
    String dataSource = props.getProperty("data_source") ;
    String baseMap = props.getProperty("base_map") ;
    // Use oracle.lbs.mapclient.MapViewer to construct the request string
    MapViewer mv = new MapViewer(this.getMapServiceURL()) ;
    mv.setDataSourceName(dataSource);
    mv.setBaseMapName(baseMap);
    mv.setDeviceSize(new Dimension(tile.getImageWidth(),
                                   tile.getImageHeight()));
    mv.setCenterAndSize(tile.getBoundingBox().getCenterX(),
                        tile.getBoundingBox().getCenterY(),
                        tile.getBoundingBox().getHeight());
    int format = MapResponse.FORMAT_PNG_STREAM ;
    String req = null ;
    switch(tile.getImageFormat())
    {
      case TileDefinition.FORMAT_GIF:
        mv.setImageFormat(MapResponse.FORMAT_GIF_URL);
        req = mv.getMapRequest().toXMLString().replaceFirst(
                        "format=\"GIF_URL\"", "format=\"GIF_STREAM\"") ;
        break ;
      case TileDefinition.FORMAT_PNG:
        mv.setImageFormat(MapResponse.FORMAT_PNG_URL);
        req = mv.getMapRequest().toXMLString().replaceFirst(
                        "format=\"PNG_URL\"", "format=\"PNG_STREAM\"") ;
        break ;
      case TileDefinition.FORMAT_JPEG:
        mv.setImageFormat(MapResponse.FORMAT_JPEG_URL);
        req = mv.getMapRequest().toXMLString().replaceFirst(
                        "format=\"JPEG_URL\"", "format=\"JPEG_STREAM\"");
        break ;
    }

    byte[] reqStr = null ;
    try
    {
      reqStr = req.getBytes("UTF8") ;
    }
    catch(Exception e)
    {}
    // Return the request string.
    return "xml_request="+ new String(reqStr);
  }
}
Example 3-31 shows the implementation of the MapSourceAdapter.getTileImageBytes method.
Example 3-31 MapSourceAdapter.getTileImageBytes Implementation
/**
 * Fetches the map image tile from the external map service provider by
 * sending the HTTP map tile request to the map service provider, and
 * return the binary tile image data. You can rewrite this method so that
 * the adapter can fetch the tile from an external map service provider
 * that does not accept HTTP requests at all.
 * @param tile the tile definition
 * @return the binary tile image data.
 * @throws Exception
 */
public byte[] getTileImageBytes(TileDefinition tile)
  throws Exception
{
  // construct request string
  String request = getMapTileRequest(tile) ;

  if(request == null)
  {
    throw new Exception("Null map tile request string in map source adapter!") ;
  }

  // set proxy settings
    Proxy proxy = null ;

  /* If the proxyHost is "NONE", the request is sent directly to the
   * external server. If the proxyHost is a valid host, that host will
   * be used as the proxy server. If the proxyHost is empty of omitted,
   * the global proxy setting in mapViewerConfig.xml will be in effect.
   */
  boolean noProxy = "NONE".equalsIgnoreCase(getProxyHost()) ;
  if(getProxyHost()!=null && !noProxy)
  {
    SocketAddress addr = new InetSocketAddress(proxyHost, proxyPort);
    proxy = new Proxy(Proxy.Type.HTTP, addr);
  }

  // send the request and get the tile image binary
  PrintWriter wr = null ;
  BufferedInputStream bis = null;
  try
  {
    String urlStr = mapServiceURL ;
    if("GET".equalsIgnoreCase(httpMethod))
      urlStr = mapServiceURL + "?" + request ;
    log.finest("http "+httpMethod+": "+urlStr);

    URL url = new URL(urlStr);
    // Open a URL connection based on current proxy setting
    URLConnection conn =
      proxy!=null? url.openConnection(proxy):
                   (noProxy? url.openConnection(Proxy.NO_PROXY):
                             url.openConnection()) ;
    conn.setConnectTimeout(timeOut);
    if("GET".equalsIgnoreCase(getHTTPMethod()))
      conn.connect();
    else
    {
      conn.setDoOutput(true);
      wr = new PrintWriter(conn.getOutputStream());
      wr.print(request);
      wr.flush();
      wr.close();
      wr = null ;
    }
    bis = new BufferedInputStream(conn.getInputStream());
    byte[] result = toBytes(bis) ;
    bis.close();
    bis = null ;
    return result;
  }
  catch(Exception ioe)
  {
    throw new Exception("Failed to fetch external map tile.", ioe);
  }
  finally
  {
    try
    {
      if(bis != null)
      {
        bis.close();
        bis = null;
      }
      if(wr != null)
      {
        wr.close();
        wr = null;
      }
    }
    catch(IOException ioee)
    {
      throw ioee;
    }
  }
}