26 Building a Nested Matrix Report
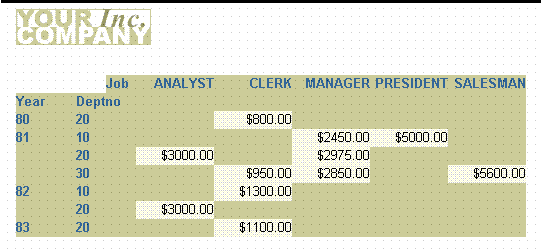
In this chapter, you will learn about nested matrix reports. By following the steps in this chapter, you can generate the report output shown in Figure 26-1.
-
A nested matrix report is a matrix report which contains more than the usual two dimensions (across and down) of a simple matrix.
-
You can create nested matrix reports with any number of queries. In Section 26.2, "Create a Single-Query Matrix", you'll create the example nested matrix report using one query. In Section 26.3, "Create a Multiple-Query Matrix", you'll use multiple queries. In Section 26.4, "Create a Multiple-Query Matrix with a Break", you will use not only group hierarchy to nest one dimension within another, but you'll also create a true parent/child relationship between the relevant groups by explicitly creating a new group and placing it within the cross product and above the other group. This will restrict the records displayed to only those for which data exists.
Notes:
-
In a nested matrix report, where you create a matrix query that has a child matrix query, the fields on which you join should be separated into a separate group in your master matrix. Otherwise, on some platforms, only the first group prints.
-
The queries used to select data for those sample matrix reports are not intended as definitive examples of matrix queries. If you are concerned with performance issues, for example, there are alternate methods of querying data that can improve the performance of a matrix report. Refer to the Oracle Reports online Help for details.
-
-
This example report uses a matrix with three dimensions, created by including three columns in the cross product. The cross product is capable of displaying every possible value for three dimensions: two down (YEAR and DEPTNO) and one across (JOB). This method does not include rows that have null values because there is a break group within the cross product group in the data model. As mentioned above, this chapter describes how to create a nested matrix with and without a break group inside of the cross product group so that you can see the difference in the output.
-
The order in which the two down dimensions (YEAR and DEPTNO) will be displayed is based upon the order in which you position their corresponding groups within the cross product; that is, of YEAR and DEPTNO, you'll position YEAR to the left of DEPTNO. This "nests" DEPTNO inside of YEAR and causes all records for DEPTNO to appear for each value of YEAR, regardless of whether that department has any data for that year.
-
For additional conceptual information, see Section 2.1.7, "About nested matrix reports".
In this example, you will create a report that cross tabulates salaries by year and department, and by job function. The result is a matrix with job functions listed across the top, years and departments down the side, and sums of salaries in the cells. Thus, you can quickly determine the sum of all of the salaries for clerks in department 20 and compare that value to the one for all clerks in some other department.
As you build this example report, you will:
-
Create a Multiple-Query Matrix with a Break within the cross product group.
To see a sample nested matrix report, open the examples folder named nestedmatrix, then open any of the Oracle Reports examples named nested1.rdf, nested2.rdf, or nested3.rdf. For details on how to access them, see "Accessing the Example Reports" in the Preface.
