Inserting Charts

Data source types: Oracle Planning and Budgeting Cloud, Oracle Enterprise Planning and Budgeting Cloud, Oracle Financial Consolidation and Close Cloud, Oracle Tax Reporting Cloud

Starting in release 11.1.2.5.700, you can insert forms as charts into Microsoft PowerPoint, giving you a graphical display of the information in the form.

Oracle Smart View for Office renders the form information as a chart in PowerPoint. You can use the chart tools in PowerPoint to change the chart design and format. You can insert a Smart View POV reporting object to change the POV of the chart.

Certain forms may or may not make ideal charts. Some form data may not present itself well in chart format. For example, a balance sheet form may not make a useful chart. However, a monthly revenue form may be a good candidate for the chart format. Oracle recommends investigating with the forms available to you and working with the forms designers to meet your requirements for charts.

Note:

The Insert Chart functionality is not available in Word or Excel.
To insert and edit a chart in PowerPoint:
  1. Launch PowerPoint and connect to the data source.
  2. Navigate to the form and select it.
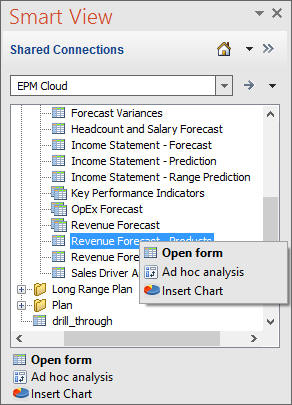
  3. In the Action Panel, select Insert Chart.

    Alternatively, right-click the form name and select Insert Chart; for example:

    Smart View Panel showing form selected and right-click menu with Insert Chart option.

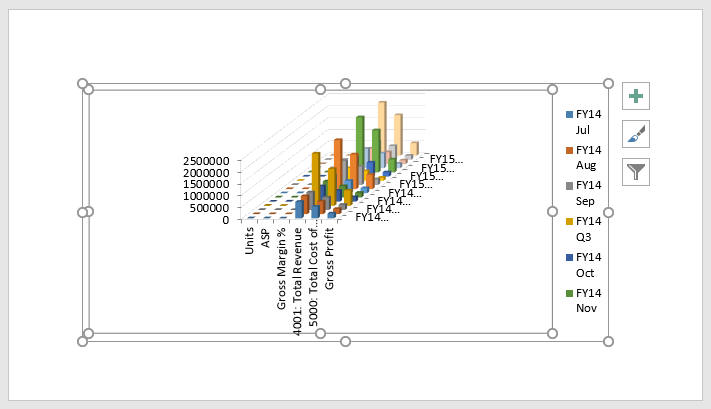
    The chart is inserted on the slide, where it can be selected and edited; in the following example, the slide width has been stretched from its initial state:


    A chart on a PowerPoint slide, selected, with the lines for resizing and some PowerPoint chart editing tools displayed.
  4. Optional: To change the POV of the chart, insert the POV control and modify the POV.
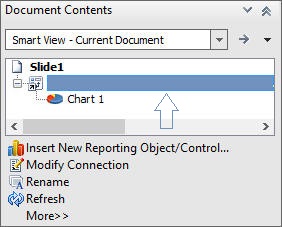
    1. In the Document Contents pane, select the data source for the chart, then select Insert New Reporting Object/Control.

      In the following example, the data source is signified by the blue bar:

      In the Document Contents pane, the data source is selected in the tree, signified by a blue bar, and the applicable menu options are displayed in the Action Panel
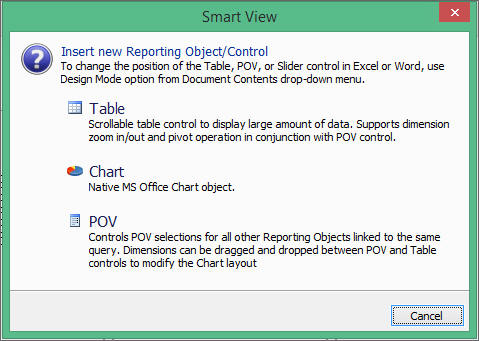
    2. In the Insert New Reporting Object/Control dialog box, click POV.

      The Insert New Reporting Object/Control dialog box, where you can pick the POV option.

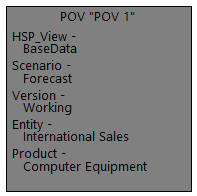
      A read-only POV is placed on the slide; for example:

      The read-only POV control that is placed on the slide. The dimensions and the selected member from each dimension that makes up the POV are listed.
    3. Click the Slide Show icon in the task bar at the bottom right of the PowerPoint window to enter slide show mode where you can modify the POV.
      The bottom right task bar area of the PowerPoint window, where you can choose Slide Show mode.
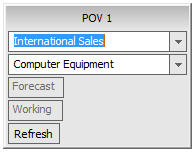
    4. In slide show mode, use the drop-down lists in the POV toolbar to make the required changes.
      Editable POV toolbar where you can change the chart POV.
    5. In the POV toolbar, click Refresh.
    6. Repeat the steps to change the POV as needed; when finished, exit slide show mode.

      You can press the Esc key to exit slide show mode.

  5. Continue with any further chart design and format edits, and then save the PowerPoint presentation as needed.