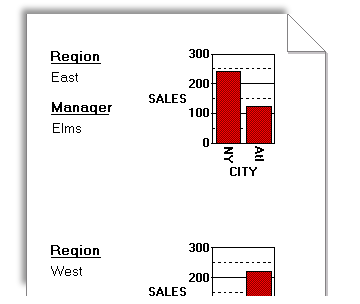
A graphical display, also called a chart, is a pictorial representation of data. You can include a graphical display in a report in two ways:
-
Create a new display: access the Chart Wizard by clicking the Chart Wizard toolbar button .
-
Reference an existing display: see the Report Builder online help.
|
|

|
|