| View Data in a Chart |
 back
|
1
2
3
4
5
6
7
|
next back
|
1
2
3
4
5
6
7
|
next
|
|
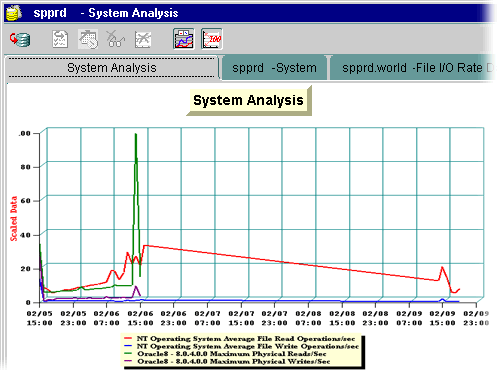
| I then select the System I/O data collection, specify the period of time to analyze, and select the types of data I want to view, and the chart I want to view it in. |

|