|
Oracle® Application Server ProcessConnect User’s Guide
10g (9.0.4) Part No. B12121-02 |
|


|

|
|
Oracle® Application Server ProcessConnect User’s Guide
10g (9.0.4) Part No. B12121-02 |
|
|
|
|
This chapter describes how to create Oracle Application Server ProcessConnect reports.
This chapter contains these topics:
|
See Also:
|
Business data exists in the runtime repository as business processes are executed. The Oracle Application Server ProcessConnect user interface tool enables you to query this information to see what is occurring and to perform business analysis. You can query this information in several different ways based on the type that you want. Specifically, you can query for information such as events, business processes, and errors. For example, you create a query for the total and average values of purchase orders in the last month. For these types of information, Oracle Application Server ProcessConnect also enables you to either see the status of a specific event or the aggregate status on a group of events.
This section contains these topics:
|
See Also: "Deploying a Configuration" for instructions on selecting a report logging level before deploying a configuration |
The first page of questions that displays for each report is the Parameters page. The values (such as the event types) available for selection on this page are based on the selected configuration. By default, these values are from the latest deployed configuration. However, you can also select Unspecified or select a different configuration from the Configuration Name list. In both these cases, the page refreshes to display values (such as business processes) applicable to your selection. To see the list of event types available with your selection, you must then click Specify Event and click the flashlight.
This section describes the values available with each configuration selection:
The following values are available for selection when the default configuration is selected. This is the selected configuration when you initially access the Parameters page:
The list of values available for selection are from the latest deployed configuration.
The event types that display for selection when you click the flashlight next to the Name field on the Parameters page are from the latest deployed configuration. For Event Status, Coordination Status, and Error Status reports, the Name field displays after you select Specify Event. For Event Analysis reports, the field automatically displays.
The event type structure that displays in the Event Content Query Expression and Event Fields sections of the Event Content page for both the Event Status and Activity Monitoring reports is from the latest deployed configuration.
The business process structure that displays in the two Port pages of the Coordination Analysis report is from the latest deployed configuration.
All queries are executed against the latest deployed configuration.
The following values are available for selection when you select Unspecified from the Configuration Name list:
The list of values available for selection are from all configurations, with any duplicate names removed.
The event types that display for selection when you click the flashlight next to the Name field on the Parameters page are from the latest deployed configuration. For Event Status, Coordination Status, and Error Status reports, the Name field displays after you select Specify Event. For Event Analysis reports, the field automatically displays.
The event type structure that displays in the Event Content Query Expression and Event Fields sections of the Event Content page for both the Event Status and Activity Monitoring reports is from the latest deployed configuration.
The business process structure that displays in the two Port pages of the Coordination Analysis report is from the latest deployed configuration.
All queries are executed against all configurations.
The following values are available for selection when you select a specific configuration (for example, i_Procure_v1) from the Configuration Name list:
The list of values available for selection are from the i_Procure_v1 configuration.
The event types that display for selection when you click the flashlight next to the Name field on the Parameters page are from the i_Procure_v1 configuration. For Event Status, Coordination Status, and Error Status reports, the Name field displays after you select Specify Event. For Event Analysis reports, the field automatically displays.
The event type structure that displays in the Event Content Query Expression and Event Fields sections of the Event Content page for both the Event Status and Activity Monitoring reports is from the i_Procure_v1 configuration.
The business process structure that displays in the two Port pages of the Coordination Analysis report is from the i_Procure_v1 configuration.
All queries are executed against the i_Procure_v1 configuration.
The Oracle Application Server ProcessConnect user interface tool enables you to create process monitoring (also known as status) reports. Status reports show the current status of events, coordinations, errors, collaborations, and business messages in an integration.
They are best used to either monitor the status of events or business processes or debug the progress of a specific deployed integration.
Status reports provide a snapshot of the integration process. The following types of status reports are provided:
Events
Event status reports provide information on the status of events. For example, these reports can identify what has occurred with a specific purchase order received from a procurement system that has not yet been placed in the general ledger. This enables you to see whether events are active, consumed, in an error state, or waiting for instance processing.
Coordinations
Coordination status reports provide information on the status of a specific coordination. For example, these reports can identify all coordinations with a specific trading partner within a specific period of time. This enables you to see whether specific coordinations have aborted, closed, or remained open.
Errors
Error status reports enable you to view details about errors occurring in an integration. You can create reports that provide details on all errors or you can create reports that provide details about a specific type of error (for example, the error type, error class, and error code).
Collaborations
Collaboration reports enable you to generate reports about the collaboration name (such as RosettaNet partner interface process (PIP) 01A, 3A4, or 3A6) in an integration.
Business messages
Business message status reports enable you to identify details about the sending trading partner in an integration, such as their collaboration name, actor role (for example, buyer or seller), protocol message identification (ID), and exchange protocol (RosettaNet).
|
See Also:
The following examples of creating process monitoring reports: |
Activity monitoring reports analyze specific business activities across integration objects (for example, the total number of event instances sent by a specific party during this quarter).
|
See Also:
|
Process optimization reports monitor business process efficiency (for example, the response time for orders placed by a specific party during the last month).
|
See Also:
|
Process monitoring reports monitor the current state of an integration object (for example, an event instance).
The following process monitoring reports are provided:
There are a number of elements of information in process monitoring reports that you can choose to specify. Some information is necessary to run or create the report. Other parameters are advanced and optional and designed to enable you to further narrow the scope of a query.
Process monitoring reports are structured in a consistent manner. On the first page, you can choose to specify mandatory and optional parameters necessary to create the report. Other advanced parameters can be specified on a second page, if necessary. Final pages enable you to specify the layout of your report information and view a summary of the report to create.
Follow these instructions to create an event status report. The pages that appear are part of a wizard in which you enter information that appears in a final report.
Table 23-1 provides an overview of the pages that appear.
Table 23-1 Event Status Report Pages Overview
| Page | Description |
|---|---|
| Event Report: Parameters | A page that consists of two sections:
|
| Event Report: Event Content | A page that enables you to specify querying events based on content (such as querying for all purchase order amounts over $1000). You can also specify the event fields to display in the report. |
| Event Report: Layout | A page that enables you to specify the layout of information in your report, such as specifying the column names and order of their appearance in the report. |
| Event Report: Review | A page that enables you to review your selections before creating the report. |
To create an event status report:
Select the Reports tab.
Select the Process Monitoring tab.
Select Event Status.
The Event Report: Parameters page appears.
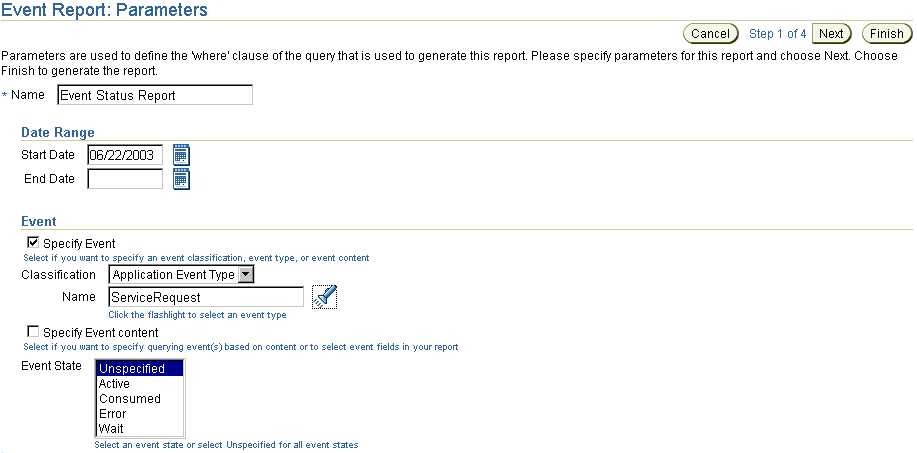
Enter a unique and recognizable name in the Name field or accept the default name of Event Status Report. This is the only mandatory field on this page.
Click the calendar icon for the Start Date field to select a date at which to begin gathering report data.
Click the calendar icon for the End Date field to select a date at which to stop gathering report data.
If you want to specify a specific event classification and event type name, click the Specify Event box. The page refreshes to display the following fields:
Select Application Event Type, Business Event Type, or Native Event Type from the Classification list.
Click the flashlight to select the specific event type name for the Name field. Only event type names that are part of a deployed configuration display in this list; event types that are only in the design-time repository do not appear.
|
Note: You must use the flashlight to select an event type name. Do not manually enter a name in the Name field. |
If you want to specify querying events (for example, query for all purchase order amounts over $1000) based on content or to select event fields for your report, select the Specify Event content box and ensure that you specified an event type name in Step 4b.
Select an event state from the Event State list or select Unspecified to select all event states:
| State | Description |
|---|---|
| Active | The event is currently processing. |
| Consumed | Event processing has completed. The event can no longer be used. Consumed events are only used for correlation or during monitoring. A consumed event cannot be copied or sent for additional processing. |
| Error | An error occurred during the event lifecycle. |
| Wait | The event is potentially out of order and cannot currently be processed. |
The wizard page that displays next is based on selections you made in Step 4 and are about to make on this Event Report: Parameters page.
See the following sections based on your selections:
| If You... | Then... |
|---|---|
| Want to specify advanced report parameters |
|
| Selected a specific event type name in Step 4b and selected the Specify Event content box in Step 4c |
|
| Do not want to perform either of these tasks |
|
Select the business process for which to create a report from the Business Process list.
Select a status from the Coordination State list. If you select Unspecified, all coordination states are included in the report.
| State | Description |
|---|---|
| aborted | Coordination processing has been aborted. |
| closed | Coordination processing has completed. |
| open | Coordination processing is occurring. |
Select the sending party from the From Party list. Only parties included in deployed configurations appear.
Select the receiving party from the To Party list. Only parties included in deployed configurations appear.
Select the configuration for which to create a report from the Configuration Name list. See "Configuration Support in Reports" for details about the type of information that appears in fields based on your selection.
Click Next.
See the following section based on your selections.
| If You... | Then... |
|---|---|
| Selected a specific event type name in Step 4b and selected the Specify Event content box in Step 4c | Go to "Specify Event Contents". |
| Did not perform this task | Go to "Specifying the Layout of Your Report". |
If you selected a specific event type name in Step 4b and selected the Specify Event content box in Step 4c, the Event Report: Event Content page appears. This page enables you to create conditional expressions on event content (for example, query for purchase order amounts over $1000) and select event fields for the summary and detail reports.
Go to the Event Content Query Expression section.
Select Condition expression not specified.
Click Update to build a new condition.
Click Expand All or select a specific entry to expand in the Left Operand column to display the contents of the selected event.
Select a name.
Select an operator from the Operator list (for example, =):
!= (not equal to)
< (less than)
<= (less than or equal to)
= (equal to)
> (greater than)
>= (greater than or equal to)
Enter a value in the Right Operand field.
Click Apply.
The results display onscreen.
Go to the Event Fields section.
Click Expand All or select a specific entry to expand.
If you want, you can select the event fields to use in the summary report and details reports. A later page in this wizard enables you to specify the order in which these fields display in the reports.
These fields provide the following functionality:
Summary Report Grouping
Select Yes to include this event field in the summary report.
Detail Report Inclusion
Select Yes to include this event field in the details reports.
Alias
Use the default alias or specify a different name to use as the column name in the report.
Click Next.
Follow these instructions to create a coordination status report. The pages that appear are part of a wizard in which you enter information that appears in a final report.
Table 23-2 provides an overview of the pages that appear.
Table 23-2 Coordination Status Report Pages Overview
| Page | Description |
|---|---|
| Coordination Report: Parameters | A page that consists of two sections:
|
| Coordination Report: Layout | A page that enables you to specify the layout of information in your report, such as specifying the column names and order of their appearance in the report. |
| Coordination Report: Review | A page that enables you to review your selections before creating the report. |
To create a coordination status report:
Select the Reports tab.
Select the Process Monitoring tab.
Select Coordination Status.
The Coordination Report: Parameters page appears.
Enter a unique and recognizable name in the Name field or accept the default name of Coordination Status Report. This is the only mandatory field on this page.
Click the calendar icon for the Start Date field to select a date at which to begin gathering report data.
Click the calendar icon for the End Date field to select a date at which to stop gathering report data.
Select the business process for which to create a report from the Business Process list.
Select a status from the Coordination State list. If you select Unspecified, all coordination states are included in the report.
| State | Description |
|---|---|
| aborted | Coordination processing has been aborted. |
| closed | Coordination processing has completed. |
| open | Coordination processing is occurring. |
See the following section based on whether you want to specify advanced report parameters.
| If You... | Then... |
|---|---|
| Want to specify advanced report parameters |
|
| Do not want to specify advanced report parameters |
|
If you want to specify a specific event, click the Specify Event box and perform Steps 0` through 0b. You must perform these steps if you want to go to the next page in this wizard.
Select the Application Event Type, Business Event Type, or Native Event Type from the Classification list.
Click the flashlight to select the specific event type name for the Name field. Only event type names that are part of a deployed configuration display in this list; event types that are only in the design-time repository do not appear.
|
Note: You must use the flashlight to select an event type name. Do not manually enter a name in the Name field. |
Select an event state from the Event State list or select Unspecified to select all event states:
| State | Description |
|---|---|
| Active | The event is currently processing. |
| Consumed | Event processing has completed. The event can no longer be used. Consumed events are only used for correlation or during monitoring. A consumed event cannot be copied or sent for additional processing. |
| Error | An error occurred during the event lifecycle. |
| Wait | The event is potentially out of order and cannot currently be processed. |
Select the sending party from the From Party list. Only parties included in deployed configurations appear.
Select the receiving party from the To Party list. Only parties included in deployed configurations appear.
Select the configuration for which to create a report from the Configuration Name list. See "Configuration Support in Reports" for details about the type of information that appears in fields based on your selection.
Click Next.
Follow these instructions to create an error status report. The pages that appear are part of a wizard in which you enter information that appears in a final report.
Table 23-3 provides an overview of the pages that appear.
Table 23-3 Error Status Report Pages Overview
| Page | Description |
|---|---|
| Error Report: Parameters | A page that consists of two sections:
|
| Error Report: Error Event Content | A page that enables you to specify querying events based on content. |
| Error Report: Layout | A page that enables you to specify the layout of information in your report, such as specifying the column names and order of their appearance in the report. |
| Error Report: Review | A page that enables you to review your selections before creating the report. |
To create an error status report:
Select the Reports tab.
Select the Process Monitoring tab.
Select Error Status.
The Error Report: Parameters page appears.
Enter a unique and recognizable name in the Name field or accept the default name of Error Status Report. This is the only mandatory field on this page.
Click the calendar icon for the Start Date field to select a date at which to begin gathering report data.
Click the calendar icon for the End Date field to select a date at which to stop gathering report data.
Select a specific error class or select Unspecified for all error classes in the Error Class list:
Domain
These are errors that impact events in a specific Oracle Application Server ProcessConnect middle-tier instance. An example of a domain error occurrence is when the runtime system uses an incorrectly-created event transformation map.
System
These are errors that impact the entire system, and not just Oracle Application Server ProcessConnect. Examples of system error occurrences include a database being down, a disk being full, or network connectivity problems.
Enter specific error codes for which to search in the Error Code field (separated by commas) or leave this field blank to search for all errors.
Enter a specific error message in the Error Message field for which to search or leave this field blank to search for all errors.
See the following section based on whether you want to specify advanced report parameters.
| If You... | Then... |
|---|---|
| Want to specify advanced report parameters |
|
| Do not want to specify advanced report parameters |
|
If you want to specify a specific event, click the Specify Event box and perform Steps 0` through 0b. Otherwise, go to Step 2.
Select the Application Event Type, Business Event Type, or Native Event Type from the Classification list.
Click the flashlight to select the specific event type name for the Name field. Only event type names that are part of a deployed configuration display in this list; event types that are only in the design-time repository do not appear. If you want to specify querying events based on content on a later page, ensure that you specify an event type name.
|
Note: You must use the flashlight to select an event type name. Do not manually enter a name in the Name field. |
Select the business process for which to create a report from the Business Process list.
Select a status from the Coordination State list. If you select Unspecified, all coordination states are included in the report.
| State | Description |
|---|---|
| aborted | Coordination processing has been aborted. |
| closed | Coordination processing has completed. |
| open | Coordination processing is occurring. |
Select the sending party from the From Party list. Only parties included in deployed configurations appear.
Select the receiving party from the To Party list. Only parties included in deployed configurations appear.
Select the configuration for which to create a report from the Configuration Name list. See "Configuration Support in Reports" for details about the type of information that appears in fields based on your selection.
See the following section based on your selection at Step 0.
| If You... | Then... |
|---|---|
| Selected the Specify Event box in Step 0 and selected a specific event type name in Step 0b |
|
| Did not perform this task |
|
If you selected the Specify Event box in Step 0 and selected a specific event type name in Step 0b, the Error Report: Error Event Content page appears. This page enables you to create conditional expressions on event content.
Go to the Event Content Query Expression section.
Select Condition expression not specified.
Click Update to build a new condition.
The Create Condition Expression page appears.
Click Expand All or select a specific entry to expand in the Left Operand column to display the contents of the selected event.
Select a name.
Select an operator from the Operator list (for example, =):
!= (not equal to)
< (less than)
<= (less than or equal to)
= (equal to)
> (greater than)
>= (greater than or equal to)
Enter a value in the Right Operand field.
Click Apply.
The results display onscreen.
Click Next.
Follow these instructions to create a collaboration status report. The pages that appear are part of a wizard in which you enter information that appears in a final report.
To create a collaboration status report:
Select the Reports tab.
Select the Process Monitoring tab.
Select Collaboration Status.
The Collaboration Report: Parameters page appears.
Enter the following details:
| Field | Description |
|---|---|
| Collaboration Name | Select the collaboration name (for example, 0A1, 3A4, or 3A6). |
| Protocol Collaboration ID | Enter the protocol message ID. |
| Configuration Name | Select the configuration name. |
Click Finish.
Go to "Reviewing Your Output".
Follow these instructions to create a business message status report. The pages that appear are part of a wizard in which you enter information that appears in a final report.
To create a business message status report:
Select the Reports tab.
Select the Process Monitoring tab.
Select Business Message Status.
The Business Message Report: Parameters page appears.
Enter the following details:
| Field | Description |
|---|---|
| Sending Trading Partner | Select the trading partner sending the message. |
| Collaboration Name | Select the collaboration name of the trading partner (for example, 0A1, 3A4, or 3A6). Your selection causes only those actors applicable to the collaboration name to display in the Actor field. |
| Actor | Select the actor type for the collaboration name you selected in the Collaboration Name list:
|
| Protocol Message ID | Enter the protocol message ID. |
| Exchange Protocol | Select RosettaNet. |
| Configuration Name | Select the configuration name. |
Click Finish.
Go to "Reviewing Your Output"
Activity monitoring reports analyze specific business activities across integration objects (for example, the total number of event instances sent by a specific party during this quarter).
Follow these instructions to create an activity monitoring report. The pages that appear are part of a wizard in which you enter information that appears in a final report.
Table 23-4 provides an overview of the pages that appear.
Table 23-4 Activity Monitoring Report Pages Overview
| Page | Description |
|---|---|
| Event Analysis Report: Parameters | A page that consists of two sections:
|
| Event Analysis Report: Event Content | A page that enables you to specify querying events based on content. |
| Event Analysis Report: Layout | A page that enables you to specify the layout of information in your report, such as specifying the column names and order of their appearance in the report. |
| Event Analysis Report: Review | A page that enables you to review your selections before creating the report. |
To create an activity monitoring report:
Select the Reports tab.
Select the Activity Monitoring tab.
The Event Analysis Report: Parameters page appears.
Enter a unique and recognizable name in the Name field or accept the default name of Event Analysis Report. This is a mandatory field.
Click the calendar icon for the Start Date field to select a date at which to begin gathering report data.
Click the calendar icon for the End Date field to select a date at which to stop gathering report data.
Select the Application Event Type, Business Event Type, or Native Event Type from the Classification list. This is a mandatory field.
Click the flashlight to select the specific event type name for the Name field. Only event type names that are part of a deployed configuration display in this list; event types that are currently in the design-time repository do not appear. This is a mandatory field. You must select a name or you cannot go to the next page in this wizard.
|
Note: You must use the flashlight to select an event type name. Do not manually enter a name in the Name field. |
Select an event state from the Event State list or select Unspecified to select all event states:
| State | Description |
|---|---|
| Active | The event is currently processing. |
| Consumed | Event processing has completed. The event can no longer be used. Consumed events are only used for correlation or during monitoring. A consumed event cannot be copied or sent for additional processing. |
| Error | An error occurred during the event lifecycle. |
| Wait | The event is potentially out of order and cannot currently be processed. |
The wizard page that displays next is based on selections you made in Step 5 or are about to make on this Event Analysis Report: Parameters page.
See the following sections based on your selections:
| If You... | Then... |
|---|---|
| Want to specify advanced report parameters |
Note: You cannot access these advanced parameters until you use the flashlight to select an event type name for the Name field in Step 5. |
| Selected a specific event type name in Step 5 and do not want to specify advanced report parameters |
|
Select the business process for which to create a report from the Business Process list.
Select a status from the Coordination State list. If you select Unspecified, all coordination states are included in the report.
| State | Description |
|---|---|
| aborted | Coordination processing has been aborted. |
| closed | Coordination processing has completed. |
| open | Coordination processing is occurring. |
Select the sending party from the From Party list. Only parties included in deployed configurations appear.
Select the receiving party from the To Party list. Only parties included in deployed configurations appear.
Select the configuration for which to create a report from the Configuration Name list. See "Configuration Support in Reports" for details about the type of information that appears in fields based on your selection.
If you selected a specific event type name in Step 5, the Event Analysis Report: Event Content page appears. This page enables you to create conditional expressions on event content and select event fields and their aggregation type for the summary and details reports.
Go to the Event Content Query Expression section.
Select Condition expression not specified.
Click Update to build a new condition.
The Create Condition Expression page appears.
Click Expand All or select a specific entry to expand in the Left Operand column to display the contents of the selected event.
Select a name.
Select an operator from the Operator list (for example, =):
!= (not equal to)
< (less than)
<= (less than or equal to)
= (equal to)
> (greater than)
>= (greater than or equal to)
Enter a value in the Right Operand field.
Click Apply.
The results display onscreen.
Click Next.
Go to the Event Fields section.
Click Expand All or select a specific entry to expand.
If you want, you can select the event fields to use in the summary report and details reports. A later page in this wizard enables you to specify the order in which these fields display in the reports.
These fields provide the following functionality:
Aggregation Type
Select Average to calculate the average, Sum to add the total amount, or Both to perform both calculations on the condition expression you created in Steps 4 through 8.
|
Note: Ensure that the string fields selected for Sum or Average have numeric content. Otherwise, blank Sum and Average columns appear in the final report. |
Summary Report Grouping
Select Yes to include this event field in the summary report.
Detail Report Inclusion
Select Yes to include this event field in the details reports.
Alias
Use the default alias or specify a different name to use as the column name in the report.
Click Next.
Process optimization reports monitor business process efficiency (for example, the response time for orders placed by a specific party during the last month).
Follow these instructions to create a process optimization report. The pages that appear are part of a wizard in which you enter information that appears in a final report.
To create a process optimization report:
Select the Reports tab.
Select the Process Optimization tab.
Table 23-5 provides an overview of the pages that appear.
Table 23-5 Process Optimization Report Pages Overview
| Page | Description |
|---|---|
| Coordination Analysis Report: Parameters | A mandatory page for specifying basic parameters such as a report name, start and end dates for gathering data, business process, coordination state (aborted, closed, or open), and configuration name. While only the report name is mandatory, specifying these other parameters enables you to narrow the focus of your report. |
| Coordination Analysis Report: Ports | A page on which you must specify a specific role or step port as the first port endpoint for collecting data. |
| Coordination Analysis Report: Ports | A page on which you must specify a specific role or step port as the second port endpoint for collecting data. |
| Coordination Analysis Report: Layout | A page that enables you to specify the layout of information in your report, such as specifying the column names and order of their appearance in the report. |
| Coordination Analysis Report: Review | A page that enables you to review your selections before creating the report. |
The Coordination Analysis Report: Parameters page appears.
Enter a unique and recognizable name in the Name field or accept the default name of Coordination Analysis Report. This is the only mandatory field on this page.
Click the calendar icon for the Start Date field to select a date at which to begin gathering report data.
Click the calendar icon for the End Date field to select a date at which to stop gathering report data.
Select the business process for which to create a report from the Business Process list.
Select a status for the business process from the Coordination State list. If you select Unspecified, all coordination states are included in the report.
| State | Description |
|---|---|
| aborted | Coordination processing has been aborted. |
| closed | Coordination processing has completed. |
| open | Coordination processing is occurring. |
Select the configuration for which to create a report from the Configuration Name list. See "Configuration Support in Reports" for details about the type of information that appears in fields based on your selection.
Click Next.
The first Coordination Analysis Report: Ports page appears.
Click a specific business process to expand or click Expand All to display all role ports and step ports integrated with this business process.
Select a specific port as the first endpoint for collecting report data. This is a mandatory task.
Select the sending party from the From Party list. Only parties included in deployed configurations appear.
The second Coordination Analysis Report: Ports page appears.
Click a specific business process to expand or click Expand All to display all role ports and step ports integrated with this business process.
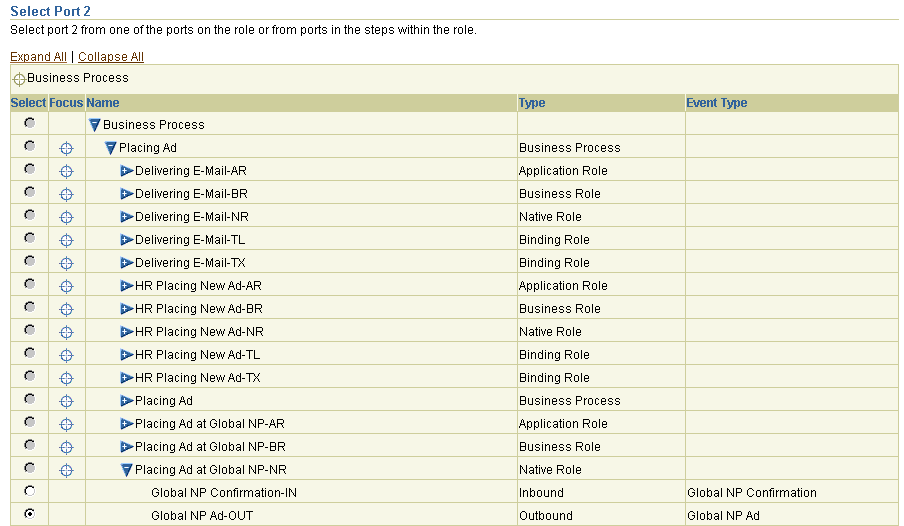
Select a specific port as the second endpoint for collecting report data. This is a mandatory task. Your port selections determine the total amount of time it takes for an event to enter one port and exit through the other port. This is useful for determining the efficiency of your business process.
Select the outgoing party from the From Party list. Only parties included in deployed configurations appear.
Click Next.
The Report: Layout page appears and enables you to specify the layout of information in your report. The fields available for selection are based on your selections in the Parameters page and any additional fields you selected in the Event Content page. The left-most column that you specify in your layout determines the method by which information is sorted in your report. If you want to change the order by which information is sorted, then switch the column order on this page.
Column headers displaying in top-to-bottom order in the Selected Fields lists described in this section appear in left-to-right order, respectively, in the final summary and details reports.
Go to the Grouping Fields section to select summary report column headers.
Select the column headers in the Available Fields list.
Click Move to copy a column header or Move All to copy all column headers to the Selected Fields list.
Go to the Details Fields section to select details report column headers.
Select the column headers in the Available Fields list.
Click Move to copy a column header or Move All to copy all column headers to the Selected Fields list.
Enter optional comments in the Comments field. These comments appear under the report title.
Click Next.
Go to "Reviewing Your Selections Before Creation" to review your selections.
The Report: Review page appears. The selections that you have made on previous pages of the wizard appear.
Review your selections. If you want to make changes, click the Back button provided by the wizard.
Click Finish when satisfied with your selections.
Go to "Reviewing Your Output".
See one of the following sections based on the type of report you created:
The report is generated and displays onscreen. You cannot customize the fields that display in these types of reports. The summary report provides links to instance data reports.
The report is generated and displays onscreen. Separate tables display for the summary and detail reports with the column headers you selected in the Report: Layout page. The summary report provides links to the details report. The details report provides additional links to instance data in the Details column.
This section provides examples of creating reports.
Table 23-6 lists the report examples provided:
Table 23-6 Report Examples
| Report Type | Example |
|---|---|
| Process Monitoring: |
|
|
"Monitoring iProcurement Process Status"
|
|
"Monitoring Coordination Details"
|
|
"Monitoring Current Errors in an Integration"
|
| Activity Monitoring | "Monitoring the Total and Average Amount of Desktop Personal Computers for this Month"
|
| Process Optimization | "Monitoring Business Process Efficiency"
|
This example describes how to monitor the status of iProcurement purchase orders moving through Oracle Application Server ProcessConnect during a specific time period.
Select Reports > Process Monitoring.
Enter a unique and recognizable name in the Name field or accept the default name.
Click the calendar icon for the Start Date field to select the date of one month ago.
Leave the End Date field blank to indicate today’s date.
Click the Specify Event box.
Select Application Event Type from the Classification list.
Click the flashlight to select the specific event type name for the Name field. For this example, an event named ServiceRequest is selected.
The Event Report: Parameters page displays your selections:
Click Finish.
The Summary Report of the Event Status Report page appears and indicates that six iProcurement purchase order requests were processed in the last month.

Click Details to display the Details page.
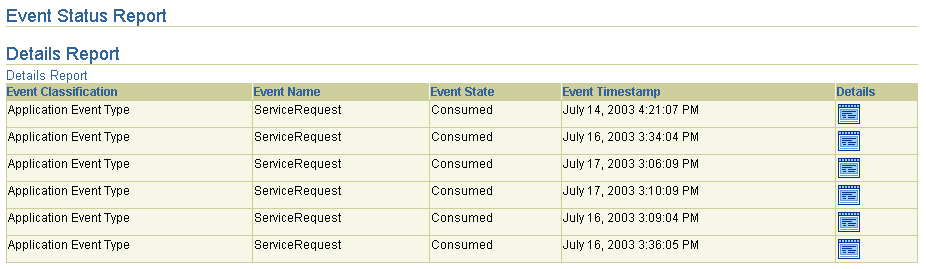
This page displays the application event types consumed with each of the six purchase order requests over the past month. Since these events have all completed processing, their state display as consumed. The times at which these events were created also display in the Event Timestamp column.
Click Details for a specific event classification.
This details page displays the roles and steps that processed this event, their current status, and the time the event was last modified in that role or step. Details about the predecessor (native) and successor (business) events for the selected event (application) also display.
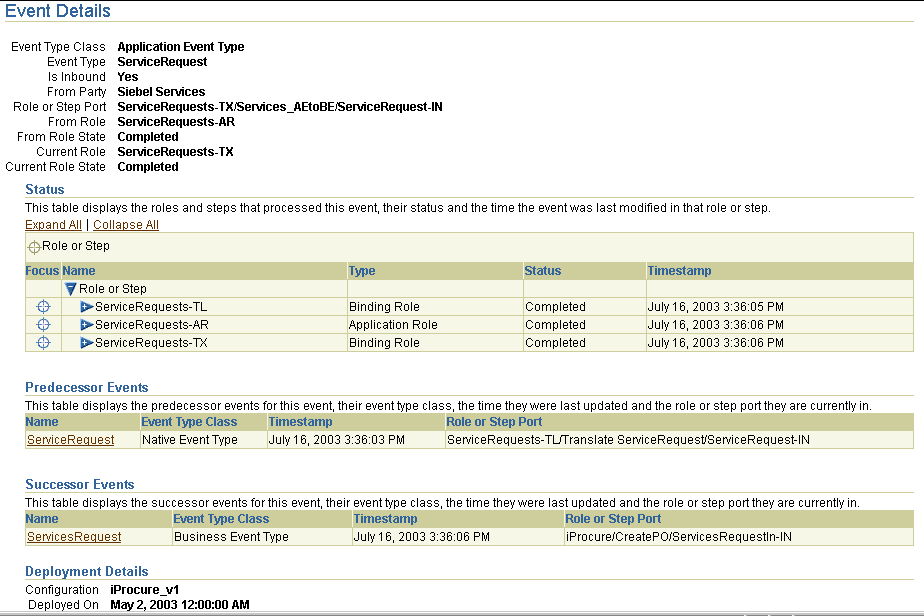
If this is an event details report for a native event, Correlated To and Correlated By sections display details about any initiating and target native event instances that have been correlated. An Event Payload window also displays the contents of the native format file (for example, the contents of an XML file).
This example describes how to monitor coordination details.
Select Reports > Process Monitoring > Coordination Status.
Enter a unique and recognizable name in the Name field or accept the default name.
Click the calendar icon for the Start Date field to select the date of one week ago.
Leave the End Date field blank.
Click Finish.
The Summary Report of the Coordination Status Report page appears.

The total number of coordinations processed in the last week appears.
Click Details.
The Details Report of the Coordination Status Report page appears.
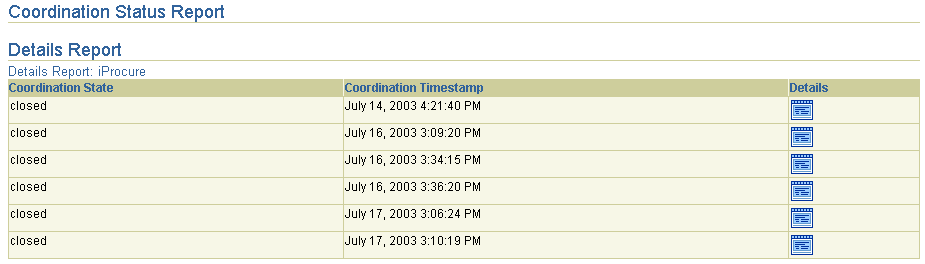
A timestamp indicates when coordination processing completed.
Click Details for a specific coordination.
A second Coordination Details page appears. The upper portion of this page displays details such as the roles within this coordination, the steps within those roles, their current status, and their creation time.
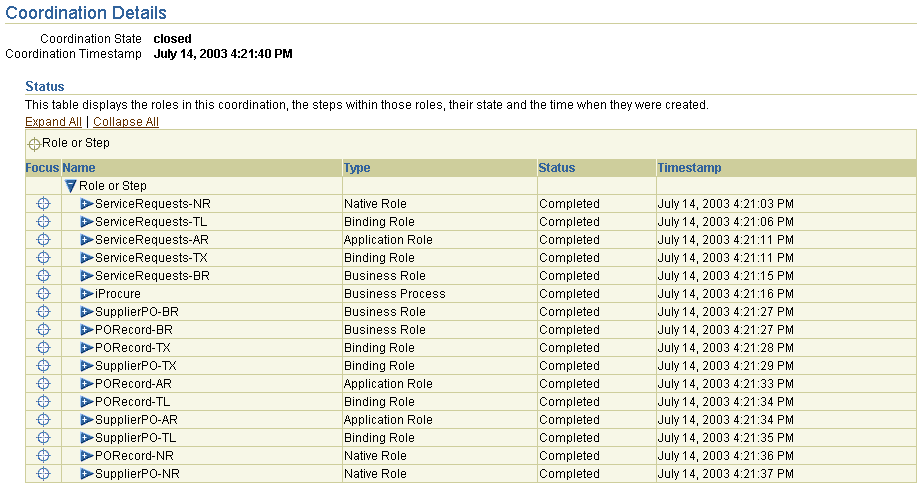
Expand a specific role to display additional report details about steps.
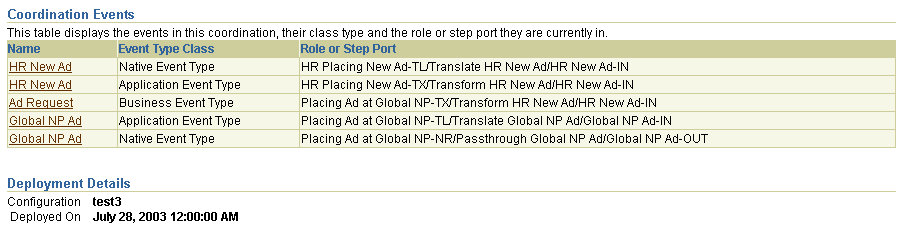
The lower portion of this page displays the events in this coordination, their event classification, and the role or step port in which they were processed.
This example describes how to identify the event errors that have occurred during a specific period of time.
Select Reports > Process Monitoring > Error Status.
Enter a unique and recognizable name in the Name field or accept the default name.
Click the calendar icon for the Start Date field to select the date of one week ago.
Leave the End Date field blank to indicate today’s date.
Click Finish. The Summary Report of the Error Status Report page displays the number of errors occurring in the past week.
Click Details. The Details Report of the Error Status Report page appears.
The Error Timestamp column indicates when the error first occurred. The Last Occurred Timestamp column indicates the last time the error occurred. The Retry Count column indicates the number of retries that were attempted to recover from the error.
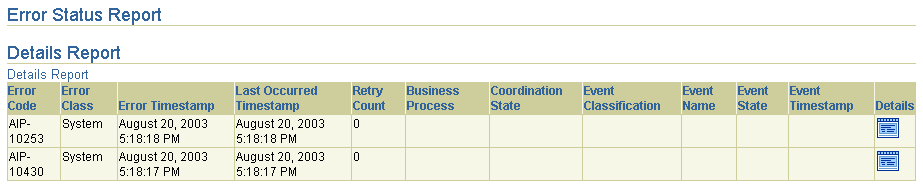
If this is a domain error associated with an event, two additional links can appear along with the link in the Details column. These additional links provide access to the Event Instance Details page and the Coordinations Instance details page.
Click Details in the Details column.
The Error Details page displays specific details about the error, including error class, code, and message. In this example, a system error occurred.

This example describes how to monitor the total and average amount of purchase orders over a specific time period.
Select Reports > Activity Monitoring.
Enter a unique and recognizable name in the Name field or accept the default name.
Click the calendar icon for the Start Date field to select the date of one month ago.
Leave the End Date field blank to indicate today’s date.
Select Application Event Type from the Classification list.
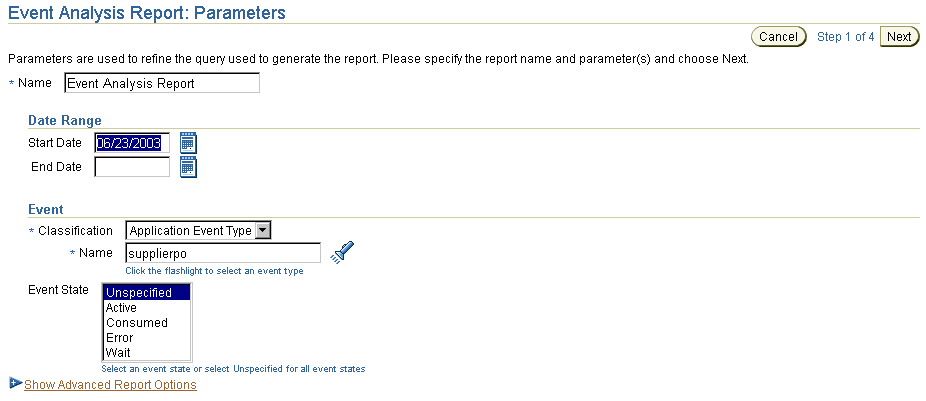
Click the flashlight to select the specific event type name for the Name field. For this example, supplierpo is selected.
The Event Analysis Report: Parameters page displays your selections:
Click Next.
The Event Analysis Report: Event Content page appears.
Go to the Event Content Query Expression section.
Click the Select button for Condition expression not specified.
Click Update.
The Create Condition Expression page appears.
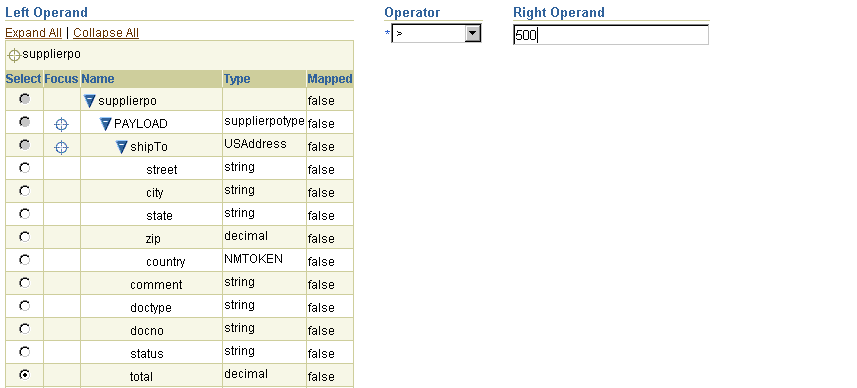
Click Expand All or select a specific entry to expand in the Left Operand section.
Select total.
Select > from the Operator list.
Enter 500 in the Right Operand field.
The Create Condition Expression page displays the following selections:
Click Apply.
You are returned to the Event Analysis Report: Event Content page. The condition you created displays in the Event Content Query Expression section. This condition finds the purchase orders over $500.

Go to the Event Fields section of the Event Analysis Report: Event Content page.
Click Expand All or select a specific entry to expand.
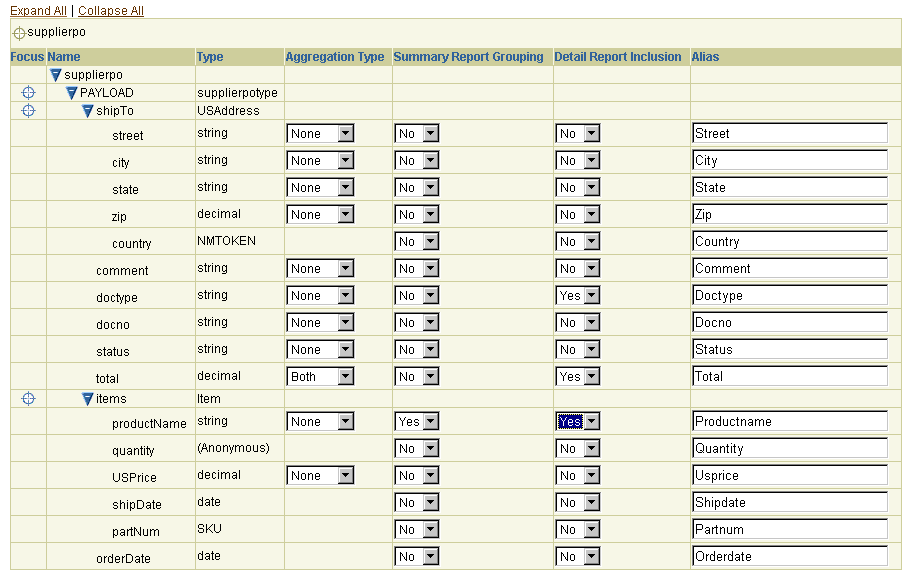
Select Both in the Aggregation Type column for total. This selection compiles the average and the total sum of purchase orders over $500.
Select Yes for ProductName in the Summary Report Grouping column.
Select Yes in the Detail Report Inclusion column for doctype, productName, and total.
The Event Report: Event Content page displays the following selections:
Click Next.
Go to the Grouping Fields section.
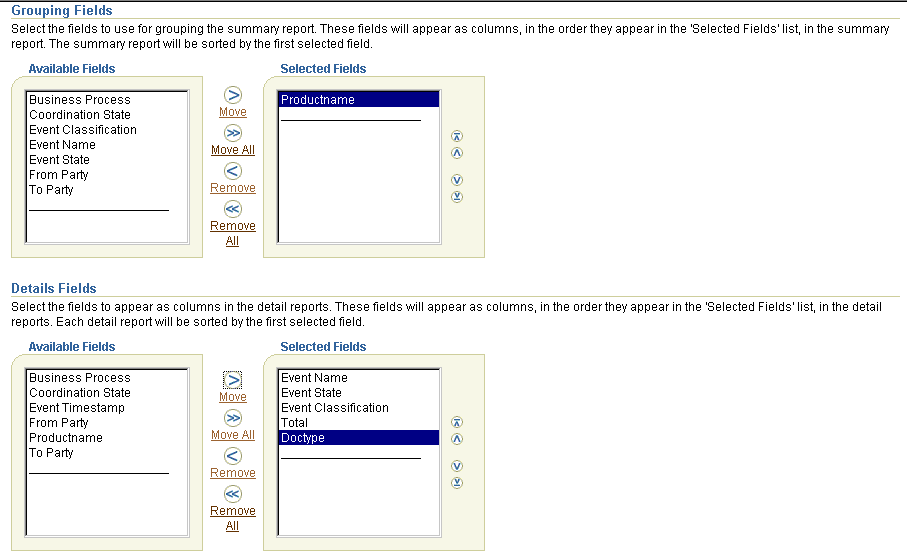
Select Productname in the Available Fields section.
Click Move.
Go to the Details Fields section.
Select Doctype and Total in the Available Fields section.
Click Move.
The Event Analysis Report: Layout page displays your selections:
Click Finish.
The Summary Report of the Event Status Report page displays the results. The Productname column appears because you selected it in Step 23. The Total Sum and Total Average columns display because you selected both in Step 18.

Click Details for additional details. The Total and Doctype columns display because you selected Both in Step 26.

This example describes how to monitor the efficiency of your business process by identifying the total amount of time it takes for an event to be processed from one end to another.
Select the Reports > Process Optimization.
Enter a unique and recognizable name in the Name field or accept the default name.
Click the calendar icon for the Start Date field to select the date of one month ago.
Leave the End Date field blank to indicate today’s date.
Click Next.
The Coordination Analysis Report: Ports page appears.
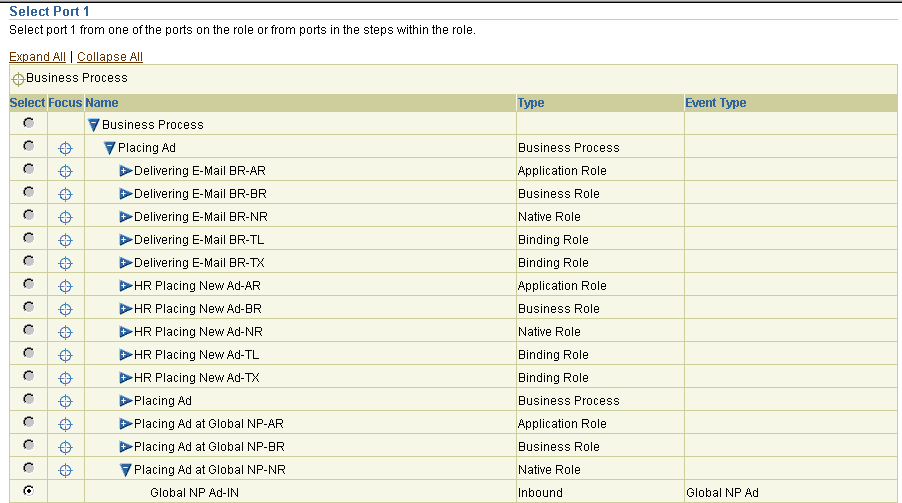
Click Expand All or select a specific entry to expand.
Select the first port endpoint for collecting information (in this example, the Global NP Ad-IN port of native role Placing Ad at Global NP-NR is selected):
Click Next.
Select the second port endpoint for collecting information (for this example, the Global NP Ad-OUT port of native role Placing Ad at Global NP-NR is selected):
Click Next.
The Event Analysis Report: Layout page appears.
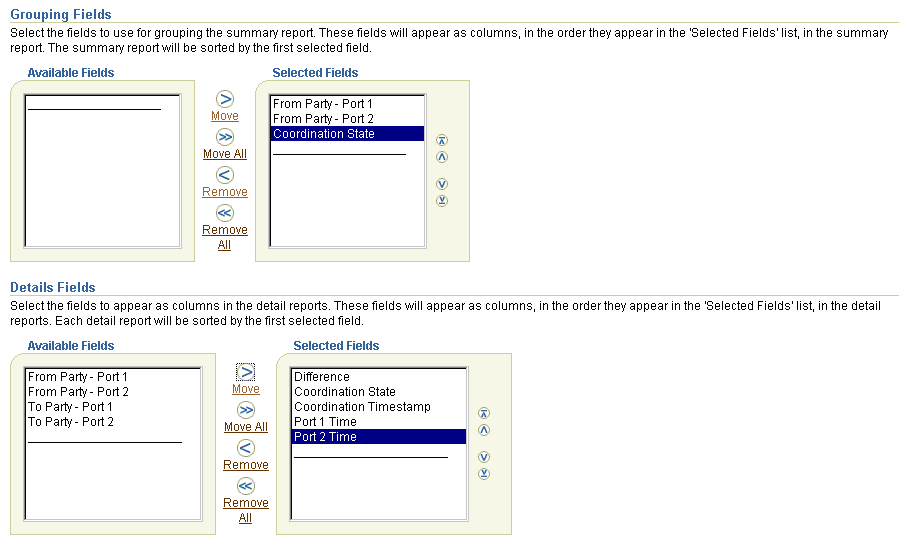
Go to the Grouping Fields section.
Make appropriate selections in the Available Fields section.
Click Move.
Go to the Details Fields section.
Make appropriate selections in the Available Fields section.
Click Move.
The Coordination Analysis Report: Layout page displays your selections:
Click Finish.
The Summary Report of the Coordination Analysis Report page appears. Note the amount of time it takes to process from the inbound native role to the outbound native role.
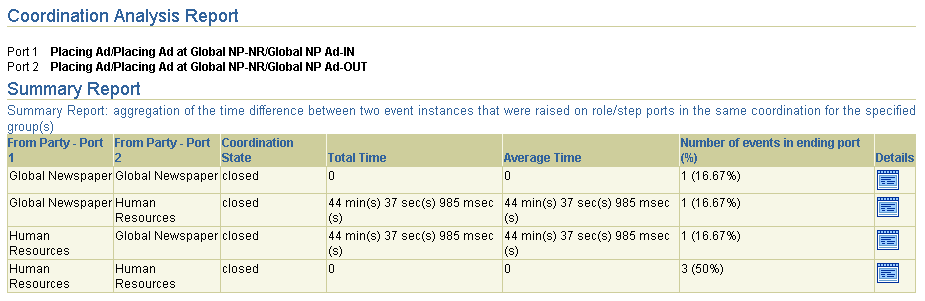
Click Details for a specific entry (for this example, the second entry).
The Details Report of the Coordination Analysis Report page appears.

Click Details.
An additional Details Report of the Coordination Details page appears.
Expand specific roles to display greater detail.
The upper portion of this page displays the following information.
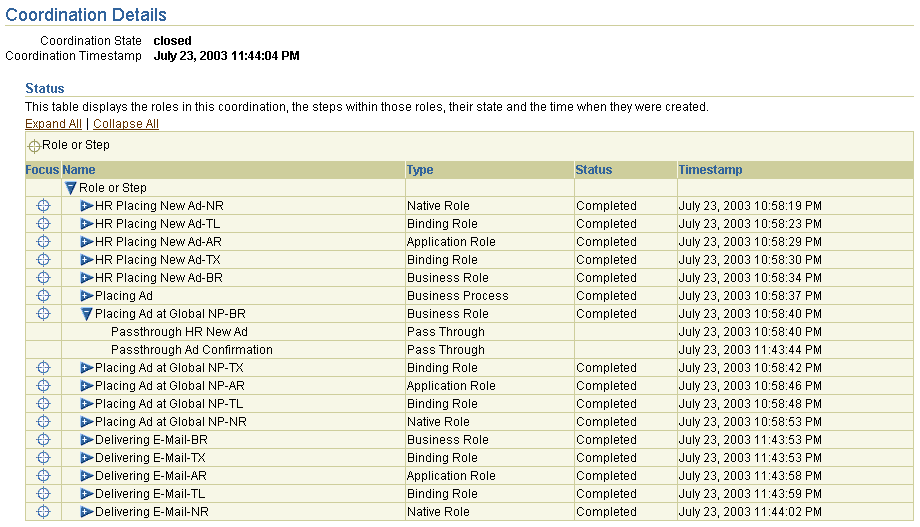
Note that within the business role, a pass-through step took a significant amount of time to process. This may be because an approval was required due to the purchase order being over a specific amount.
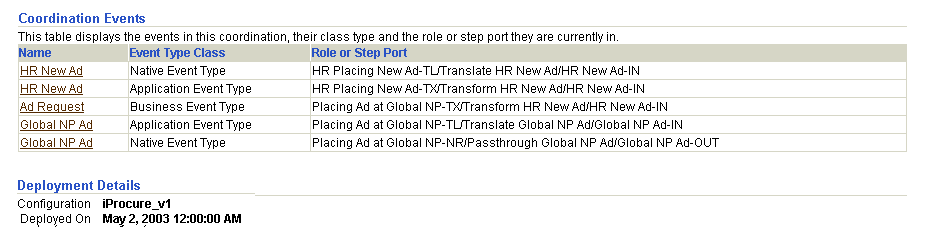
The lower portion of this page displays coordination event and deployment details.
The following are common user report user errors.
When creating an activity monitoring report, ensure that the string fields selected for Sum or Average have numeric content on the Event Analysis Report: Event Content page. Otherwise, blank Sum and Average columns appear in the final report.
Ensure that you have a deployed configuration running when you attempt to create a report. You cannot create reports if a configuration is not deployed.
This chapter describes how to create reports and provides the following report creation examples:
An event status report that identifies iProcurement purchase orders
A coordination status report that identifies coordination details
An error status report that identifies the current errors in an integration
An activity monitoring reports that identifies the total and average amount of desktop personal computers purchased this month
A process optimization reports that identifies business process efficiency
