| Oracle® Enterprise Manager Concepts 10g Release 1 (10.1) Part Number B12016-01 |
|


|
View PDF |
| Oracle® Enterprise Manager Concepts 10g Release 1 (10.1) Part Number B12016-01 |
|
|
View PDF |
The Enterprise Manager framework provides in-depth system monitoring that supports the timely detection and notification of impending problems across the entire Oracle environment
This chapter includes information about the following:
Metrics and alerts when used together provide a powerful mechanism by which to notify you of impending problems with your environment.
Metrics are units of measurement used to assess the health of your system. Each target comes with a predefined set of metrics. These metrics in turn have thresholds associated with them.
Thresholds are boundary values against which monitored metric values are compared. For example, for each disk device associated with the Disk Utilization (%) metric, you can define a different warning and critical threshold. Some of the thresholds are predefined by Oracle, others are not.
Once a threshold is reached, an alert is generated. An alert is an indicator signifying that a particular condition has been encountered and is triggered when one of the following conditions is true:
A threshold is reached.
An alert has been cleared.
The availability of a monitored service changes. For example, the availability of an application server changes from up to down.
A specific condition occurs. For example, an alert is triggered whenever an error message is written to a database alert log file.
These alerts can be associated with a notification, the automatic execution of a job, and so on.
Alerts are detected through a polling-based mechanism by checking for the monitored condition from a separate process at regular, predefined intervals. The majority of the Enterprise Manager metric-based alerts are polling based. Polling means that the Management Agent checks at intervals to see if the condition has been reached.
|
See Also: "About Alerts" in the Enterprise Manager online help |
The Enterprise Manager Grid Control Home page is the pinnacle of aggregated information. At a glance, you can determine the state of the enterprise, the overall availability of the targets, the severity of reported alerts, and the status of job executions.
In addition, if a target consists of other components, its home page will provide the rolled-up view of the status and performance of the target as a whole, and include aggregate performance of each component.
For example, the home page for an Oracle Application Server instance provides a rolled-up view of the performance of the Oracle Application Server instance, including the aggregate CPU and memory performance of each component in the instance. You can identify components that may require diagnostic investigation and drill down into those components for more detailed performance information, such as deployed applications.
Enterprise Manager automatically collects and aggregates performance and availability data for each target over time. When alert details are shown, they are displayed in context of the metric's historical values over time. You can examine this historical data to watch for performance trends where problems have occurred.
You can also correlate a target's metric data with its past historical averages or compare its values with other targets. Measurement against past performance or against other targets provides a tool for diagnosing whether or not a problem is isolated in time or space. For example, if the CPU Utilization on host PROD1 seems unusually high, you might want to compare it against its average to see if what you are observing is a spike or a more serious problem. You might further want to compare it against the CPU utilization of other hosts that support the same application, to determine if some load balancing of work is needed across multiple hosts.
You can compare metrics to determine trends in metric performance across various subsets of data of the same type.
The Compare Objects page allows you to contrast values for a particular metric within a target. As an example, you can compare the disk usage across various file systems. If the Filesystem Space Available (%) metric on host1 has three values /, /private, /private1, and you are currently viewing the details of the values of /private1, then you can compare the /private1 value details with the details for the values / and /private. The comparisons are plotted on the Metric Value History chart.
You can compare targets of the same type and determine how a target is performing with relation to others. Using the Compare Targets page, you can select targets from the Available Targets list. For your convenience, the results display in the Metric Value History chart on the Metric Detail page.
When a target becomes unavailable or if performance thresholds are reached, Enterprise Manager generates alerts in the Grid Control and notifies you and other appropriate administrators. Enterprise Manager supports notifications through e-mail (including e-mail to paging systems), SNMP (Simple Network Management Protocol) traps, and the running of custom scripts.
Enterprise Manager supports these various notification mechanisms through the use of notification methods.
Notifications are not limited to alerting administrators. You can define notification methods to run any custom operating system script or PL/SQL procedure, and thus automate any type of response to an alert. For example, you can define methods that call into a trouble-ticket system, invoke third party API's to share alert information with other monitoring systems, or even log a bug against a product.
|
See Also: "About Notifications" in the Enterprise Manager online help |
A notification method is used to specify the details associated with a particular notification mechanism, such as, which SMTP gateway(s) to use for e-mail, which operating system script to run to log trouble tickets, and so on. You, as a super administrator, perform a one-time setup of the various types of notification methods available for use. Only an administrator with super user privileges can manage (create, edit, or both) a notification method.
|
See Also: "Managing Notification Methods" in the Enterprise Manager online help |
Once you define the notification methods, you can then define notification rules. A notification rule is a set of conditions that determine when Enterprise Manager sends a notification. You specify these conditions as the set of targets, monitored metrics, and metric severities for which notifications should be sent. For example, you can define a rule such that notifications should be sent when any database goes down or tablespace usage becomes critical. During notification rule creation, you can associate the rule with multiple notification methods.
|
See Also: "Defining Notification Rules" in the Enterprise Manager online help |
When you install the option that creates the Management Repository, notification rules are created for the critical conditions that could occur for all supported target types. For example, for the database target type, a rule is created such that e-mail notifications are sent when any database becomes unavailable, or if any of its key health metrics (Datafile Usage(%), Archiver Hung Error Stack, Tablespace Space Used(%), and so on) becomes critical. Enterprise Manager sends the e-mail notifications to the e-mail address associated with the SYSMAN account. The SYSMAN account is the default super administrator account provided when you install Enterprise Manager.
|
See Also: "About Default Notification Rules for Supported Targets" in the Enterprise Manager online help |
Enterprise Manager provides a number of ways to help you get started monitoring your Oracle Environment.
Out-of-the-box monitoring simplifies a critical but potentially time-consuming task of setting up monitoring for managed targets, that is, services that you want to monitor. As you add targets to Enterprise Manager, options are automatically provided to monitor the target at a recommended or at a minimum level. Each level of monitoring consists of a set of metrics and predefined thresholds that are based on Oracle recommendations for those levels.
The recommended level covers full monitoring of the target. The minimum level covers monitoring of the target's key availability and performance indicators. These options allow you to quickly set up monitoring based on your high-level requirements.
Although you can rely on these Oracle recommendations, you still have the flexibility of later fine-tuning these thresholds to suit your particular environment.
Enterprise Manager provides proactive, unattended monitoring of the complete Oracle platform. A thorough set of performance and health metrics provide monitoring of each component (and subcomponent) of the Oracle environment:
Business Applications
Application Servers
Databases
Hosts
Operating Systems
The Oracle Management Agent on each monitored host monitors the status, health, and performance of all targets on that host. If the target goes down, or if a performance metric crosses a warning or critical threshold, Enterprise Manager generates an alert. This alert appears in the Grid Control and also triggers notification to the administrators specified in the notification schedule.
This allows you to be notified if the target:
Goes down
Is blacked out for scheduled maintenance
Current status cannot be determined due to network outages
Has other issues that trigger alerts, such as low disk space, high CPU usage, and so on
In addition to these proactive notifications, are availability status reports that you can access using the Grid Control. For each monitored target, Enterprise Manager provides a consolidated availability summary that shows its current and past availability status within the last 24 hours, 7 days, or month (31 days). This report provides you with critical information about day-to-day target availability. This report also provides information for upper management to determine if Service Level Availability (SLA) goals are being met.
|
See Also: "About Availability" in the Enterprise Manager online help |
When an alert is generated to notify you of availability or performance problems, you can check the Grid Control for more information about the metric that triggered the alert. This includes information on the metric's historical values that might show trends over the past week or month, and online help that provides advice on what you can do to fix or further diagnose the problem.
For example, if an alert is sent reporting ‘3 segments in the USERS tablespace are unable to extend', then you can consult the online help. The help would suggest that you look into increasing the value of the segment's MAXEXTENTS storage parameter or rebuild the segment with a larger extent size.
In addition to providing quick views to the health of your system, the Grid Control provides drill-downs to help you analyze the root of any problem. For example, click Critical Alerts to view the message associated with the alert and study the metrics causing the problem.
You can also view a particular type of target, for example, Management Agents. Select the Management Agent in which you are interested and drill down to the associated page.
If memory usage is high, one of the targets you could analyze is the OC4J target. The OC4J home page presents a roll-up of status and performance metrics for the container and its applications, including:
How long the container has been running and what applications are active.
Container resource usage such as the percentage of CPU and memory resources being consumed.
Volume and average processing time of application requests and transactions.
The composite data presented in the roll-up is broken down for each deployed application. You can easily determine which application is incurring the highest volume of requests or longest response time. An application can be further examined by drilling into the application to view the performance of individual objects such as servlets and Enterprise JavaBeans (EJBs). In this way, you and the application developer can isolate the source of the problem more easily.
One of the noteworthy features of Enterprise Manager is that you can customize monitoring for your specific needs in various ways. You can:
Edit thresholds to change the out-of-box settings to fit your environment.
Copy monitoring settings from one target to another.
Use metric baselines as an aid to creating thresholds.
Create user-defined metrics.
Out of the box, Enterprise Manager comes with thresholds for critical metrics. Warning and critical thresholds are used to generate an alert, letting you know of impending problems so that you can address them in a timely manner.
To better suit the monitoring needs of your organization, you can edit the thresholds provided by Enterprise Manager and define new thresholds. When defining thresholds, the key is to choose acceptable values to avoid unnecessary alerts, while still being notified of issues in a timely manner.
You can establish thresholds that will provide pertinent information in a timely manner by defining metric baselines that reflect how your system runs for a normal period of time.
The metrics listed on the Edit Thresholds page are either default metrics provided by Oracle or metrics whose thresholds you can change.
You may want thresholds for performance metrics to be based on deviations from real target performance instead of absolute numbers. For example, if for a given day, performance for a database was acceptable, and that database was running under normal workload, then you might want to define thresholds such that you are notified only when database performance becomes 10% worse than that given day. Such thresholds can be defined using metric baselines.
A metric baseline is a snapshot of a target's performance at a given point in time. When used for thresholds, you should define a metric baseline that will be used as the performance norm – preferably a day in the past when performance was good for the target and it was running under normal to high workload. A metric baseline thus consists of a target's performance metrics for a good day.
In the Grid Control, you define a metric baseline by first specifying a date in the past that will be used as the performance norm. Next you specify percentage values from the metric baseline that represent the points at which performance becomes a problem at a warning, then more critical level. These percentages are then calculated into specific warning and critical threshold values for the performance metrics.
For example, if the database supporting the financial system had good performance on October 1, 2003, you could use that date to set up the metric baseline for the financial database. Next you specify 10% and 20% as warning and critical percentages respectively. Enterprise Manager then calculates values that are 10% and 20% worse than the metric baseline data, and provides these calculated values as the warning and critical thresholds for the database's performance metrics. You can review or edit the calculated values, then apply them as thresholds for the target. When any performance metric reaches its threshold, Enterprise Manager generates an alert.
Metric baselines thus provide a two-fold benefit – you can now define thresholds based on high level performance goals and thresholds can be more fine-tuned to reflect actual performance numbers.
|
See Also: "About Thresholds" in the Enterprise Manager online help |
Enterprise Manager also provides the opportunity for you to copy thresholds from one target to another target as long as they are the same target type. Copying thresholds allows you to easily standardize monitoring across different targets, and provides consistency between targets.
User-defined metrics allow you to extend the reach of Enterprise Manager's monitoring to conditions specific to your particular environment. Specifically, if you want to monitor a particular condition, for example, to check successful completion of monthly system maintenance routines, you can:
Write a custom script that will monitor that condition
Create a user-defined metric that will use your custom script
Each time the metric is evaluated by Enterprise Manager, it will use the script you specified, relying on that script to return the value of the condition. Once a user-defined metric is defined, all other monitoring features – threshold-based alerting, proactive notifications, historical collections, seamless integration with the Grid Control – are automatically available to the metric. If you already have your own library of custom monitoring scripts, you can leverage these monitoring features by integrating your scripts as user-defined metrics in Enterprise Manager.
For help on defining user-defined metrics, click Help at the top of the Create User Defined Metric page.
|
See Also: Extending Oracle Enterprise Manager manual |
A job is a unit of work that you define and schedule to perform commonly-run tasks. A job is defined by its name, description, parameters, targets, and schedule.
Use the Job General page to set or modify the parameters of the job. After you specify a name for the job, you can set the various attributes of the job.
On the target home page, the Job Activity section displays the number of suspended executions and problem executions. From these links, you can drill down to investigate which jobs are problematic and why.
|
See Also: "About Jobs" in the Enterprise Manager online help |
Blackouts allow you to suspend target monitoring so you can schedule maintenance periods for these targets. When you black out a target, you prevent unnecessary alerts from being sent when you bring down a target for maintenance. While aiming to meet Service Level Availability goals, you can use blackouts to guarantee that scheduled down periods are not calculated as true down time when you calculate overall target availability.
You can define a blackout for individual targets, a group of multiple targets that reside on different hosts, or for all targets on a host. You can schedule the blackout to run immediately or in the future. You can also schedule the blackout to run indefinitely or to stop after a specific amount of time. If, during the maintenance period, you discover that you need more or less time to finish the maintenance tasks, you can extend or stop the blackout that is in effect.
Blackout functionality is available from the Grid Control, as well as through the Management Agent command-line interface (CLI). The CLI is useful to you if you like to incorporate the blacking out of a target within your maintenance scripts.
|
See Also: "About Blackouts" and "Creating Blackouts" in the Enterprise Manager online help |
The Enterprise Manager framework itself must be operating efficiently in order to effectively perform system monitoring of targets. Enterprise Manager has self-monitoring features which monitor the availability and performance of key critical components of the framework. You can access information about Enterprise Manager configuration and its overall health through the Management System tab in the Grid Control.
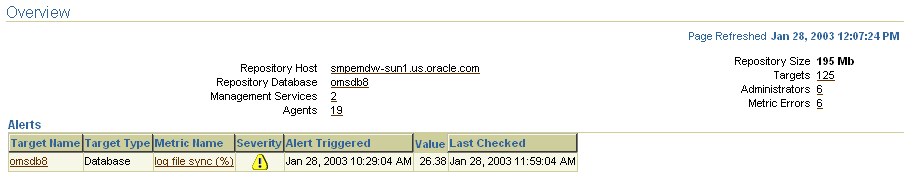
The Overview page (Figure 2-1) provides an overview of the entire Enterprise Manager framework: repository host and database information, number of Management Services, number of Management Agents, number of Administrators, and any open alerts on the repository host or database.
Figure 2-1 Overview Page of the Management System
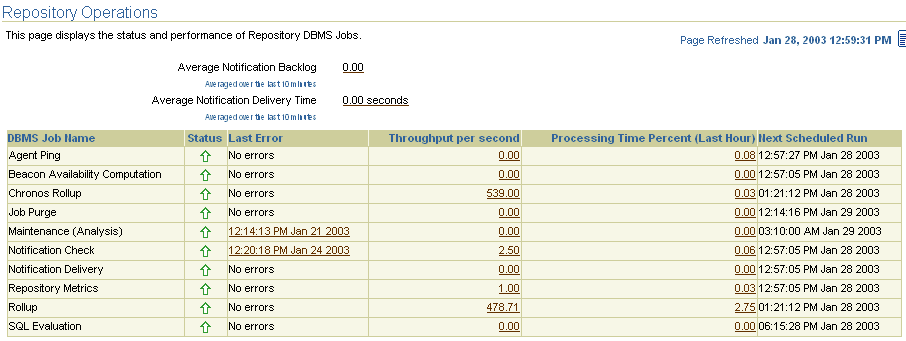
You can view the repository operations by viewing the Repository Operations page. This page provides you with an overview of the status and performance of the Repository DBMS Jobs that handle part of the Enterprise Manager functionality.
The following DBMS jobs are examples of the jobs that run within the Management Repository and require no user input:
Agent Ping
Checks if the Management Agents are gathering information about the host computer and information about the targets installed on the host computer.
Maintenance (Analysis)
Runs an analysis on the Enterprise Manager schema to ensure that the execution of queries is optimal. The database accesses the information in the schema to determine the best way to execute a query.
SQL Evaluation
Evaluates the performance of the SQL code being run in the Management Repository for Enterprise Manager.
Roll Up
Checks the availability of the targets and summarizes this information in the Grid Control.
To determine how well the Management Repository jobs are functioning, view the Throughput per second and Processing Time Percent (Last Hour) columns. If the Processing Time Percent (Last Hour) is running large and the Throughput is low, there may be problems in that area of management.
If there are delays in notifications, examine the following metrics to determine the cause of the delay:
Average Notification Backlog
The average number of notifications which could not to be processed within the time allotted for notification delivery. This number may fluctuate at times. An upward trend over time may indicate an increased workload and the reason for the delays.
Average Notification Delivery Time
The average time it took to process a notification from the time the notification job receives the notification until the notification is sent. This number may fluctuate. An upward trend over time will reflect a delay in notifications sent.
If your average notification backlog and delivery time are high, you may consider:
Checking the number of notification rules defined and verify that they are all necessary, removing those that are not.
Verifying that the addresses being used for the notifications are correct.
Adjusting the notification rules so that you can be notified in a timely matter.
Figure 2-2 provides an example of statistics relating to a Management Repository jobs.
Figure 2-2 Status of the Oracle Management Repository Jobs
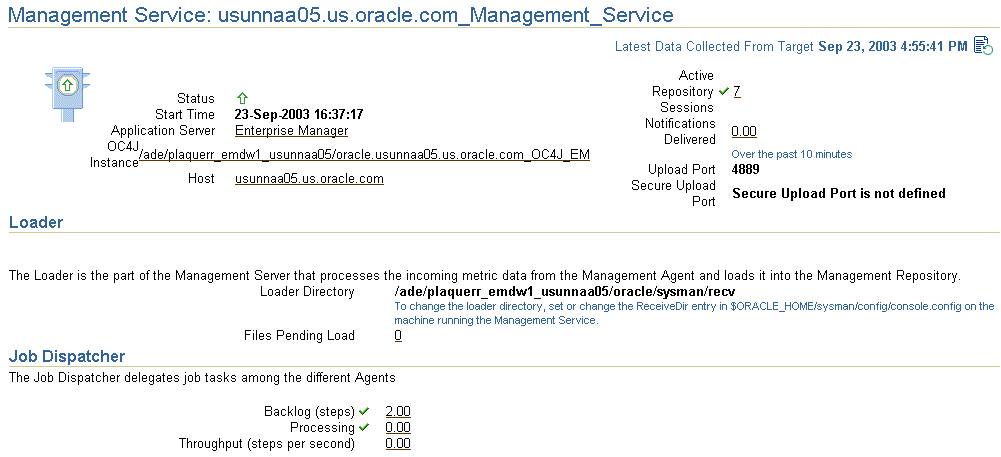
The Management Services page provides you with an overview of the health and configuration of all Management Services, including their status, any errors encountered, the performance (load processing) of the Management Services when loading metric data to the Management Repository, and information on files waiting to be loaded into the Management Repository.
After you click the name of one of the Management Services, the Management Service page for that particular Management Service appears. From the Management Service page, you can view the status (up or down) and performance (load processing) of the particular Management Service. You can easily view how well the Management Service is performing by looking at the Loader and Job Dispatcher sections. You can also look at the performance over time; for example, for the same amount of data processed, a decreasing trend in loader throughput might indicate that resources on the machine are being maximized and an additional Management Service might need to be added for load balancing.
Figure 2-3 provides an example of statistics relating to Management Services.
Figure 2-3 Status of an Oracle Management Service
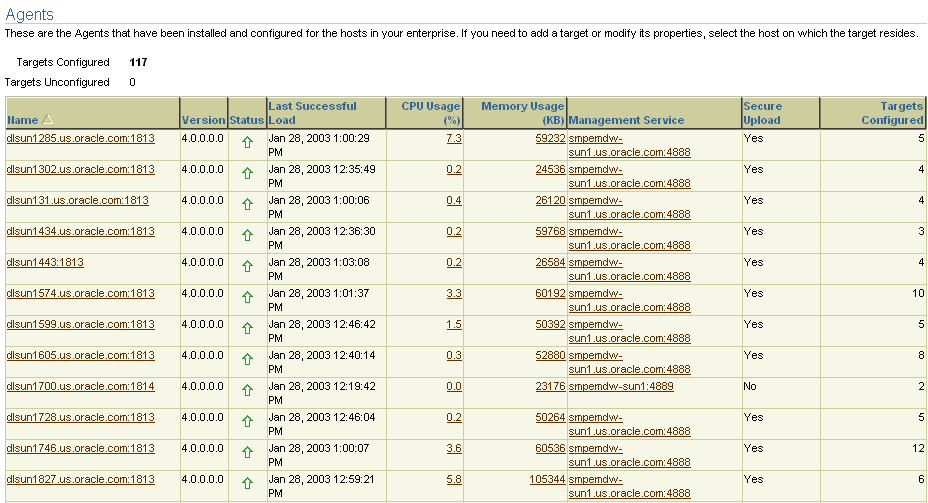
The Oracle Management Agent page provides you with an overview of all Management Agents, including their status, versions, information about data they are loading to the Management Service, resource consumption, and so on. You can easily determine if a Management Agent is up or down or if there are any metric collection errors seen by any Management Agent.
On the Management Agent Home page, verify:
If a Management Agent is up or down
If a Management Agent is uploading data to the Management Service
When was the last successful upload to the Management Service
Figure 2-4 shows statistics for the Management Agents being monitored.
Figure 2-4 Status of Installed Oracle Management Agents
|
 Copyright © 2003 Oracle Corporation All Rights Reserved. |
|

