|
Oracle® Business Intelligence Discoverer Plus User's Guide
10g Release 2 (10.1.2.0.0) Part No. B13915-01 |
|
 Previous |
 Next |
|
Oracle® Business Intelligence Discoverer Plus User's Guide
10g Release 2 (10.1.2.0.0) Part No. B13915-01 |
|
 Previous |
 Next |
You edit a graph to change the graph settings for the graph that Discoverer creates for you automatically for every worksheet. Discoverer graphs enable you to display data and trends visually. You can display, hide, and edit worksheet graphs.
Discoverer provides the Edit Graph dialog to enable you to change the graph settings for a graph. If at any time you want to use default settings for the remaining tabs in the Edit Graph dialog, simply click OK.
Hint: Before you start, make sure that the worksheet displays the data that you want to plot on the graph (for more information, see "About using graphs in Discoverer").
To edit a graph:
Choose Edit | Graph to display the "Edit Graph dialog: Type tab", and choose a graph type from the list of graph types and graph sub-types.
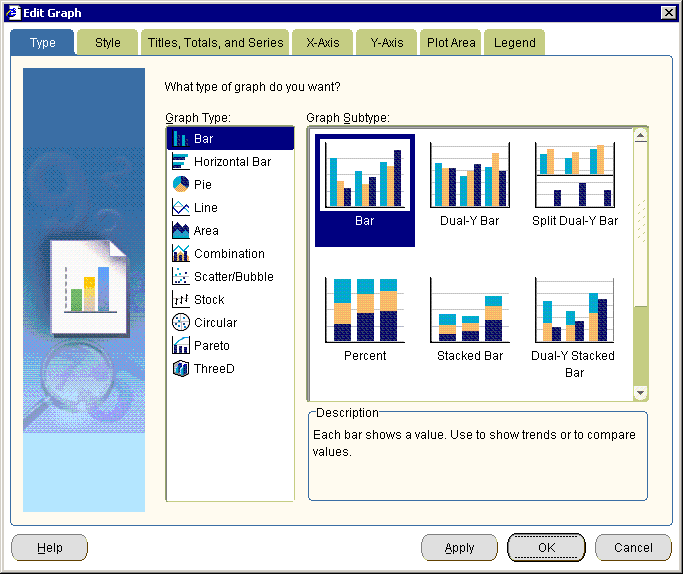
For more information about choosing a graph type, see "About graph types available in Discoverer".
Note: If the worksheet already contains a graph that is hidden (i.e. the Graph check box is cleared in the View menu), Discoverer displays the Edit Graph dialog, which enables you to edit the graph.
Display the "Edit Graph dialog: Style tab", which enables you to select a graph style.
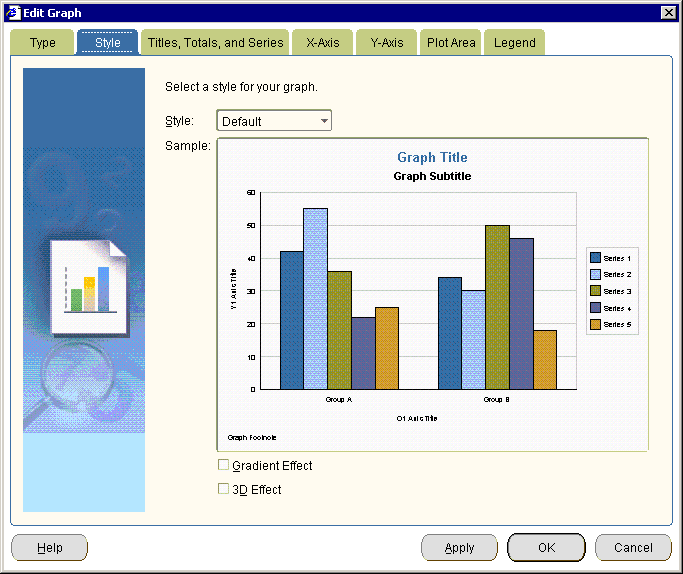
A graph style is a predefined set of colors and text styles that Discoverer applies to the graph. For example, Default, Autumn, Financial, Black and White.
Display the "Edit Graph dialog: Titles, Totals, and Series tab", where you:
(optional) define a graph title
use the What would you like to display? options to select what data you want to display (i.e. data only, totals only, or both data and totals)
use the Graph series by options to select whether to plot data by row or column
(optional) when creating a pie graph, select which row or column you want to plot on the graph
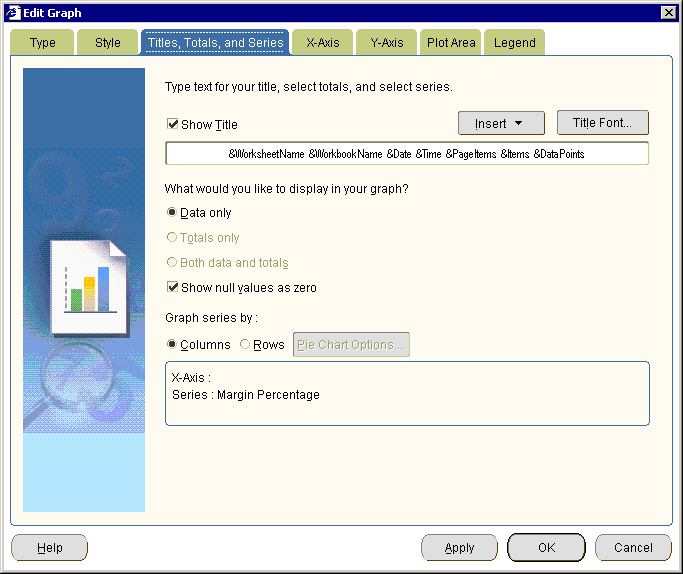
If you are creating a pie graph, the Pie Chart Options button is active.
(optional) If you are creating a Pie Chart, select the column or row that you want to plot on the graph, as follows:
Click Pie Chart Options to display the "Edit Graph dialog: Pie Chart Options tab (column)" or "Edit Graph dialog: Pie Chart Options tab (row)".
Select the row or column that you want to graph from the list of items.
Click OK.
Note: When you click Next, you go straight to the "Edit Graph dialog: Legend tab". You do not define X or Y axes for pie graphs.
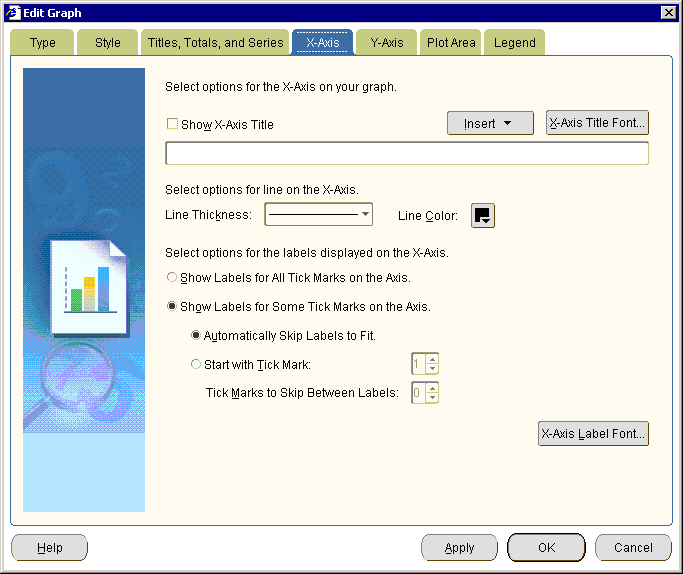
Display the "Edit Graph dialog: X-Axis tab", where you specify how the X axis is displayed.
Display the "Edit Graph dialog: Y-Axis tab", where you specify how the Y axis is displayed.
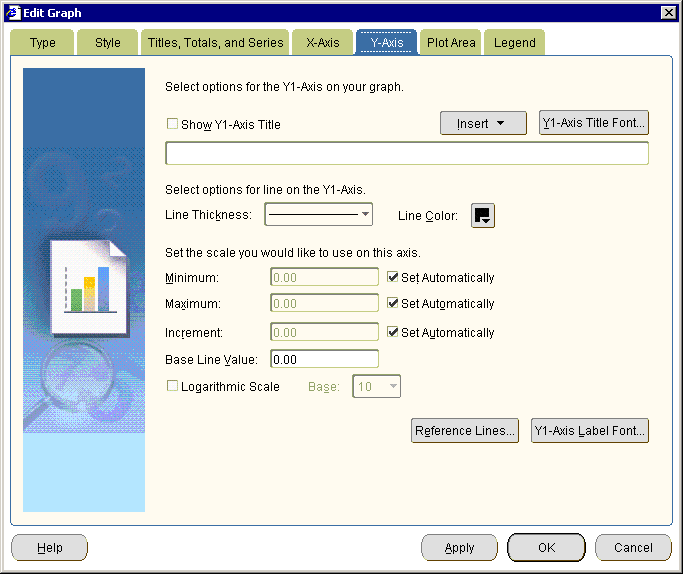
(optional) If you are creating a dual-Y graph, display the "Edit Graph dialog: Y2-Axis page (on dual-Y type graphs)", where you specify how the Y-2 axis is displayed.
For more information about creating dual-Y graphs, see "Notes about creating dual-Y graphs".
Display the "Edit Graph dialog: Plot Area tab", where you specify the color and style of plotted data.
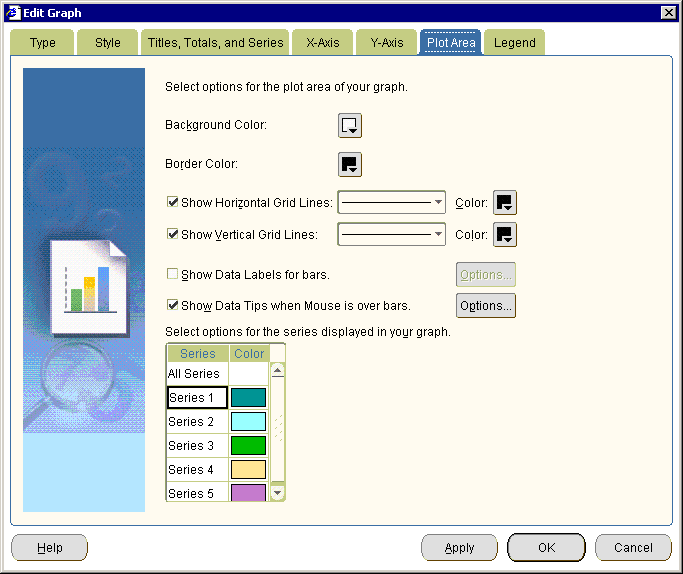
Display the "Edit Graph dialog: Legend tab", where you specify the graph legend that provides information about how items are represented on the graph.
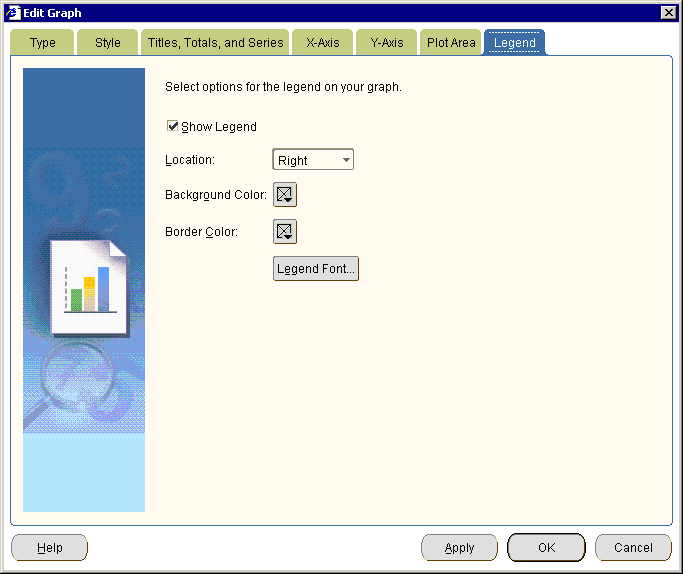
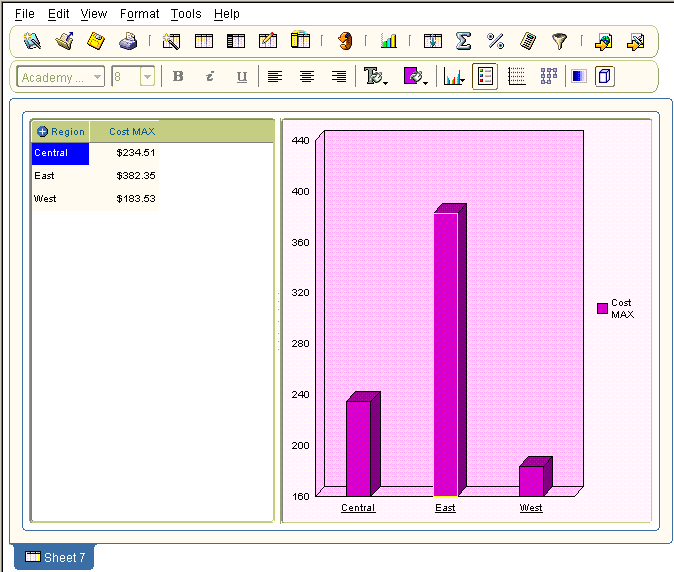
Click the Finish button to save the details and display the graph.
Discoverer displays the graph on the worksheet. By default, graphs are displayed at the right-hand side of worksheet data. To change where a graph is displayed, choose View | Graph Placement and choose a position from the list of options.
Notes
To automatically arrange graph components, right-click on the graph border and choose Auto Layout.